Silicon Radar EasyRadar User manual

- 1 -
User Guide
Evaluation Kit
EasyRadar
preliminary
Status:
Date:
Author:
initial 12 Jul. 16 Silicon Radar GmbH
Version:
Document number:
Filename:
Page:
0.2 RS_120_05 User Guide EasyRadar
1 of 23
|Silicon Radar GmbH
|Im Technologiepark 1
|15236 Frankfurt (Oder) |Germany
|fon +49.335.557 17 60
|fa
x +49.335.557 10 50
|http://www.siliconradar.com

TRX_120_01 Radar Sensor Evaluation Kit
120GHz MMIC IQ Transceiver TRX_120_01
Version T301 Alumina Cap
- 2 -
Table of Contents
1 Overview and Package Contents..............................................................................................4
1.1 Overview ............................................................................................................................5
1.2 Features .............................................................................................................................5
1.3 Application..........................................................................................................................5
2 Installation ................................................................................................................................6
2.1 Hardware Installation..........................................................................................................6
2.2 Jumper Settings..................................................................................................................6
2.2.1 Use Case 1: Supply and communication via USB......................................................6
2.2.2 Use Case 2: Power from standard source and communication over WLAN...............7
2.3 Control Header ...................................................................................................................7
2.4 Software Installation ...........................................................................................................8
2.4.1 Connecting to the board using a wireless LAN connection ........................................8
2.4.2 Connecting the board via USB...................................................................................8
3 Getting Started with the EasyRadar Sensor Evaluation Kit ......................................................9
3.1 The User Interface..............................................................................................................9
3.2 Control Panel (Sensor Setup)...........................................................................................10
3.2.1 COM Panel:.............................................................................................................10
3.2.2 Sys Config:..............................................................................................................11
3.2.3 RF params:..............................................................................................................12
3.2.4 BB processing: ........................................................................................................12
3.2.5 Target Recognition: .................................................................................................12
3.2.6 Scene Controls:.......................................................................................................13
3.2.7 Camera Controls: ....................................................................................................13
3.3 Main Menu:.......................................................................................................................13
3.3.1 FFT View.................................................................................................................13
3.4 Status field and Target list: ...............................................................................................14
3.5 Phase Diagramm..............................................................................................................15
3.6 Spectrogram:....................................................................................................................15
4 Understanding the display ......................................................................................................16
4.1 Signal processing flow......................................................................................................17
5 Troubleshooting......................................................................................................................17
5.1 Target not recognized.......................................................................................................17
5.1.1 Too many targets -> CFAR doesn’t work.................................................................17
6 Firmware Update....................................................................................................................18
6.1 Microcontroller Board........................................................................................................18
6.2 WiFi Module .....................................................................................................................18
7 Hardware................................................................................................................................19
7.1 Schematics.......................................................................................................................19
7.2 Board Layout ....................................................................................................................19
7.3 Changing Hardware Parameters ......................................................................................19
7.3.1 DC- Coupling or change high pass filter response...................................................19
7.3.2 Change low pass filter response..............................................................................19
7.3.3 Change Gain ...........................................................................................................19

EasyRadar Sensor Evaluation Kit
- 3 -
8 Communication Protocol.........................................................................................................20
8.1 Compressed Data Format ................................................................................................20
8.2 Extended data format .......................................................................................................20
8.3 Register Description .........................................................................................................20
8.3.1 Communication from sensor module to backend .....................................................21
9 Disclaimer / License ...............................................................................................................23
List of Figures
Figure 1 EasyRadar Sensor Evaluation Kit and screenshot of the GUI ........................................4
Figure 2 Screenshot of the Websocket-Server window ................................................................8
Figure 3 Main window of the EasyRadar WebGUI .......................................................................9
Figure 4 Screenshot of the main GUI window and elements in the display scene. .....................16
Figure 5 Signal flow of the firmware. Data can be extracted at various intermediate stages.......17
Figure 6 Jumper settings and program select switch for the WiFi module. .................................18
Figure 7 Assembly drawings of the module PCBs......................................................................19
Figure 8 Signal chain in the Baseband amplifier.........................................................................19
Figure 9 Register definition of the sensor module ......................................................................20
Figure 10 Communication protocol definition...........................................................................22

EasyRadar Sensor Evaluation Kit
- 4 -
1 Overview and Package Contents
Thank you for purchasing the Silicon Radar EasyRadar sensor module. The module is an easy to
use, state of the art Radar sensor evaluation system including a high performance target
recognition algorithm and WLAN connectivity.
What’s in the box?
•Radar Sensor Eval Kit consisting of 4 separate stacked boards
oTRX_120 Radar Frontend Board
oTRX_24 Radar Frontend Board
oTRX_Eval Base-Band Board
oMicrocontroller Board
Figure 1 EasyRadar Sensor Evaluation Kit and screenshot of the GUI
The EasyRadar Evaluation Kit demonstrates the performance and parameters of the different
Radar transceiver chips of Silicon Radar.
The aim of the evaluation kit is to showcase the FMCW / CW radar mode using a beginner-friendly
system. However, due to the great flexibility of the system it can be used to change virtually any
parameter that is important for a Radar Sensor application and learn to know the basics of Radar
Signal processing.
Silicon Radar puts the focus on an easy-to-use approach and supports the customer with a set of
default key parameters guaranteeing a proper operation of the sensor (including automatically set
parameters of optimized operation mode). The sensor is not optimized to show the maximum
ratings of all the chip properties.

EasyRadar Sensor Evaluation Kit
- 5 -
1.1 Overview
The EasyRadar Evaluation Kit is an experimental system for Silicon Radars different integrated IQ
transceivers with antennas in package and on board. For more information about the features of
the transceiver chips, all data sheets are available on the Silicon Radar webpage.
We developed the evaluation kit to demonstrate our millimeter-wave sensors to measure the
distance and velocity using RADAR principles. Both - frequency modulated continuous wave
(FMCW) or continuous wave (CW) - principles are applied.
1.2 Features
The EasyRadar Sensor Evaluation Kit feature set includes:
•Phase locked loop running the integrated low phase noise Push-Push VCO in the
transceiver chip
•Frequency lock control to automatically adjust the start and stop frequencies of the
generated FMCW RADAR frequency ramp
•Programmable FMCW parameters
•122 GHz ISM band or 7 GHz high bandwidth FMCW operations for TRX120 chips
•24 Ghz ISM band or 3 GHz high bandwidth operation for TRX24 chips
•Analog signal conditioning to amplify and filter the I and Q output signals of the transceiver
•Analog-to-Digital-converter to digitize the I and Q receiver signals
•Microcontroller to do
◦PLL setup, ramp configuration, A-D conversion
◦all the signal processing and target recognition for up to 16 targets simultaneously
◦transfer to the host system, trigger configurable GP output pins
•A web-based GUI user interface to change all relevant parameters, plot the FFT of the
baseband channels, display the distance and velocity measurements and the target list.
•Standard USB communication with PC or over wireless LAN
•DC-DC conversion to provide single supply from USB or an external DC supply
1.3 Application
The EasyRadar Sensor Evaluation Kit is supposed to be used in laboratory environments only. All
regulations of the according Silicon Radar Evaluation Agreement may apply.
IMPORTANT:
The Radar frontends are able to use a larger bandwidth than allowed in the ISM bands.
Therefore it is up to the customer to make sure that the frontend is not used in these
conditions. The Evalkit is not supposed to be used as a customer product! It is solely
designed for short-term evaluation purposes.

EasyRadar Sensor Evaluation Kit
- 6 -
2 Installation
2.1 Hardware Installation
The hardware of the EasyRadar Sensor Evaluation Kit consists of two boards and the USB cable.
For proper hardware installation, please follow the order given below:
•First of all, the radar board and the base-band board should be connected to each other
properly. Silicon Radar delivers the kit fully assembled. It is not recommended but possible
to separate the boards. Please follow the instructions to combine both boards after
separation to bring them back to operation mode:
The standard header pins on both boards must be connected in a way that CN7 on the
baseband board connects to CN7 on the micro controller board and CN10 connects to
CN10. Improper connections may cause shortcuts and destroy the boards.
The RFE Board must be attached to the baseband board from the top side (where the LEDs
are located). It can only be connected in one way since the headers are different.
•Second, the boards can be connected to a PC using the USB cable. We recommend using
an active USB Hub between the PC and the board, especially when connected to a Laptop.
•Alternatively, the board can be powered by a standard 5V supply via the control header.
•The software has to be started after connecting the hardware to the PC for an appropriate
USB communication.
2.2 Jumper Settings
2.2.1 Use Case 1: Supply and communication via USB
JP5 on µC-Board U5V
Control Header All open
WiFi Switch Off-position

EasyRadar Sensor Evaluation Kit
- 7 -
2.2.2 Use Case 2: Power from standard source and communication over WLAN
Connect a 5V source to the control header.
Control header 5V supply and connect
MT-WR and MR-WT with
jumpers.
JP5 on µC-Board E5V
WiFi Switch On-position
2.3 Control Header
The control header is used to connect to the board in different modes. In programming mode it is
used to program the WiFi module or the µController. In WiFi-mode it is used to connect the WiFi
module to the µController. And it also can be used to trigger the measurement via the external
Trigger line.
Pin
Description
5V 5V supply
GD GND
MT µController TX
(*)
MR µController RX
(*)
TR External Trigger
(*)
WT WiFi TX
(*)
WR WiFi RX
(*)
(*) 3.3V tolerant only!!
EasyRadar Sensor Evaluation Kit
- 8 -
2.4 Software Installation
The evaluation software is displayed in a Web Browser which supports WebGL.
We recommend the following Browsers:
Chrome, Firefox.
2.4.1 Connecting to the board using a wireless LAN connection
Due to the wireless LAN connectivity of the module, the installation process is very straightforward.
On power-up the module searches for the last saved WiFi access point. This is indicated by the
rapidly flashing blue LED. If there is no known WiFi access point (AP) accessible, the WiFi module
opens an own AP. This is indicated by the slowly flashing blue LED on the module (40 secs).
Please connect to this AP using the following login credentials:
SSID: EasyRadar | Password: Greetings
The module is now in AP mode and waits for 40 seconds until it starts the Radar application.
If the connection is successful, the blue LED is switched off.
Please find out the IP of the module by checking your DHCP server (WLAN AP).
The module can now be used as described in chapter 3.
2.4.2 Connecting the board via USB
Connecting the board via USB is only supported for Windows systems at this time.
To connect the board via USB, the ST Microelectronics Virtual Com Port driver has to be installed
first. Please download it from the ST Webpage:
http://www2.st.com/content/st_com/en/products/development-tools/software-development-
tools/stm32-software-development-tools/stm32-utilities/stsw-stm32102.html
or from the Silicon Radar download page:
[link]
The second step is to install a 32-bit Java Runtime Environment from:
http://www.oracle.com/technetwork/java/javase/downloads/jre8-downloads-2133155.html
Please make sure you select a 32-Bit driver or the communication will not work.
Thirdly, run the Com2WebSocket application after changing the path in the runme.bat to your
java.exe path.
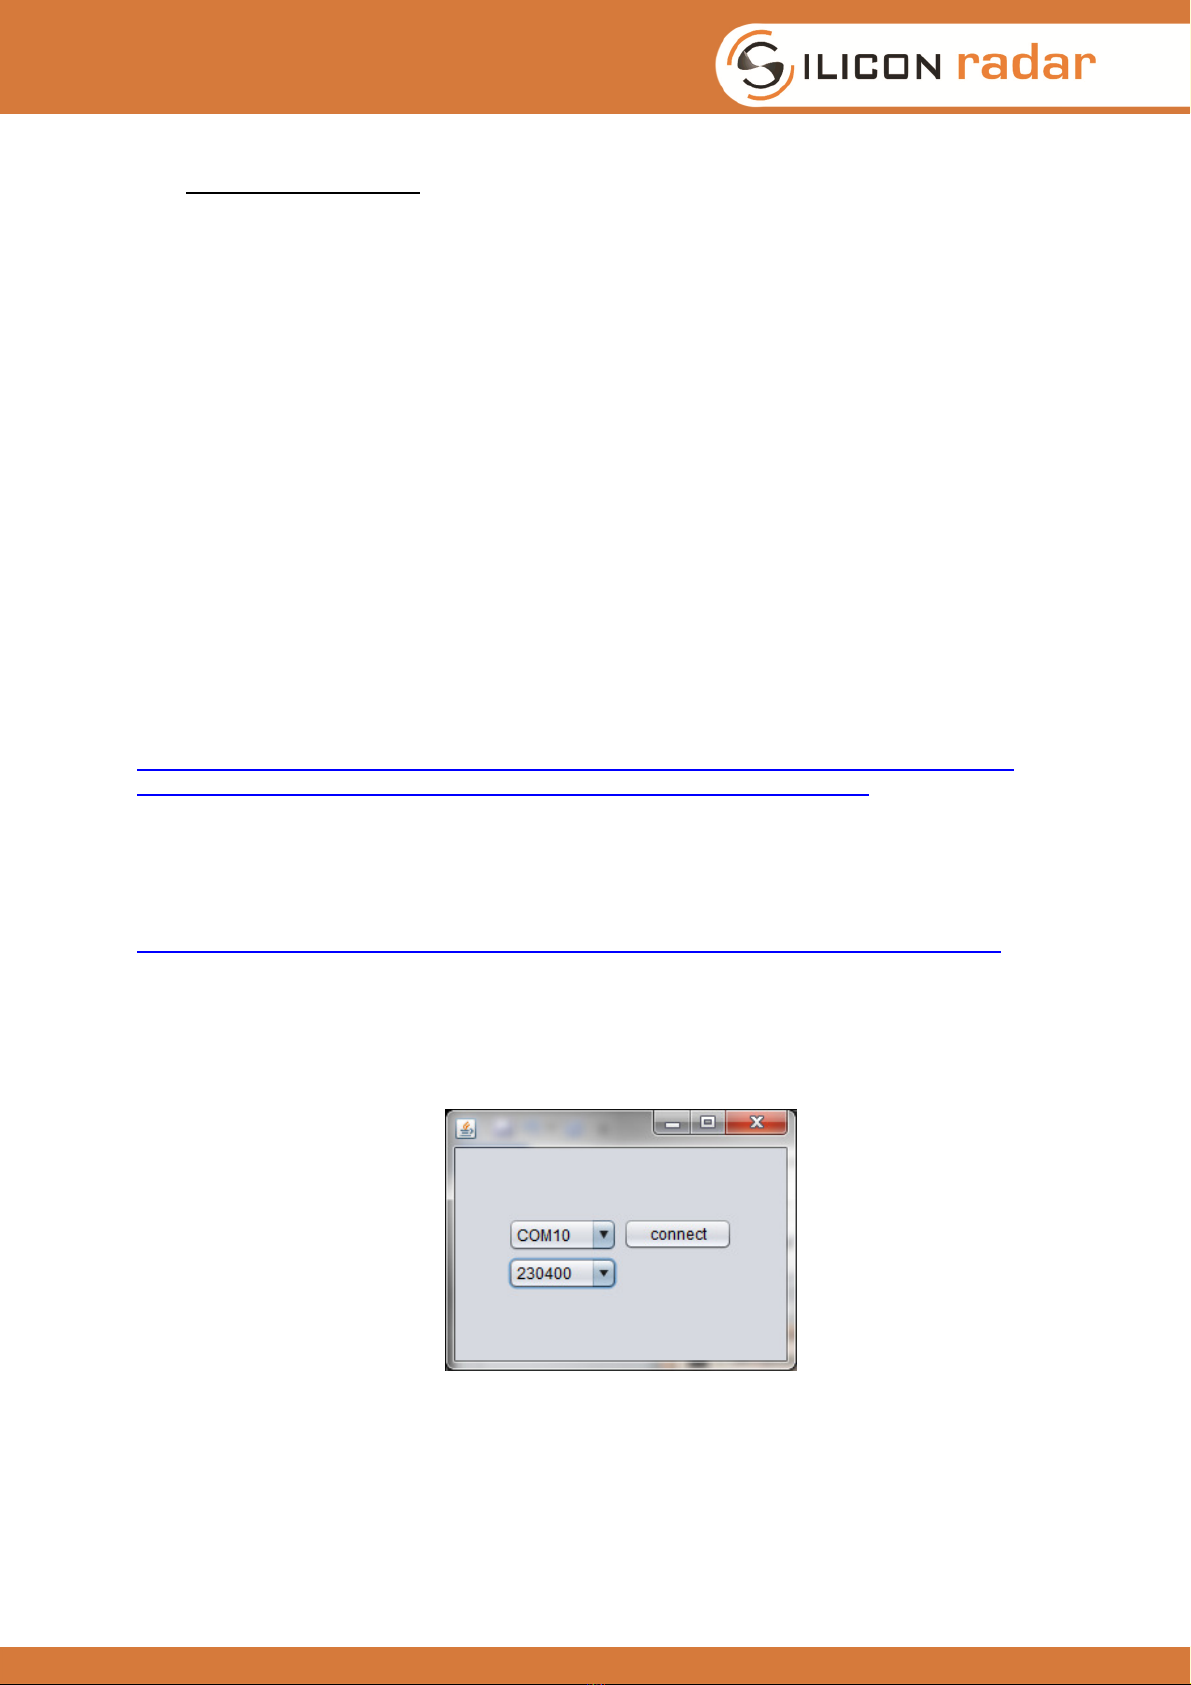
A small window with the available com ports will open:
Figure 2 Screenshot of the Websocket-Server window
Please select the appropriate COM port of your Evalkit, and select 230400 baud as the baudrate.
Then click open. The program then opens a Websocket Server which is fed with the data from the
com port.
The Evalkit is now ready to run.

EasyRadar Sensor Evaluation Kit
- 9 -
3 Getting Started with the
EasyRadar Sensor Evaluation Kit
3.1 The User Interface
The user interface is started by opening the index.html in the provided public_html folder. Please
use Firefox or Chrome to display the GUI as there are known issues with other browsers.
The Software is developed to demonstrate the functionality of Silicon Radars Transceiver chips as
a millimeter-wave distance and velocity sensor front end. Once the WebGUI is launched the main
window is displayed (see Figure 3).
Figure 3 Main window of the EasyRadar WebGUI
The Silicon Radar WebGUI consists of four main panels:
•the control panel
•the main menu on the top of the screen, with the active view in orange
•the scene/canvas itself where the data is displayed
•the target list with the status field at the right side of the screen (draggable)

EasyRadar Sensor Evaluation Kit
- 10 -
3.2 Control Panel (Sensor Setup)
On the left side of the GUI you will find the controls for the interface. It is used to connect to the
server, send data to the server and to change the view. It contains the following elements:
•COM
•Sys Config
•Log
•RF Params
•BB Processing
•Target Recognition
•Scene Controls
3.2.1 COM Panel:
Type in the IP address and port of the WiFi module
(without “ ”), i.e.:
“192.168.4.1:9090”
or for communication via the USB port:
“localhost:9090”
EasyRadar Sensor Evaluation Kit
- 11 -
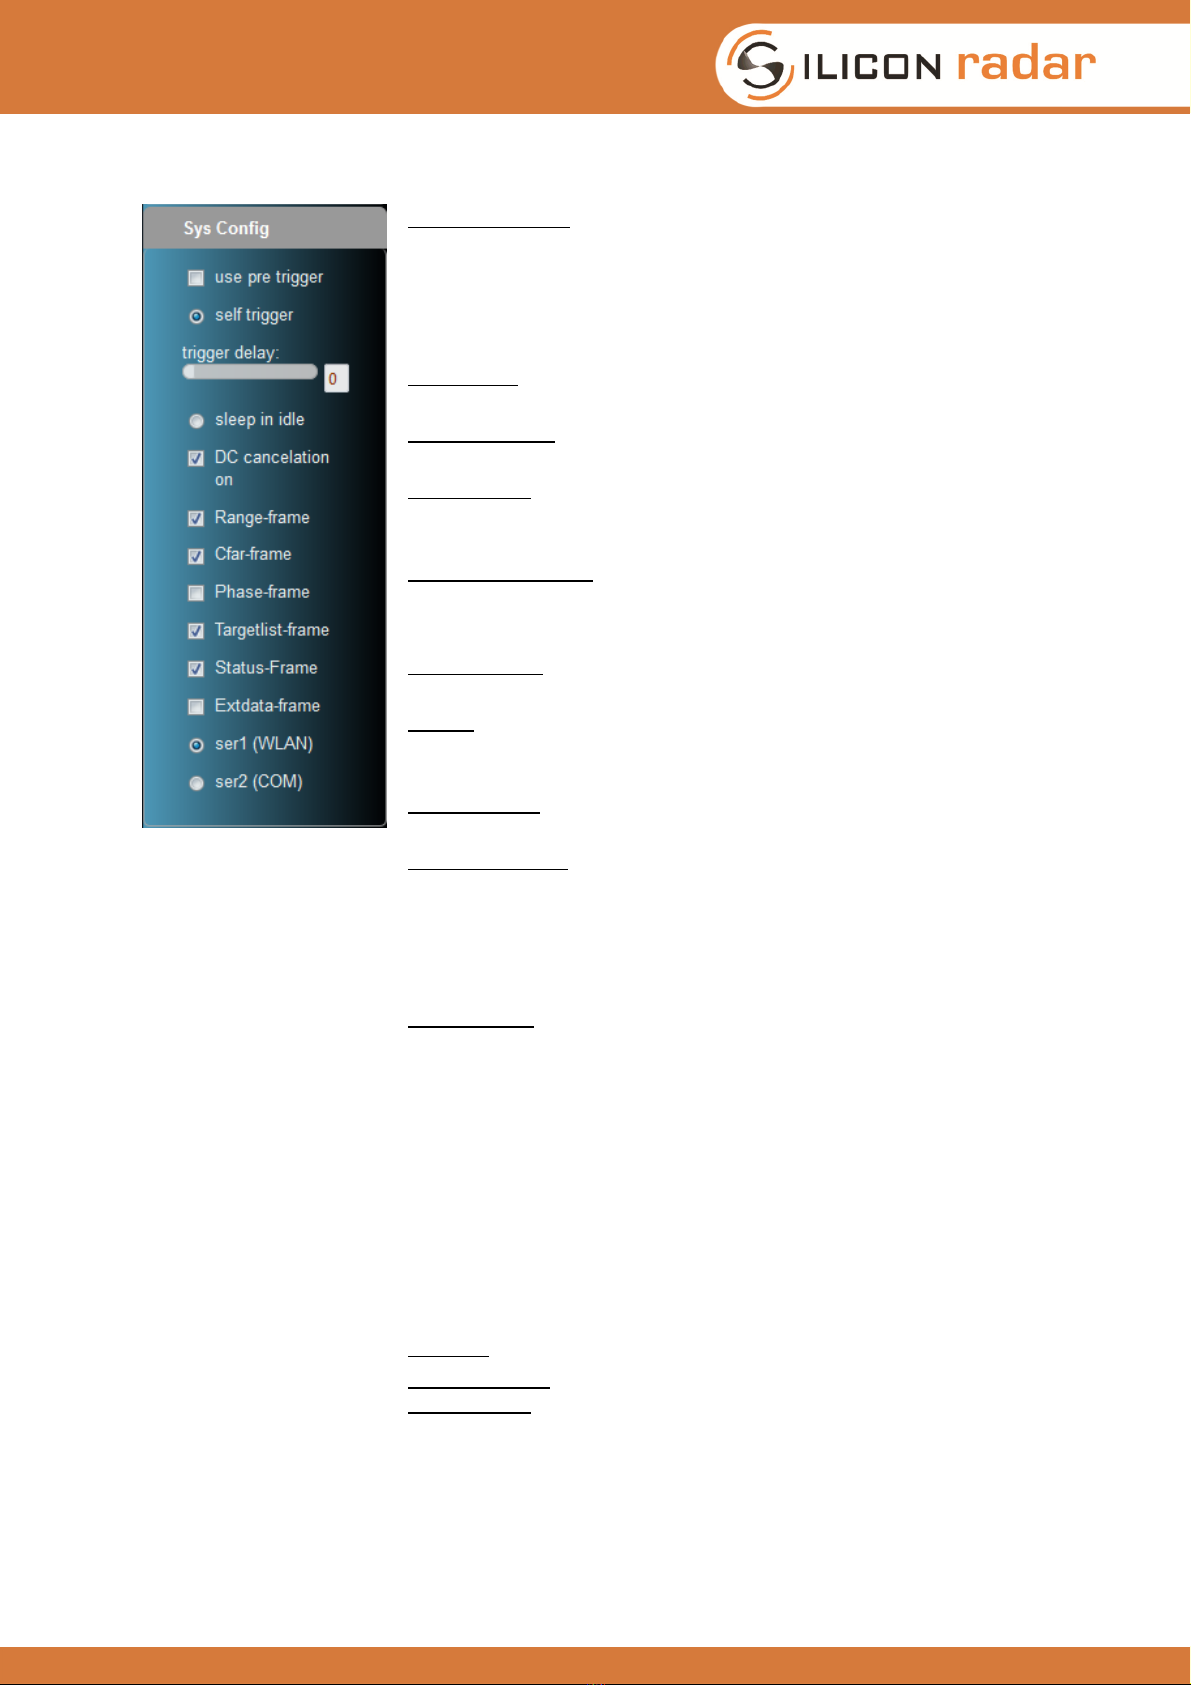
3.2.2 Sys Config:
use pre trigger:
can be used to synchronize measurements
between multiple m
odules. If selected and the module is not in
self trigger mode, the module expects two trigger commands to
execute one measurement. The two triggers have to be sent
with a maximum delay of about 40ms or the second trigger is
ignored.
self trigger: the modu
le is set in continuous measurement mode,
triggering itself repeatedly.
Trigger delay
: changes the delay time between two
measurements when in self trigger mode.
Sleep in idle
: if the self trigger is off, and sleep mode is on, the
module enters low power
sleep mode after transmission of the
measurement results and is woken up by the next trigger.
DC cancellation on: DC offset compensation of ADC data.
Frames: select what data to transfer
Range-frame:
A Frame containing the range spectrum given in
dB for each range bin (magnitude of the FFT output).
CFAR: Constant false ala
rm rate operator. Adaptive algorithm to
derive detection threshold for targets against noise. This frame
contains the CFAR threshold.
Phase-frame: A frame containing the values of the ph
ase angles
for each range bin (argument of the FFT output).
Targetlist-frame:
contains a list of targets and the following data
for each target: number, distance, magnitude, phase and speed.
Please note that the speed value is not calculated by a target
tr
acking algorithm. It is calculated using the difference in
distance from the last to the current measurement and the time
since the last measurement for each row.
Status frame
: if this bit is selected, a status frame is transmitted
after every measurement
. If this bit is reset, a status frame is
only transmitted after every change of the sensor setup. The
status frame contains following information:
•distance format (currently set to mm)
•maximum range in mm
•measurement accuracy of the current setup
•gain se
tting of the baseband amp for the last
measurement
•update rate of the measurements
•the bandwidth used in the current setup
Extdata: alternative data format (currently not used)
ser1 (WLAN): to be selected in order to work with WLAN
ser2 (COM): to be selected in order to work with the USB-
COM
port
EasyRadar Sensor Evaluation Kit
- 12 -
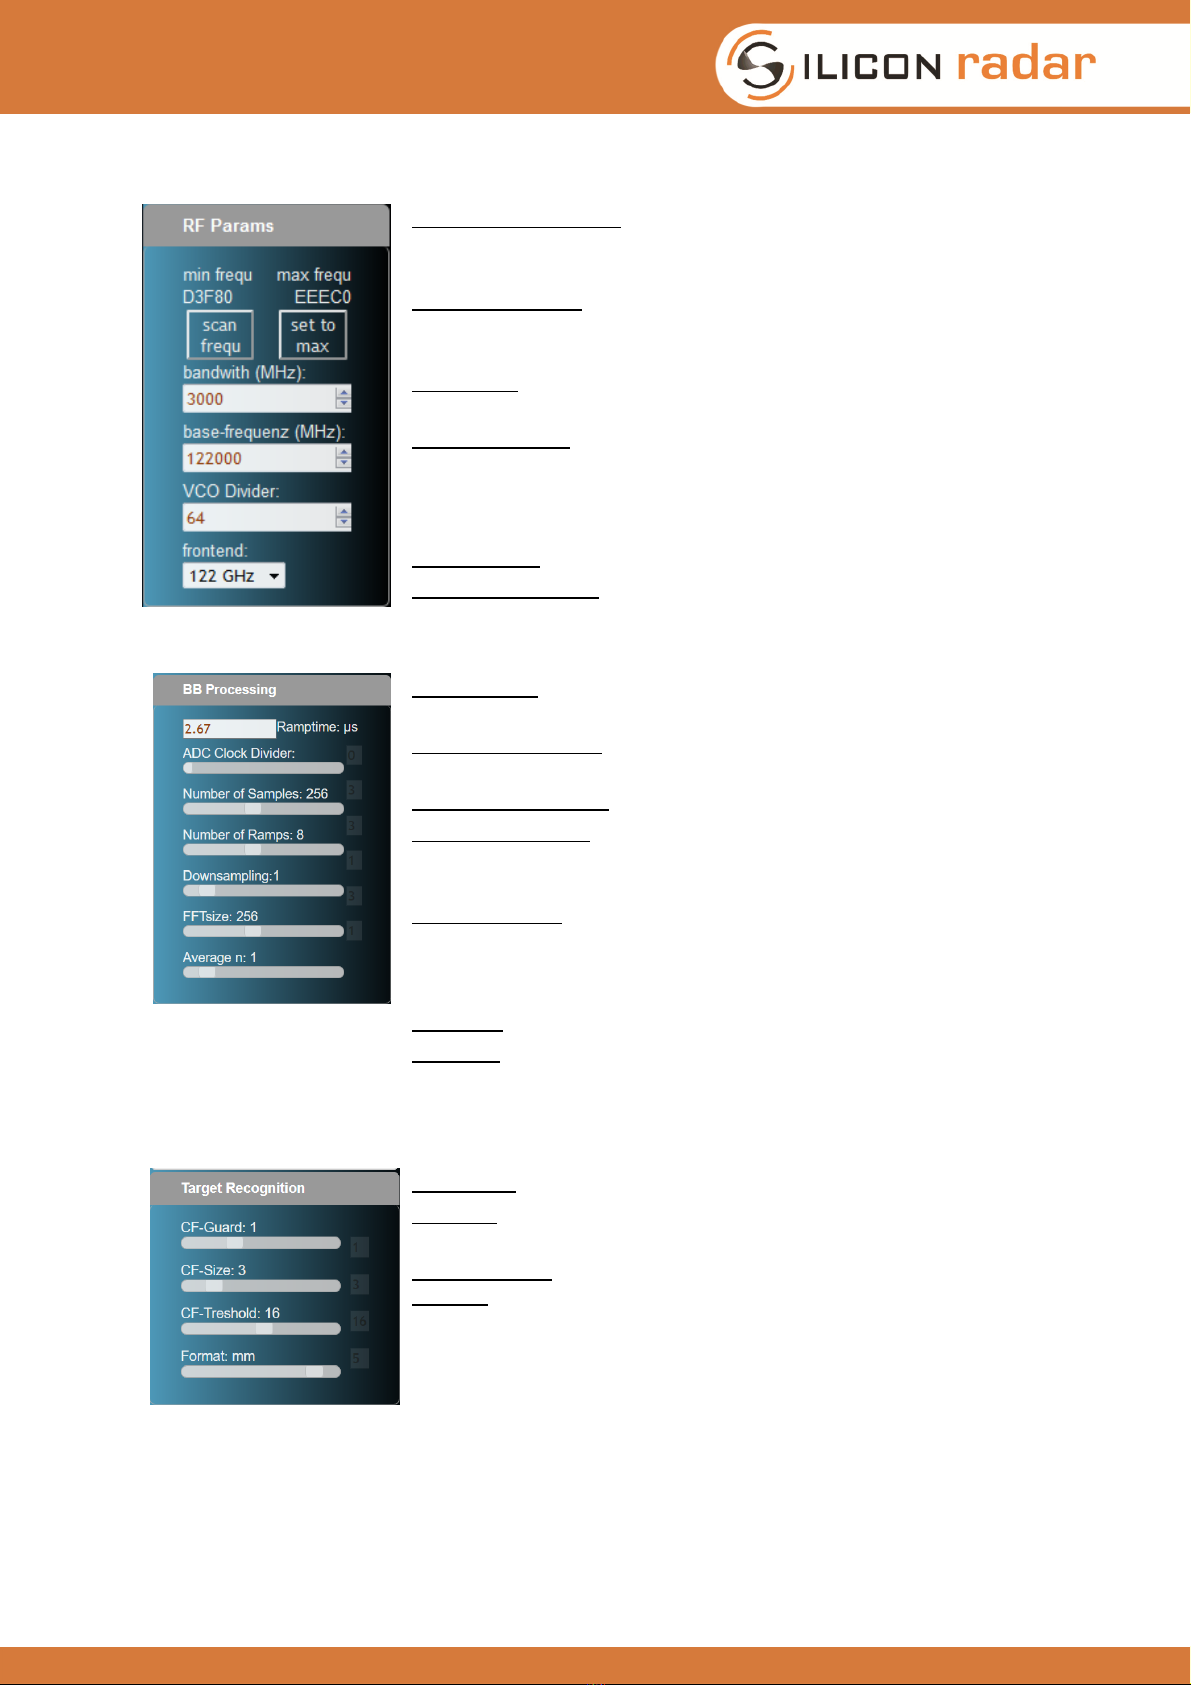
3.2.3 RF params:
Min / Max frequency:
displays the result of the frequency scan.
This scan is performed on every reset and when the scan
frequency command is sent.
Scan / Set Max: performs a frequency scan for the ins
talled
frontend to read the maximum achievable bandwidth. Sets the
ramp bandwidth to this maximum value.
bandwidth:
bandwidth used for the frequency ramp (usually max
6000 MHz, sensor/board dependent)
base-frequency: start-frequency of the ramp (sensor/boa
rd
dependent)
Important: these 2 values define the voltage ramp applied to the VCO. Care should
be taken not to drive the voltage into saturation on either end. See troubleshooting
section for further information.
VCO Divider: 64, fixed, board dependent
Frontend selection:
use this to load standard values for the used
frontend.
3.2.4 BB processing:
Ramp time:
is reported back by the module. Calculated using
the selected sampling frequency and the number of samples
ADC Clock Divider: sets the sampling frequency
, a higher value
means slower sampling.
Number of samples: samples per ramp
Number of ramps:
number of ramps integrated (to improve S/N)
-
> higher values, slower measurements but better S/N. Too high
values may smear out signal due to phase noise of the system.
Downsampling:
reduce number of samples after sampling. Fill
void with zeroes. "1" means average of 2 values, "2" of 4
values, etc. Higher values improve accuracy but reduce max
range.
FFT size: number of FFT bins
Average: averaging of FFT data. "1" m
eans average of 2 FFTs,
etc.
3.2.5 Target Recognition:
CF-Guard: number of guard cells before and after cell under test
CF-Size: number of FFT bins used on either side of the
guard
cells.
CF-Threshold: detection threshold in dB above
noise floor.
Format: in
which format range data is sent/displayed. Values
are 'bin', 'mm', 'cm':
•bin: the number of the pin which receives the data
•
'mm': the data is displayed in 'mm', meaning the bin
number is converted into 'mm', depending on the
accuracy
•'cm': the data is dis
played in 'cm', meaning the bin
number is converted into 'cm', depending on the
accuracy

EasyRadar Sensor Evaluation Kit
- 13 -
3.2.6 Scene Controls:
rotate scene:
enable to let the camera rotate around the center
of the drawing area
LineCount:
change to see more or less datasets going to the
background in 3D -View
X-axis Divider: change to divide the x-axis in more or less parts
3.2.7 Camera Controls:
Here you can see and change camera position and -rotation relative to the specified axis. In
general, the camera can be changed using the mouse within the scene area. Left-click-drag pans
the camera position. Right-click-drag changes the camera angle. Middle-click-drag or moving the
mouse wheel changes the zoom setting (z-coordinate) of the camera.
Reset view: resets camera rotation and position
CamPosX: camera position on the X-axis, move, left(-) or right(+)
CamPosY: camera position on the Y-axis, move up(+) or down(-)
CamPosZ: camera position on the Z-axis, move to the front(-
) or
back(+)
CamRotX: camera rotation on the X-axis, rotate up(+) or down(-)
,
relative to the X-axis
CamRotY: camera rotation on the Y-
axis, rotate to the left(+) or
right(-), relative to the Y-axis
3.3 Main Menu:
Here you can select how the data should be displayed. You have three main options:
FFT View
Phase Diagram
Spectrogram
3.3.1 FFT View
2D-Chart:
•the x-axis shows the range
•the y-axis shows the magnitude in
dB at this range

EasyRadar Sensor Evaluation Kit
- 14 -
3D- Chart:
in 3D-view you can see the history of data,
with the z-axis being the time line, so older
values move to the back (higher z-values).
X and Y like in 2D mode.
Phasemarkers:
as an extra option you can select to display
phase markers on each recognized target.
These markers show the phase angle of the
detected target. The phase angle is very
sensitive to slight changes of the target
distance within one range bin. It can be used
to display relative motion in the µm range.
3.4 Status field and Target list:
Statusfield:
distance in: [mm,cm, bin]
the format which the sensor
specifies in the statusframe.
accuracy: the width of one range bin of the sen
sor. It is
calculated using the following formula:
update rate: calculated from the TSLM-
value („Time since
last measurement“) which the sensor sends in milliseconds in
the statusframe
gain: gain setting of the baseband amplifier in dB
bandwidth: the chirp bandwith
Target list:
The target list is ordered by distance. With every new
measurement having the CFAR operator enabled, the target
EasyRadar Sensor Evaluation Kit
- 15 -
list is updated. Everytime the range bin crosses the CFAR
threshold from below, the local maximum is searc
hed and a
target is generated. If two target peaks cross the CFAR
threshold from below before the range bin goes back
underneath the CFAR threshold, then only the first target is
marked.
distance: the distance of the target in the selected format.
dB: magnitude of the target peak
phi: phase
angle of the target, meaning the phase shift
between outgoing wave and incoming wave. If the
target is
moving, this value should change rapidly.
Speed:
Radial velocity of the target [m/s] calculated as a
range difference since the last measurement.
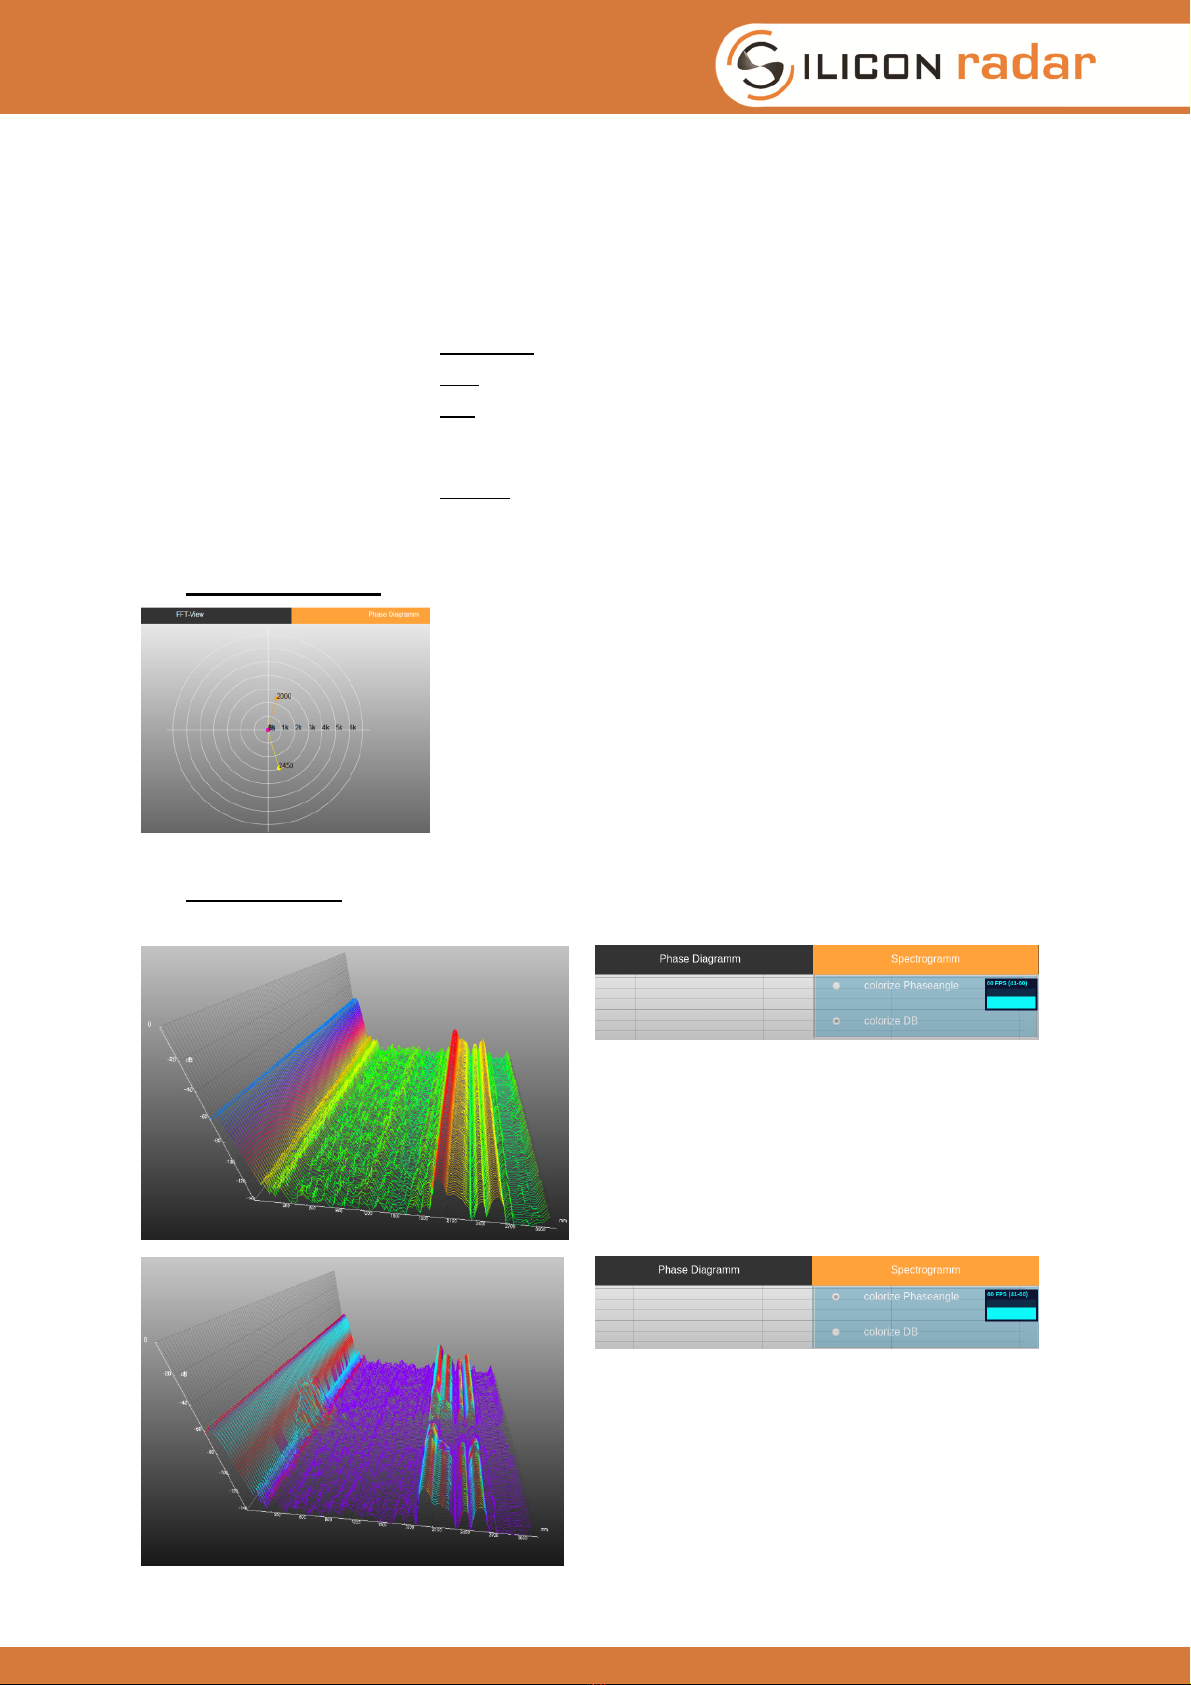
3.5 Phase Diagramm
A widget to emphasize the display of phase angles. Every
target from the target list is displayed here on a circle with a
radius equal to its distance and an angle determined by its
phase angle.
3.6 Spectrogram:
The spectrogram is another time- dependent display of range data.
When yo
u select „colorize dB“ in the
Dropdown-menu, the signal magnitude
is
colorized
When you
select „colorize phaseangle“ in the
Dropdown-
menu, the phaseangles are
colorized
if the magnitude is larger than
-120 dB.
EasyRadar Sensor Evaluation Kit
- 16 -
4 Understanding the display
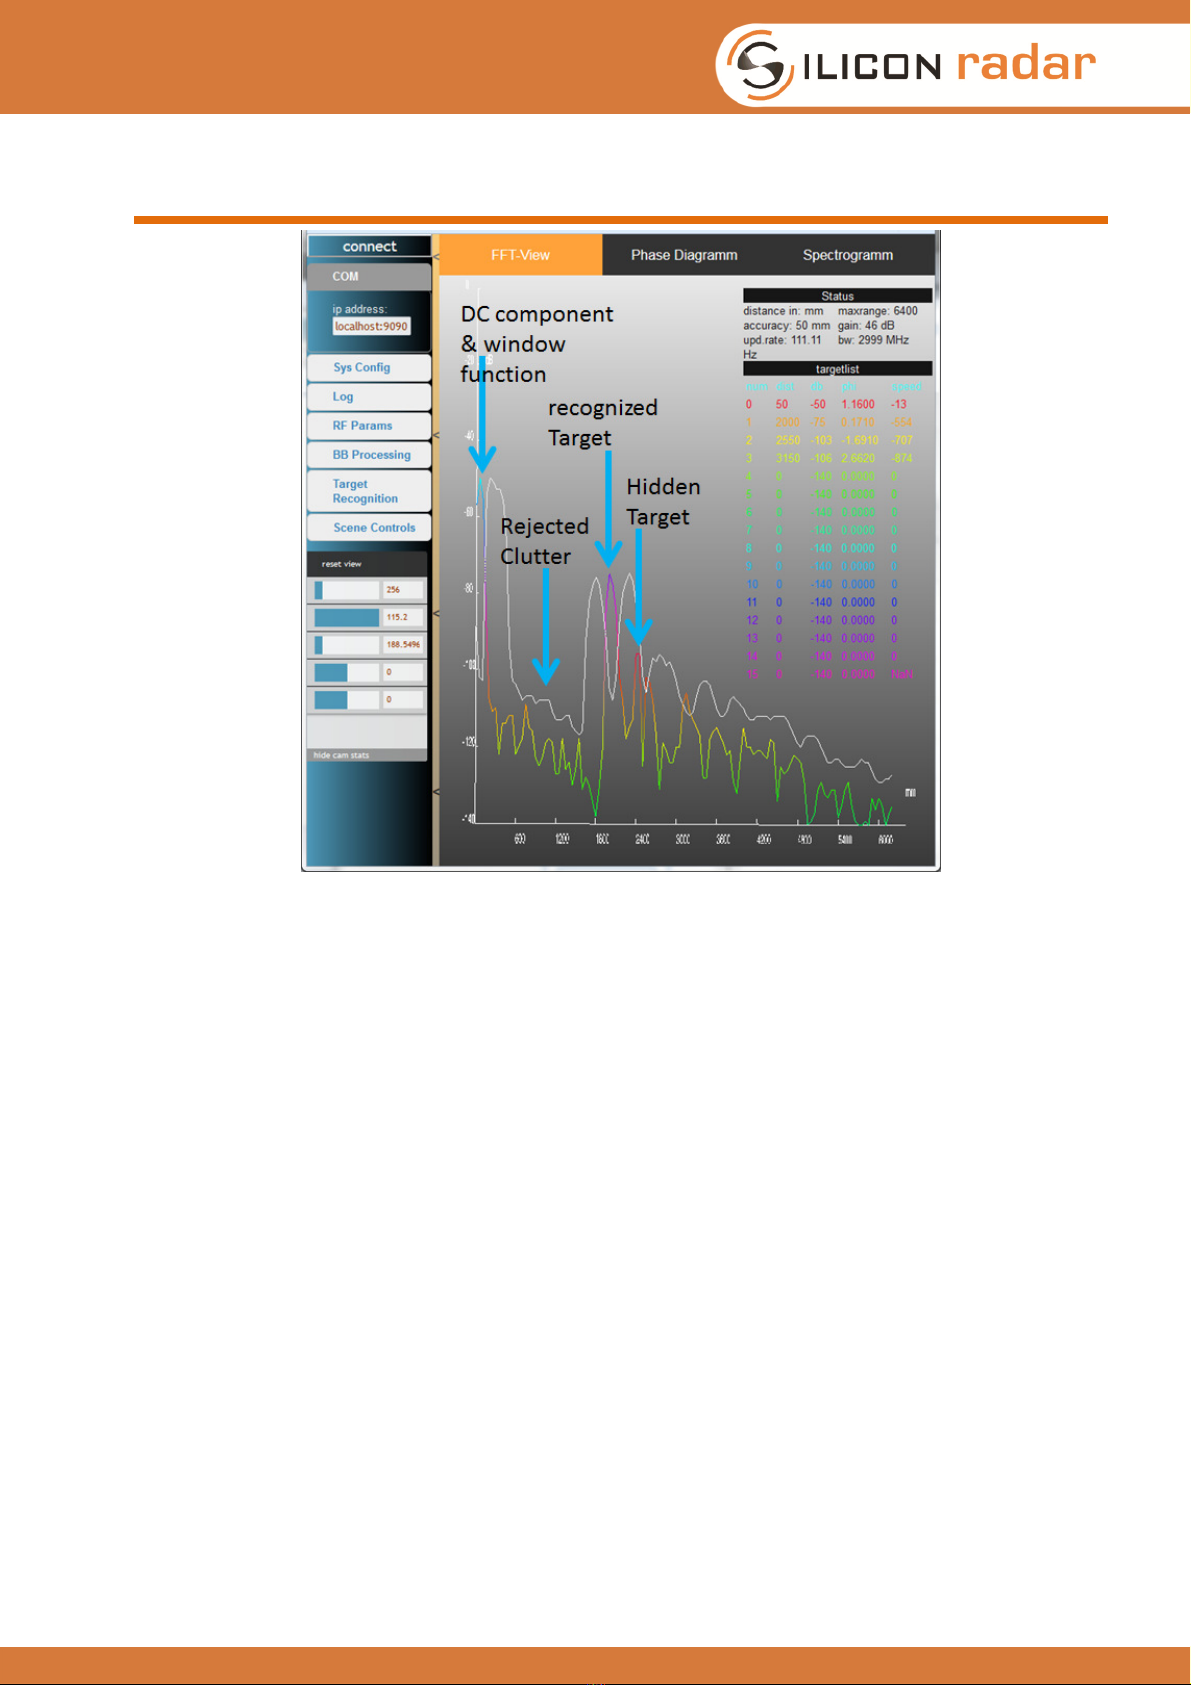
Figure 4 Screenshot of the main GUI window and elements in the display scene.
Viewing a radar target spectrum for the first time might be confusing for the beginner. However,
with some practice, it is easy to find targets and understand why some things work while others
might not.
The above picture shows a typical spectrum output of the sensor when placed on a tabletop and
looking to the ceiling.
There is some DC component on the left side. If this DC offset is high, it might trigger a false target
detection of the CFAR operator.
Around 60 cm to 180 cm there might be some clutter which is rejected by the CFAR operator.
Around 200cm there is the first ceiling echo, which should be quite high versus the neighboring
noise floor. Using a lens will make this target peak thinner and higher and more easily detectable
by the CFAR operator.
Due to the adaptive nature of the CFAR operator it might happen that if two targets are too near to
each other or are very different in magnitude, one of them is rejected by the CFAR operator.
Playing around with the target recognition settings might help in this situation.
For the interested reader we will dig a little deeper into the signal processing flow of the sensor.
EasyRadar Sensor Evaluation Kit
- 17 -
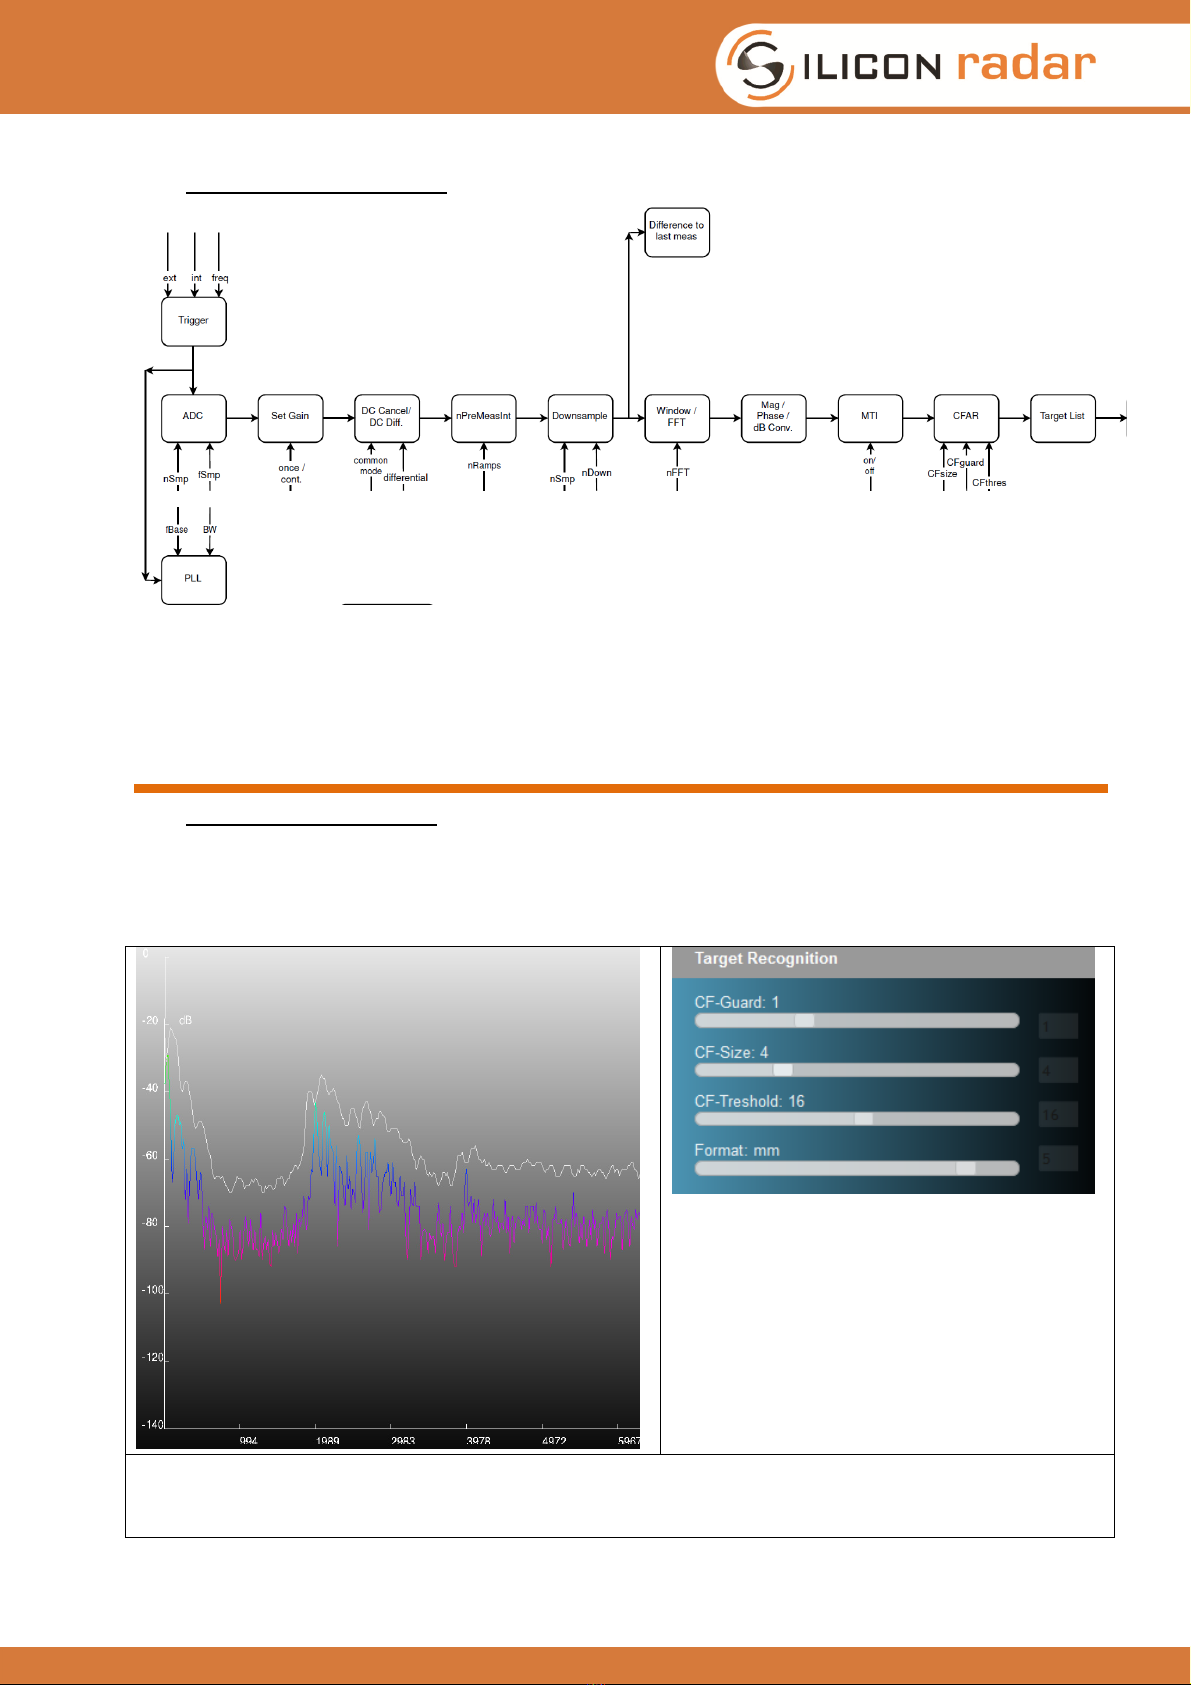
4.1 Signal processing flow
Figure 5 Signal flow of the firmware. Data can be extracted at various intermediate stages.
t.b.d.
5 Troubleshooting
5.1 Target not recognized
A common trouble with Radar sensors is the misalignment of the sensor parameters to the
application. There are too many different parameters which can be optimized, to give a one-fits-all
setting from the beginning.
5.1.1 Too many targets -> CFAR doesn’t work
No targets detected although there are
plenty of targets around 2m.
If there are too many targets adjacent to each other in the field of view, the CFAR operator may
treat those targets like noise floor and calculates an envelope around those targets. Increasing the
number of guard cells may help in such a scenario.
EasyRadar Sensor Evaluation Kit
- 18 -
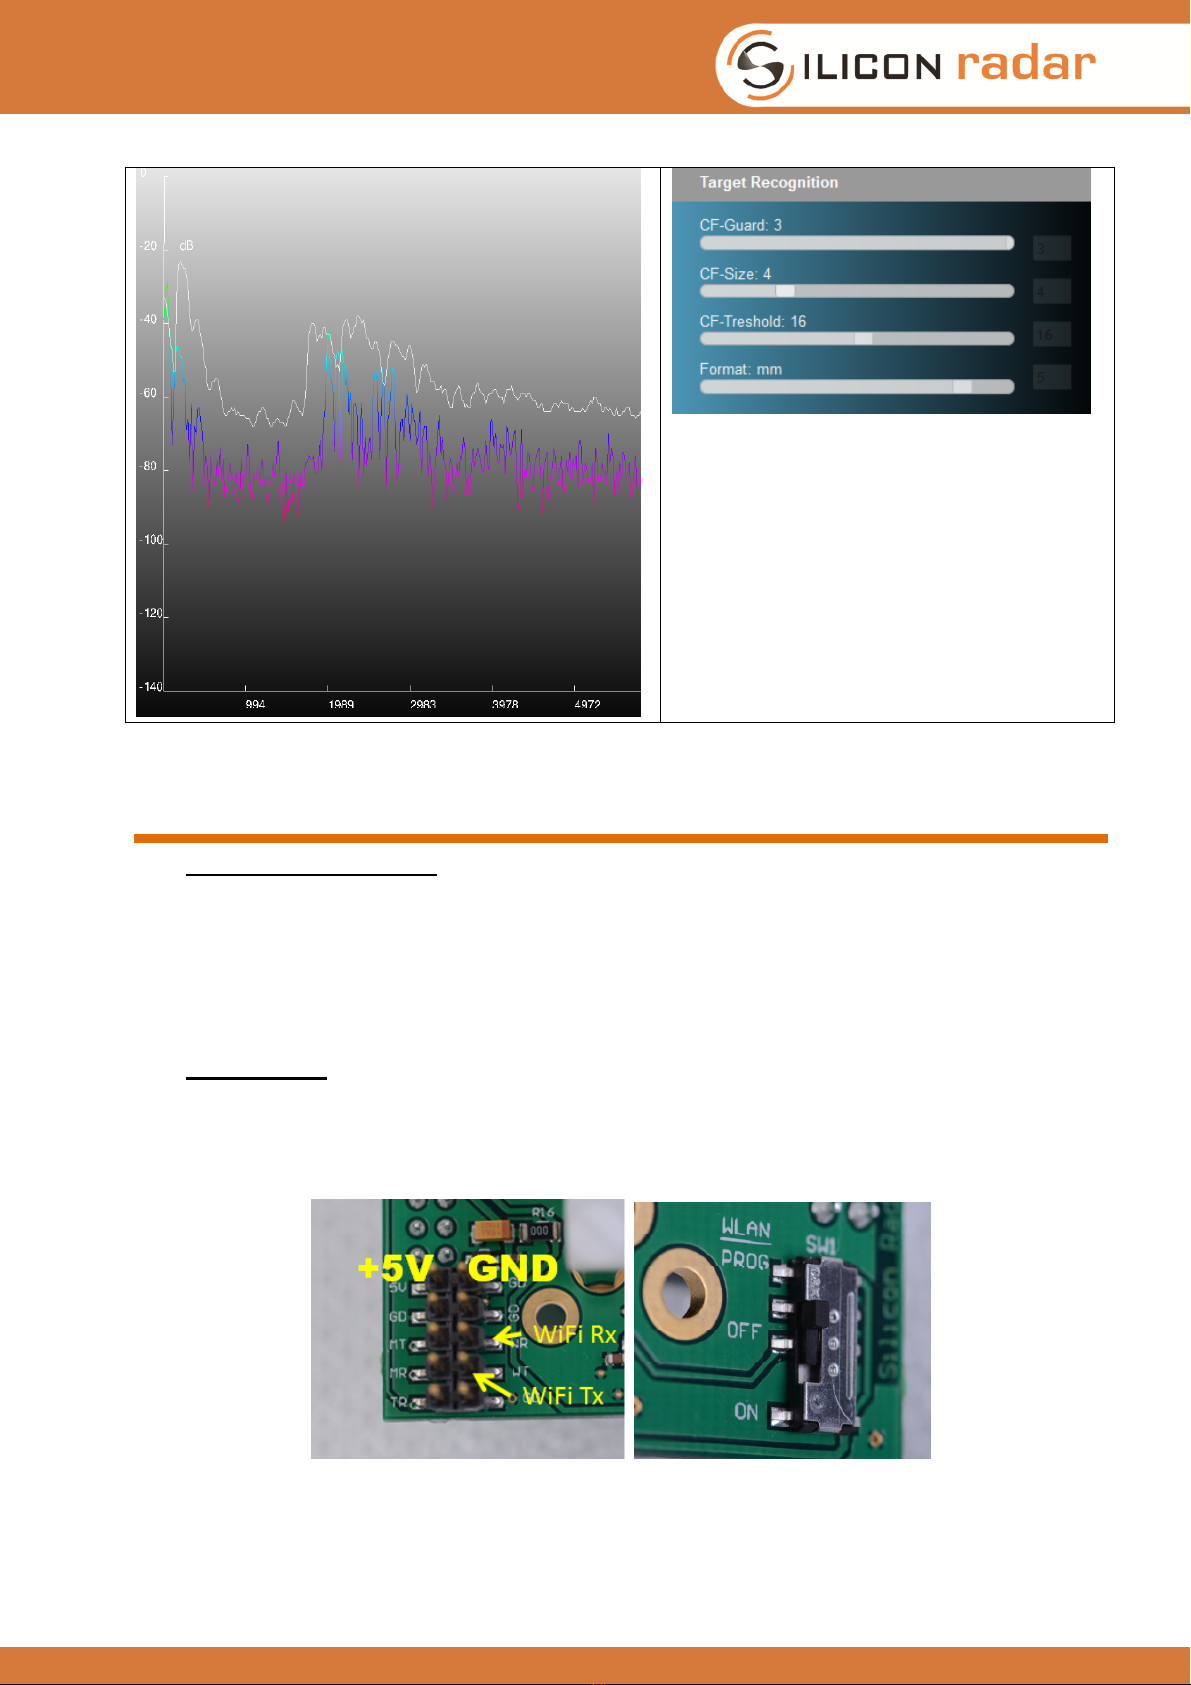
Increasing the guard size may help in such
a situation.
6 Firmware Update
6.1 Microcontroller Board
To update or change the microcontroller firmware, the board has to be connected to the PC via the
USB port. It opens a new mass storage device called NODE_F303RE.
Just drag and drop the .bin file on that device. LD1 on the board starts flashing red and green. As
soon as the flashing stops, the board is programmed and after a reset the new firmware should be
running.
6.2 WiFi Module
Connect the sensor using a 3.3V USB to UART cable like shown in the below figure. Make sure
cable TX is connected to WR (wireless RX) and cable RX is connected to WT (wireless TX). Switch
SW1 to the PROG position.
Figure 6 Jumper settings and program select switch for the WiFi module.
Edit the batch file run_esptool.bat under Install_Package\WiFi Module\websocket_mini and replace
COM7 with your com port setting for the USB to UART cable.

EasyRadar Sensor Evaluation Kit
- 19 -
Run the batch file and the WiFi module gets programmed, indicated by a flashing blue LED. After
about 40 seconds programming is finished. Switch SW1 back to the ON position and connect a
jumper between MT and WR and MR and WT.
7 Hardware
7.1 Schematics
The schematics of the board are provided separately under a non-disclosure agreement.
7.2 Board Layout
[assy drawings]
Figure 7 Assembly drawings of the module PCBs.
7.3 Changing Hardware Parameters
Depending on the type of application it may be necessary to change the filter characteristics and
gain settings of the baseband amplifier.
The standard configuration of the baseband circuitry can be seen in Figure 8.
Figure 8 Signal chain in the Baseband amplifier.
7.3.1 DC- Coupling or change high pass filter response
Change input Caps and second filter to zero ohm. [fotos]
7.3.2 Change low pass filter response
Change feedback caps [fotos]
7.3.3 Change Gain
Change feedback resistors [fotos]

EasyRadar Sensor Evaluation Kit
- 20 -
8 Communication Protocol
The serial communication protocol is divided in two classes: compressed data format (default) and
extended data format (can be activated). A detailed description of the communication protocol is
provided in the Install_Package folder.
8.1 Compressed Data Format
The compressed format is based on readable ASCII characters (valid values range from 0x20 to
0xFF). A single packet starts with a start marker (‘!’), followed by a single character packet
indicator. It is delimited by CRLF characters (0x13 0x10). See Figure 14 for details.
8.2 Extended data format
The extended format is used to transmit large number formats. It is based on hexadecimal
presentation in ASCII format (characters 0..9 and A..F). This format is available for raw data output.
See [] for details.
8.3 Register Description
Figure 9 Register definition of the sensor module
The sensor accepts commands and setup data as input. The registers are 32 bit wide and
configured as shown in []. The register definition is as follows:
•SYS_Config:
oPre-Trigger bit: 0= single trigger mode; 1= use pre trigger, wait for se ond trigger edge
oSelf-Trigger bit: 0= external trigger; 1 = measure ontinuously
oSleep Mode bit: 0= stay in run mode while in idle state; 1= go to sleep during idle state
oDC-Can ellation: 0=off; 1= perform digital DC an ellation after sampling
oRange/CFAR/Phase: 0=off; 1= output Range/CFAR/Phase information frames after
pro essing
oTarget List: 0=off; 1= output Target List frame after pro essing
oStatus Frame: 0=output status frame after every hange of onfiguration; 1= output status
frame after ea h measurement
oExtended Data format: 0: output data in ompressed format, not available for format[0,1,2];
1= output data in extended data format
Table of contents
Other Silicon Radar Motherboard manuals


