Anfatec USB LOCKIN 250 User manual

USB LOCKIN 250
LOCKIN AMPLIFIER AMPLIFIER 10 mHz to 250 kHz
Anfatec Instruments AG
Melanchthonstr. 28
08606 Oelsnitz /V.
Germany
Tel.: 49 (0) 37421 24212
Tel.: 49 (0) 37421 24221
http://www.anfatec.de
email: mailbox@anfatec.de
Manual USB Lockin 250 – Rev. 1.03 dated 07/11/13 Page 1 (37)

•Table o Contents
•General Information ...............................................................................................................4
•Specification of the USBLockIn250 ......................................................................................4
•General Parameters ....................................................................................................................4
•Signal Input ...............................................................................................................................4
•Reference Output .......................................................................................................................5
•External Triggering by PLL .........................................................................................................5
•Analogue Outputs .......................................................................................................................5
•General ......................................................................................................................................5
•Standard Part List .......................................................................................................................5
•Licence for the software .....................................................................................................5
•Installation ............................................................................................................................6
•System requirements .........................................................................................................6
•Software Installation ..........................................................................................................6
•Driver Installation ..............................................................................................................6
•Get Started .......................................................................................................................7
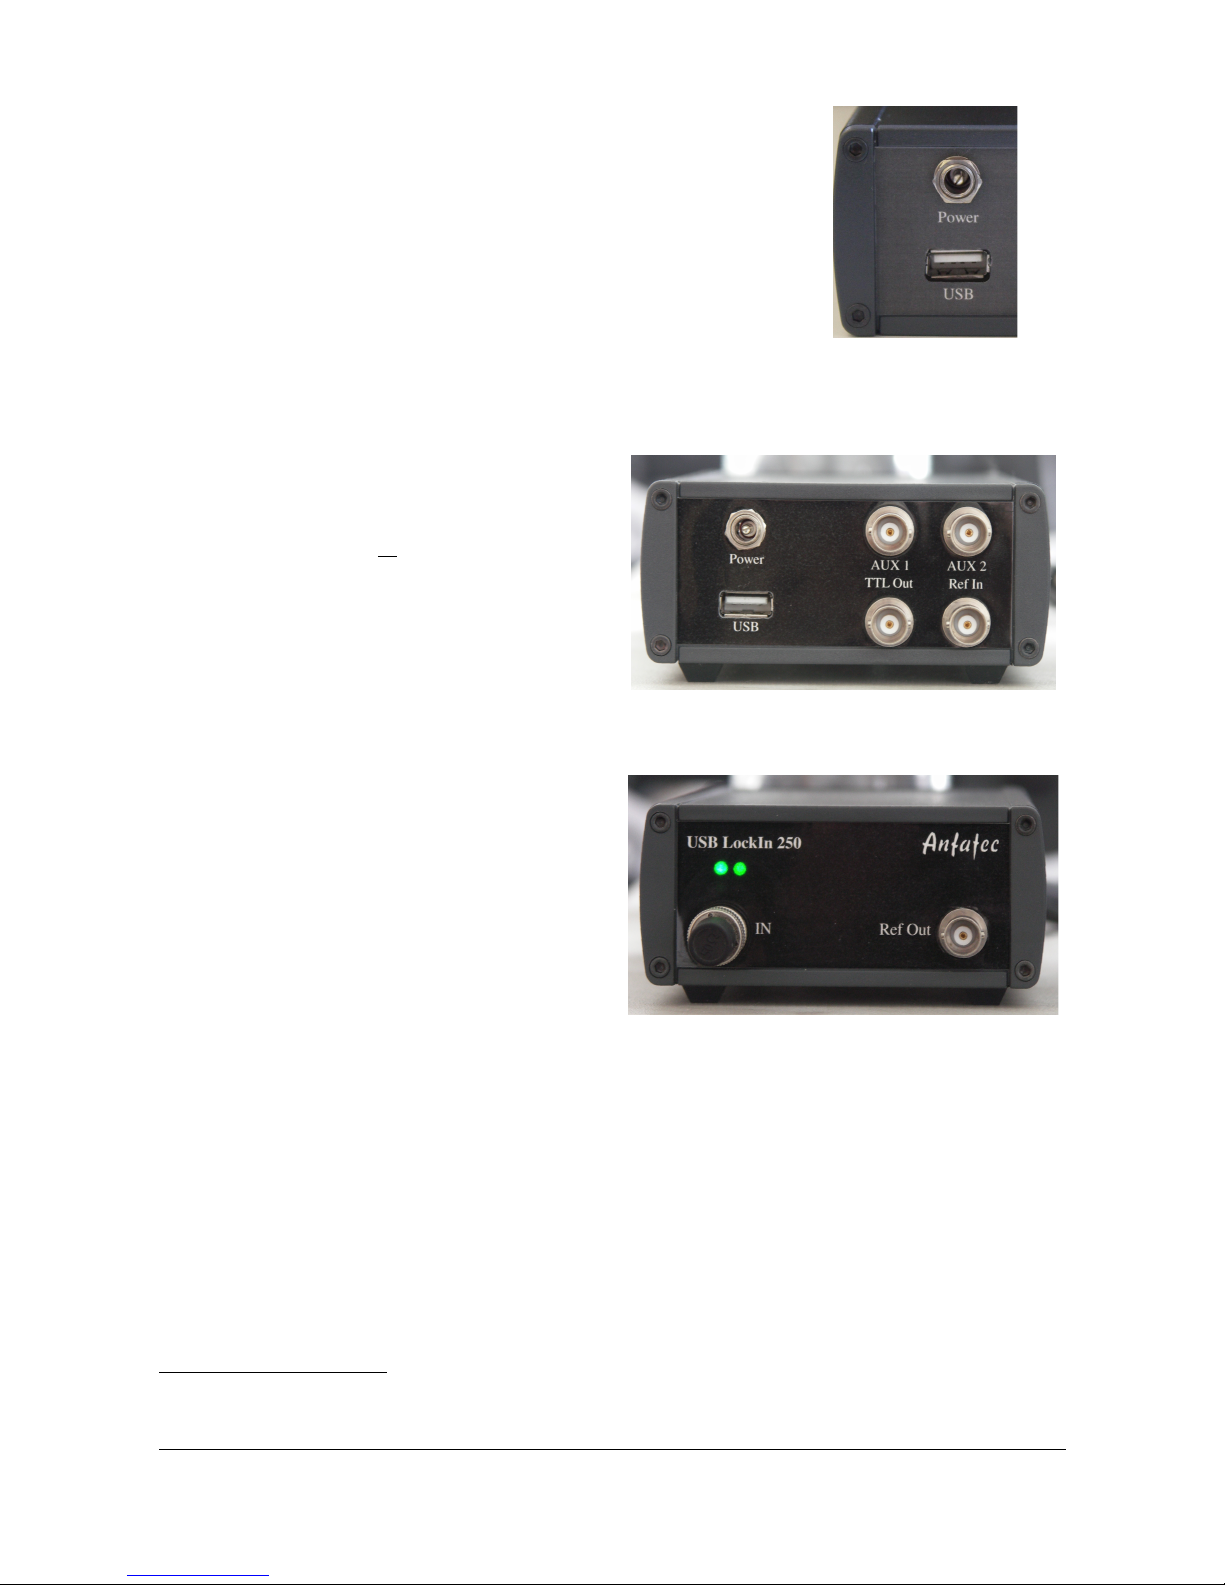
•Connections to the USBLockIn250 ......................................................................................7
•Driver Update ....................................................................................................................8
•LockIn Amplification Basics .....................................................................................................9
•The general idea of Lockin Amplification -> LockIn ..............................................................9
•Mathematical description ..................................................................................................10
•Noise Measurements ........................................................................................................11
•Example: Electrical Force Microscope ................................................................................12
•Hardware Description ...........................................................................................................14
•Auxiliary Outputs .............................................................................................................14
•Software Description ............................................................................................................15
•Overview .........................................................................................................................15
•Functions in the Menu Line ...............................................................................................15
•File ..........................................................................................................................................15
•Option ......................................................................................................................................15
•View ........................................................................................................................................16
•Help .........................................................................................................................................16
•Functions in the Function Line ..........................................................................................16
•Frequency Sweep .....................................................................................................................16
•Oscilloscope .............................................................................................................................16
•Parameter settings ...........................................................................................................17
•Time constant ...........................................................................................................................17
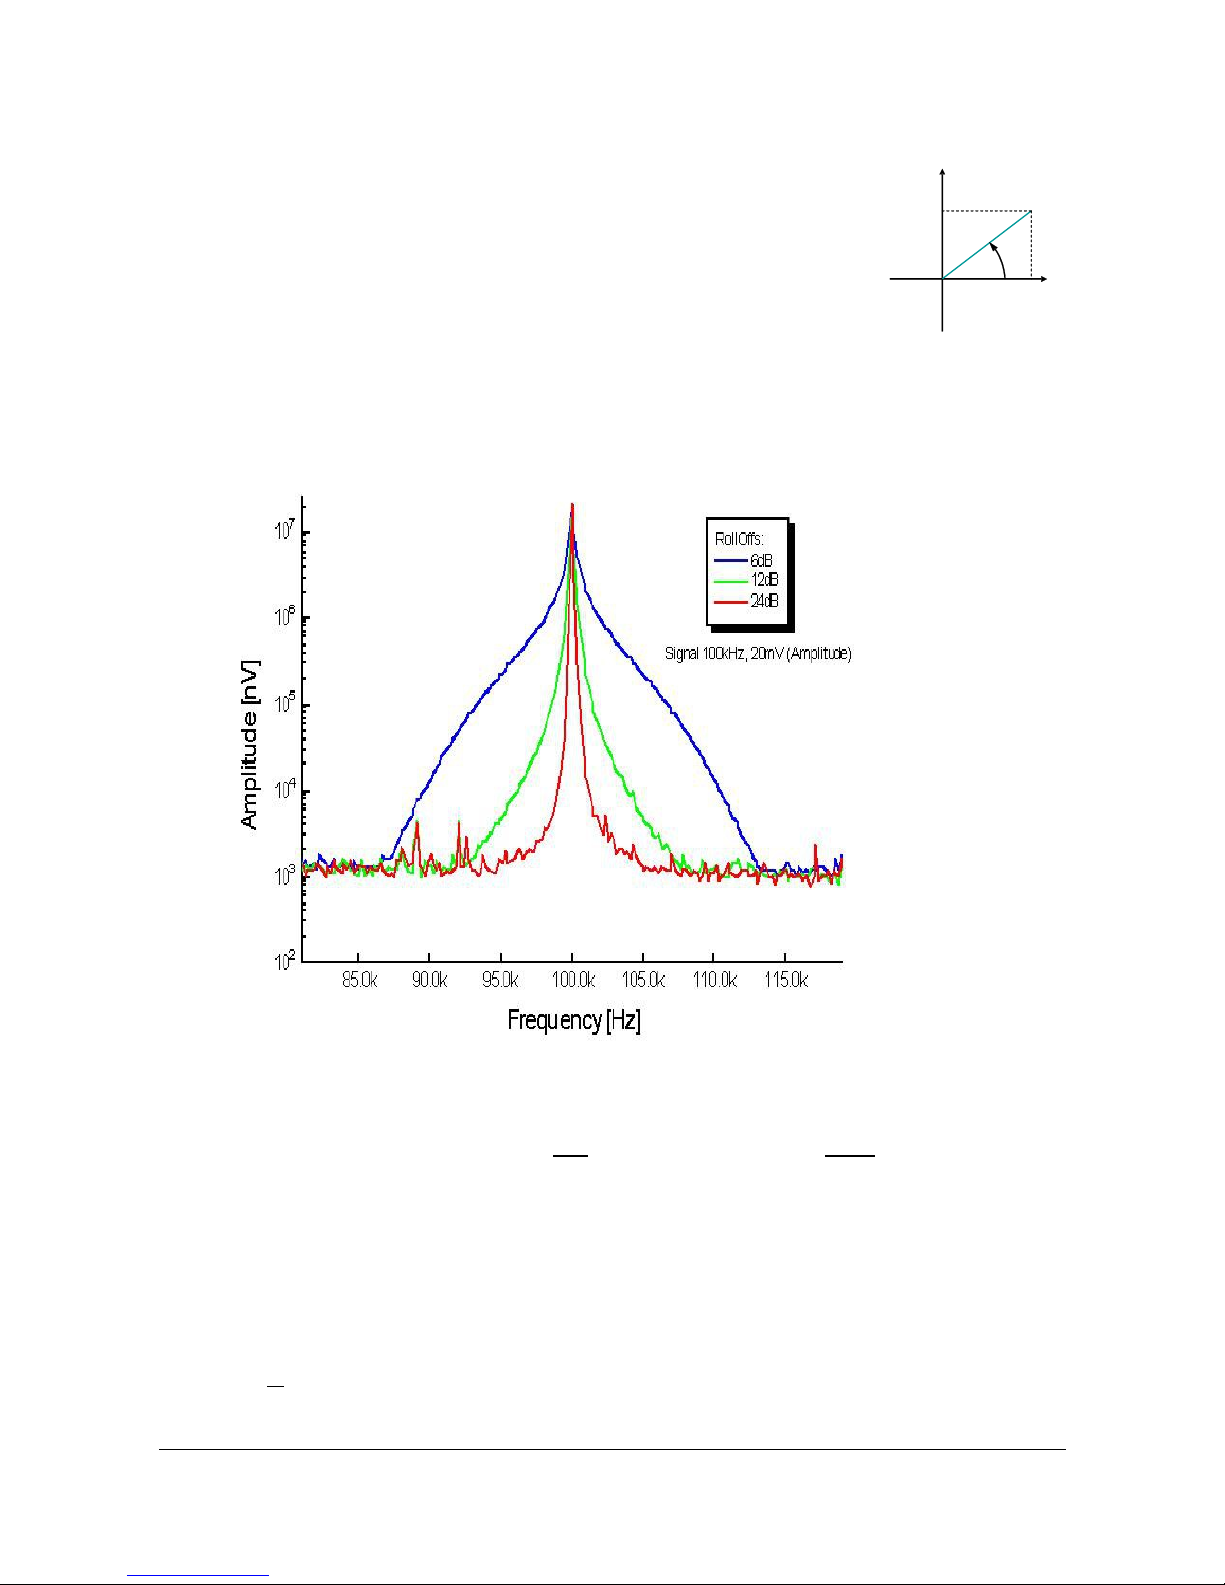
•RollOff .....................................................................................................................................18
•Dynamic ...................................................................................................................................18
•Coupling ...................................................................................................................................18
•The Meters ...............................................................................................................................18
•Frequency ................................................................................................................................19
•Amplitude .................................................................................................................................19
Manual USB Lockin 250 – Rev. 1.03 dated 07/11/13 Page 2 (37)

•Phase .......................................................................................................................................19
•Harmonic .................................................................................................................................19
•Sweep Frequency ............................................................................................................19
•Window Description ..................................................................................................................19
•Options for the frequency sweep ...............................................................................................20
•DLL Description ...................................................................................................................23
•Working with the DLL in C projects ..............................................................................23
•DLL-Functions .................................................................................................................24
•Example programs ...........................................................................................................27
•Remote Control with LabView ...............................................................................................28
•Files and Locations ..........................................................................................................28
•General Programming Directions in LabView ......................................................................28
•Description of Example VI Files .......................................................................................30
•Multiple LockIn Amplifiers in LabView ...............................................................................35
•Revision History ...................................................................................................................35
Copyright 2002-2013 Anfatec Instruments AG. All rights reserved. Anfatec, and AMU are
trademarks of Anfatec. Other product and brand names may be trademarks or registered
trademarks of their respective owners.
Anfatec Instruments AG assumes no responsibility for any damage or loss resulting from use of
this manual.
Anfatec Instruments AG assumes no responsibility for any damage or loss resulting from use of
the software. Anfatec Instruments AG assumes no responsibility for any damage or loss by
deletion of data as a result of malfunction, dead battery, or repairs. Be sure to make backup
copies of all important data on other media to protect against data loss.
Important: Please read Anfatec Licence Agreement contained in this handbook before using the
accompanying software programs. Using any part of the software indicates that you accept the
terms of Anfatec Software Licence Agreement.
Manual USB Lockin 250 – Rev. 1.03 dated 07/11/13 Page 3 (37)

GENERAL INFORMATION
GENERAL INFORMATION
SPECIFICATION OF THE USBLOCKIN250
GENERAL PARAMETERS
Digital Dual-Phase Lock-In Amplifier
Dynamic Reserve > 135 dB (1)
Input Noise (low noise mode) < 4 nVrms/Hz0.5 @ 100 kHz
Remote Control USB 2.0
Time Constants 10 µs ... 5 s / 1 µs in sync mode
Sensitivity 10 nV ... 10 V
Phase Resolution 0.0001°
Amplitude Deviation (0..250 kHz) < 1 %
Phase Deviation (0..250 kHz) < 0.5 °
Maximum Frequency 2 MHz
SIGNAL INPUT
Voltage Input BNC
Input coupling: dc or ac (f-3dB = 2 Hz)
Input Impedance 1 MΩ || 20 pF
Damage Threshold /- 12 V
Input sampling rate 20 MHz
Bandwidth dc to 250 kHz (f-3dB > 250 kHz)
Input Ranges ± 3.5 Vrms, ± 350 mVrms, ± 35 mVrms
Input Sensitivity 10 nV to 10 V
Typical Input Noise: Uac = 0 V, 50 Ω @ input see table→
RollOff 6 dB/oct, 12 dB/oct, 24 dB/oct
Time Constants 10 µs ... 5 s
Amplitude Accuracy (dc to 250 kHz) < 1 %
Gain deviations between dynamic ranges: < 1 %
Phase shift accuracy (dc to 250 kHz) < 0.5°
Input Noise measured with Uac = 0 V and 50 Ω @ input
Frequency Filter \ Range High dynamic reserve Normal Low Nosie
250 kHz 10 ms < 60 nVrms/Hz0.5 < 7 nVrms/Hz0.5 < 5 nVrms/Hz0.5
100 kHz 10 ms < 60 nVrms/Hz0.5 < 7 nVrms/Hz0.5 < 5 nVrms/Hz0.5
10 kHz 10 ms < 60 nVrms/Hz0.5 < 8 nVrms/Hz0.5 < 6 nVrms/Hz0.5
1 kHz 1 s < 1 µVrms/Hz0.5 < 160 nVrms/Hz0.5 < 15 nVrms/Hz0.5
Manual USB Lockin 250 – Rev. 1.03 dated 07/11/13 Page 4 (37)

REFERENCE OUTPUT
Internal Oscillator 10 mHz .. 250 kHz (1 MHz)
Frequency Resolution < 10 mHz
Frequency Accuracy /- 50 ppm from 0 °C to 70 °C
Amplitude Accuracy (dc to 250 kHz) < 0.5 %
Reference Output Voltage < 1 mVpp ... 15 Vpp
Output Noise @ 100 kHz @ Uac = 1 mV, < 200 nVrms/Hz0.5
Output sampling rate 20 MHz
EXTERNAL TRIGGERING BY PLL
Frequency range 1 Hz .. 1 MHz
Locking time < (100 ms 10 Cycle)
Phase error < 4 deg @ f < 1 kHz
Input amplitude TTL and Sine Wave (> 50 mVrms)
Phase delay ~ 1 µs
ANALOGUE OUTPUTS
Sampling rate 1 MHz (1 µs group delay)
Output Voltage -10 V … 10 V
Output Noise < 300 nV/sqrt(Hz)
Accuracy < 2 %
GENERAL
Interface Plug & Play USB 2.0 interface
Drivers Windows NT/2000, Windows XP, Win7
32 bit
Power consumption 12 Vdc, 1 A
Warranty 2 years
STANDARD PART LIST
USBLockIn250 1
Power Supply 12 V dc 1
USB cable M-M , 2 m long 1
Manual 1
Software on USB-stick 1
Low-Noise BNC cable 2 m long 1
LICENCE FOR THE SOFTWARE
The Source code for the remote control software and the DLL source code are provided with the
General Public Licence (GPL). All examples for LabView can be freely implemented and changed by
the user.
Manual USB Lockin 250 – Rev. 1.03 dated 07/11/13 Page 5 (37)

INSTALLATION
INSTALLATION
SYSTEM REQUIREMENTS
–compatible PC
–1 MB hard disk space
–Windows NT 4.0 / Windows 2000 or Windows XP (32 bit) / Windows 7 (32 bit)
SOFTWARE INSTALLATION
On the delivered USB Stick, you find
Driver in F:\Driver Use “setup.bat” or “setup7.bat” (Win7)
to install the driver.
Test software in F:\ Start “lockin.exe” to test the device
NOTE: In Windows7, the ini-file “user.ini” might be copied automatically in another directory. If you want to
avoid this, make the directory that contains the ini-file writeable by any user.
Source Code of the lockin.exe in F:\Delphi
LabView examples in F:\LabView the examples base on a DLL
Source code of the DLL in F:\DLL\DLLSource
Examples using the DLL in F:\DLL\Delphi
The easiest way is to copy the whole content into a suitable directory (%YourPath), e.g.
“C:/Users/USBLockin”. If working under Windows 7, one needs to set the user rights as follows:
•right click on the top most folder and select properties
•select the tab “Security”
•select “Users” and click on “Edit”
•allow “Full control” and use “Apply” and “OK” to verify
DRIVER INSTALLATION
Connect the USB lockin first. If the system asks for a driver, select the “USBLockin.sys” in the
directory “C:\Users\USBLockin\Disk”. If the system does not ask automatically, one has two
possibilities:
A) install through device manager
•open the device manager
•select the “Unknown Device” and right click to “Update Driver Software”
•“Browse for driver software on your computer”
•provide the path “%YourPath/Driver/”
•select the driver “USB Lockin”
•Say OK when Windows recommends not to install from an unknown driver vendor
B) install with setup program in “C:\Users\USBLockin\Driver”
In Windows XP and Windows 2000 start “setup.bat”.
In Windows 7 start “setup7.bat”.
Allow the setup.bat program to do changes on your PC. During installation, a command window is
opened and closed when finished. For the 1st installation, this procedure might take about 20
seconds.
Manual USB Lockin 250 – Rev. 1.03 dated 07/11/13 Page 6 (37)

GET STARTED
☑Connect the power supply to “Power”
☑Connect the USB interface to your PC
☑When the PC asks for a driver, install the driver provided on
the USB-Stick under “Driver” with “setup.bat” (Windows XP) or
“setup7.bat” (Windows 7)
☑One needs to start the test software “lockin.exe” once as
Administrator1
CONNECTIONS TO THE USBLOCKIN250
Power – requires 12 V dc, 1 A. Innerpin is
positive.
USB – interface for remote control via USB2.0
Re -In ... is the TTL or sine wave input that
allows to trigger the USBLockIn250 from any
external source. In order to use it, one has to
set the PLL ON with the software.
TTL-Out ... is a TTL type (rectangular 5 V
wave) trigger output for other devices. Use
Ref-Out, when a sine wave is required.
R/X ... is the analogue output No 1. It
displays the Panel meter 1 or the Auxiliary
Output 0, if these outputs are used as
customer specific outputs. It provides an
analogue signal of the software-selected
channel with the software-selected scaling.
Phi/Y ... is the analogue output connected to
Panel meter 2 or the Auxiliary Output 1, if
these outputs are used as customer specific
outputs. It provides an analogue signal of the
software-selected channel with the software-
selected scaling.
LEDs … the left LED (central above the IN connector) indicates that the power supply is
connected. The right LED (less intense) indicates that the USB interface is connected.
IN ... is the analogue input of the lockin in which the signal to be detected is plugged in.
Re Out ... is a sine wave output whose amplitude is set by software and whose frequency equals
the currently selected centre frequency of the lockin amplifier.
1 This copies the scaling data for the lockin amplifier into the registry of the PC. Afterwards, all other
applications and all users can use these registry entries.
Manual USB Lockin 250 – Rev. 1.03 dated 07/11/13 Page 7 (37)
Figure 3: Front side of the USBLockIn250. The left LED is
the power LED. Right LED indicates that the USB
connection is ON.
Figure 2: Backside of the USBLockIn250
Figure 1: Power Supply for 12 V dc.
USB-Connector.
PhaseX
Δφ

DRIVER UPDATE
One has two possibilities:
A) install through device manager
☑open the device manager
☑select the “Unknown Device” and right click to “Update Driver Software”
☑“Browse for driver software on your computer”
☑provide the path “%YourPath/Driver/”
☑select the driver “USB Lockin”
☑Say OK when Windows recommends not to install from an unknown driver vendor
B) install with setup program in “C:\Users\USBLockin\Disk”
☑In Windows XP and Windows 2000, start “setup.bat” in the path of the new driver
☑In Windows 7, start “setup7.bat” in the path of the new driver
Manual USB Lockin 250 – Rev. 1.03 dated 07/11/13 Page 8 (37)

LOCKIN AMPLIFICATION BASICS
THE GENERAL IDEA OF LOCKIN AMPLIFICATION -> LOCKIN
A lockin amplifier is a phase sensitive bandpass filter with a centre frequency f and a bandwidth t.
It has two output signals in parallel: either the amplitude R and the phase j, or the real part X and
the imaginary part Y.
•The centre frequency is the frequency at which the LockIn is searching for its signal.
•The bandwidth gives the frequency range around this centre frequency, from which the output
signal is derived.
•The output signal R is the measured amplitude of the analysed signal at the centre frequency f.
•The phase j is the relative phase shift between the analysed signal and an internal reference
signal with the same frequency.
For analysing the input signal, the LockIn needs an internal frequency reference with a
certain amplitude and phase. (see Fig. 10).
The bandwidth of a LockIn can be visualised by a simple setup. A generator gives a constant
frequency fin signal to the input and sweeping the centre frequency f around the input frequency
fin. Figure 11 shows that the amplitude at the input frequency is always measured with the same
value. For other frequencies, the measured amplitude is dependent on the distance between the
actual centre frequency and the input signal frequency.
A schematic diagram with the basic components of the lock-in amplifier is shown in Figure 3 on
page 7. First of all the received signal is amplified and digitized. Divided into two separate
channels, the signal is multiplied by the mentioned reference signal (with frequency ω
ref
) and the
90° phase-shifted reference signal respectively. The reference signal is generated with the lock-in's
digital oscillator. An additional implemented phase displacement Ψ enables to compensate phase
differences caused by the measuring equipment. After multiplication, the resulting signals are low-
pass filtered and provide now information about the real part
X
and the imaginary part
Y
of the
analysed signal relating to the phase position of the reference signal. Out of them the amplitude
R
as well as the relative phase shift φ are calculated.
Manual USB Lockin 250 – Rev. 1.03 dated 07/11/13 Page 9 (37)
Figure 4: Schematic diagram with the basic components of the lock-in amplifier.

MATHEMATICAL DESCRIPTION
A digital LockIn realises its filtering by certain mathematical procedures.
Think, Y(t), the signal to be analysed, is dependent on a value X(t). For
instance: we measure a photo voltage U(t) which depends on the light
intensity given by an LED I(t). If the background light intensity is much too
high to detect small intensity changes of the LED light, one can modulate
the light intensity I(t) at a certain frequency ωref and detect with a narrow
band filter at this frequency.
Thus, X(t) is modulated as X(t) = X0X1 cos(wref t). Then, Y(X(t) can be developed into a Taylor-
Series:
Equ.(1)
For the value of Y at the time t, all measurement values Y(t) detected in the period
are used.
This period t should be a whole-numbered multiple of 2pwref. Due to the modulation of X(t) at
wref, modulations of Y(t) at the frequencies m wref with m = 1,2,... are expected. These
modulations equal the Fourier components Y(m wref) with m = 1,2,... of the input signal Y(t),
which are given as
Ym=1
∫
−/2
/2
YXte−i mtdt
Manual USB Lockin 250 – Rev. 1.03 dated 07/11/13 Page 10 (37)
YX0X1cosref t=∑
k=0
∞
YkX0⋅X1
k
k !⋅coskref t⋅YkX= dkY
dX k∣X0k∈N
X
YR
φ
Figure 5: Output signal of a LockIn amplifier for a single frequency input signal of 100 kHz
and 20 mVrms amplitude at the input. The time constants have been kept constant.

and together with Equ. 1
Ymref =∑
k=0
∞
YkX0X1
k
k! Km
k
with
Km
k=1
∫
−/2
/2
cosk ref te−i m ref tdt
.
The factors Kmk get zero for k to infinity. For small k, the Kmk remain too big to be neglected. In
order to neglect n-th order parts, the n-th derivative of Y(t) to X(t) has to be negligible.
The first 10 (k = 1 ... 10) coefficients Kmk for the first 4 harmonics m = 1 ... 4 are given in the
following table:
k =
m12345678910
1
1
2
3
8
5
16
35
128
63
256
2
1
4
1
4
15
64
7
32
105
512
3
1
8
5
32
21
128
21
128
4
1
16
3
32
7
64
15
128
NOISE MEASUREMENTS
Lock-in amplifiers are capable to measure noise. They detect a signal at a certain centre frequency
ωref with an equivalent noise bandwidth. For Gaussian noise, the equivalent noise bandwidth of a
real low pass filter is the bandwidth which passes the same amount of noise as a perfect
rectangular filter with the equivalent noise band width.
The equivalent noise bandwidth of the lockin amplifier is determined by the time constant and the
slope of the used Butterworth filters. It is calculated by
Bn=∫0
∞1
12n d
. (4)
The normalized Butterworth filter noise bandwidths are:
Filter order Bandwidth / τ
1 1.570796
2 1.110721
Manual USB Lockin 250 – Rev. 1.03 dated 07/11/13 Page 11 (37)

Filter order Bandwidth / τ
4 1.026172
In order to measure noise spectra, the resulting data should be divided by the square-root of the
used bandwidth.
The integrated spectrum is taken with a time constant of 10 ms and a
slope of 24 dB (4th order) – bandwidth factor ~ 1 03. The related
bandwidth is then 1/10 ms = 100 Hz. In order to interpret the result as
noise in units of V/Hz0.5 the spectrum should be divided by 10 Hz0.5(=
sqrt(100 Hz)).
EXAMPLE: ELECTRICAL FORCE MICROSCOPE
In this chapter electrical force microscopy (EFM) is briefly presented as an example for the
application of lock-in amplifiers.
EFM is a related technique to the well-established atomic force microscopy (AFM). Its special aim
is to detect electrical forces to learn something about the electrical properties of a surface, for
example about the local distribution of surface potentials on electronic devices or different dopant
concentrations in semiconducting materials.
The fundamental experimental setup shown in Figure 6 is based on a conventional atomic force
microscope: In the non-destructive dynamic non-contact mode, an oscillating metallic tip fixed to a
cantilever is scanning over the surface by means of a piezo scanning device. The distance between
tip and sample can be controlled by monitoring the oscillation amplitude of the cantilever, because
Manual USB Lockin 250 – Rev. 1.03 dated 07/11/13 Page 12 (37)
Figure 6: Schematic diagram of the EFM experimental setup.
Lock-In 1 Feedback
Laser
2
nd
harmonic
1
st
harmonic
Lock-In 2
2ω
ref
ω
ref
U
bias
~
U
ac
cos(ω
ref
t)
+
z
x
ω
r
ω
ref
Sample
Photo-
detector
Tip
Lock-In 3

its value is influenced by short-range van der Waals forces. Therefore a reflected laser beam and a
position-sensitive photo-detector are used. A lock-in amplifier analyses the detector signal at the
cantilever resonance frequency ωr and passes the determined amplitude value to a feedback
control system that re-adjusts the tip-sample distance. The required displacement of the z-piezo
can be recorded as topography signal.
In addition to the topography, EFM detects electrical forces, too. These forces are proportional to
the derivative of the capacitance
C
of the tip-sample arrangement with respect to the tip-sample
distance
z
and proportional to the potential difference
U
squared:
Fel = −1
2
dC
dzU2
. (5)
A possible voltage dependency of
C
is neglected in this consideration.
The voltage
U
contains a direct voltage part
UDC
and an alternating voltage part
UAC
:
U=UDC UAC⋅cosref t
. (6)
UDC
consists of an additional applied bias voltage and, what is especially interesting from the
physical point of view, potential differences caused by different electronic work functions and
charges. For separating the impact of these electrical forces from other forces (e.g. van der Waals
forces),
U
has to be modulated at the frequency ωref. As a result of this, the measurable photo-
detector signal is modulated, too.
Inserting equation (6) in (5) and using power-reduction formulae of trigonometric functions one
can expect a force between tip and sample at the frequency ωref as well as at 2·ωref. Figure 7
confirms this prediction: It shows the frequency spectrum of the cantilever oscillation with clear
signals at the mechanical excitation frequency ωr and at the frequencies of the first and second
harmonic of the electrical excitation.
Now two additional lock-in amplifiers (see Figure 6) can be used to
analyse the photo-detector signal at the frequency ωref and 2·ωref
simultaneously. The measured amplitudes of the signals are proportional
to the strength of the electrical forces.
Manual USB Lockin 250 – Rev. 1.03 dated 07/11/13 Page 13 (37)
Figure 7: Frequency spectrum of the oscillating cantilever
10 20 30 40 50
1E-5
1E-4
1E-3
0.01
Amplitude [V]
Fre uency [kHz]
ω
r
ω
ref
2·ω
ref

HARDWARE DESCRIPTION
The main connection to the hardware already are
described in chapter “Installation”. Here, some special
features of the hardware are explained.
AUXILIARY OUTPUTS
The backside of the USBLockIn250 supports two
analogue outputs named “Aux1” and “Aux2”. They can
be used as scaled outputs or as auxiliary outputs.
The selection is done by a channel
number with the DLL command
“SetLockInAux”. When the channel
is set to 1, the output operates like
an auxiliary output. The channels
numbers 10, 11, 12 and 13 equal
the values of X, Y, R and Phi,
respectively.
A) Scaled outputs of the lockin amplification results X, Y, R or Phi.
For Phi, the output scaling automatically is set to -180° -10 V and 180 10 V.↔ ↔
For X, Y, and R, one can set a range between 10 nV (1E-8) and 10 V. The lockin amplifier scales
the data to -10 V... 10 V, so that “range” equals 10 V.
Example:
Assume the lockin amplifier measures 10 mV amplitude signal (on R).
When the output scaling is set to a value below 10 mV (1E-8 … 10 mV)
Aux1 will show +10 V which equals an overload.
When the output scaling is set 20 mV for example then these 20 mV equal
10 V maximum range and 10 mV equal 5 V output in relation to the 20 mV
range.
When the (maximum) range is 200 mV then 200 mV signal would be shown as
10 V; and 10 mV are scaled to 500 mV only.
B) Auxiliary Outputs defined by the user to control external experiments.
Manual USB Lockin 250 – Rev. 1.03 dated 07/11/13 Page 14 (37)
Figure 8: Analogue outputs with variable use.
Figure 9: Principle of the AUX0 output generation

SOFTWARE DESCRIPTION
OVERVIEW
Figure 10 shows the main window of the LockIn program, which appears when the program is
opened. For checking the actually detected values, the two meters are used. Basic input
parameters (frequency, amplitude, offset phase and harmonic) can be selected in the right part of
the window. Parameters, which concern the input stage (time constants, RollOff, and input gain)
are chosen in the left part of the window.
The frequency is either the internal frequency (black numbers) or the detected external frequency
from the reference input (grey numbers).
The menu line allows typical Windows functions, while the button in the function line open new
windows with specific functions.
FUNCTIONS IN THE MENU LINE
FILE
Exit
- Exit the program
OPTION
•overload
Overload occurs, when the dc input signal exceeds the full scale sensitivity for the selected range.
This full scale sensitivity is 7 Vrms for high reserve, 700 mVrms for normal reserve and 70 mVrms for
low reserve. With this option can be selected whether a beep and/or a color change is shown in
case of overload.
•ext. re erence
Manual USB Lockin 250 – Rev. 1.03 dated 07/11/13 Page 15 (37)
Figure 10: Main window of the LockIn program with description of the functions.

For LockIn-amplifier versions with PLL (Phase locked loop), the reference frequency can be either
the internal oscillator frequency or an external reference frequency. If the “ext. reference” is
selected, the internal PLL is enabled. The locked frequency is shown in grey in the frequency
window. If there is no input signal connected to the reference input, a default frequency of 2 mHz
is shown, but the LockIn is not working properly.
With disabled PLL, the frequency given in the frequency window is written in black.
VIEW
It can be selected, which of the meters is shown.
•Devices
Select whether the strings for the lockin amplifier(s) should be shown. Useful when using multiple
lockin amplifiers to select which one should be used. Is also used for LabView (see chapter
“Multiple LockIn Amplifiers in LabView“).
HELP
About – shows the current program version and the version of the used hardware driver.
LockIn help – calls the table of contents of the HTML help file supplied with the program
Help as PDF – calls the current manual (Manual.pdf) and opens it in the Microsoft Internet
Explorer.
FUNCTIONS IN THE FUNCTION LINE
FREQUENCY SWEEP
Opens the "frequency sweep" window
OSCILLOSCOPE
The oscilloscope works like a real 3-channel-oscilloscope. Content, scaling type and offset of the
three channels is selectable.
Channel selection: is done from a drop down list, which shows only the available channels.
The two
numbers
above the drop down list for channel selection display the “scaling factor per
vertical division” (= left number, hint: “y-scale in /div”, example: 12.90 nV/div) and the mean
value. Both are calculated from all data acquired from the left oscilloscope edge till the current
oscilloscope time. Therefore, these numbers are subsequently re-calculated.
Manual USB Lockin 250 – Rev. 1.03 dated 07/11/13 Page 16 (37)

Vertical scaling types:
•0..max the scaling is set to maximum value of the channel
•0..fixed the maximum value can be changed by a slider appearing on the right
sight of the scaling type selection
•0..auto the program calculates the the optimum, but takes always “0” as minimum
•auto..auto automatically scaled
Time scaling is done with the edit window (right sight) in seconds.
“Save Pic” saves the oscilloscope screen in a bitmap file.
“Draw mode” selects whether the data are drawn as dots or lines.
PARAMETER SETTINGS
TIME CONSTANT
This option selects the used time constant for the low-pass filter. The internal LockIn functions
give the lower limit of 0.2 ms (5 kHz). The possible time constants range in a logarithmic scale
between 0.2 ms and 1 s.
Manual USB Lockin 250 – Rev. 1.03 dated 07/11/13 Page 17 (37)

The low-pass filter itself is a Butterworth with an effective noise bandwidth of
Bn=∫0
∞1
12n d
.
The normalized Butterworth filter noise bandwidths are:
Filter order Bandwidth
1 1.570796
2 1.110721
4 1.026172
ROLLOFF
The meaning of the "RollOff" is shown in the curves in Figure 5. It equals the degree of the
lowpass filter. One can chose between 6 dB/oct (1st order), 12 dB/oct (2nd order) and 24 dB/oct
(4th order).
DYNAMIC
This switches the input amplification of the LockIn. With "high" dynamic, input amplification is 1.
The maximum signal amplitude is then /-10 V. The "normal" input amplification is 10, which
equals maximum signal amplitudes of /- 1 V. When the low dynamic is chosen, the resolution of
the LockIn is highest, but the signals cannot exceed 100 mV.
COUPLING
If the specification of the instrument allows it, this option switches between DC coupled input and
AC coupled input. Note: The 3dB corner frequency of the input high pass is around 2Hz. Reference
frequencies around 2 Hz and below may cause misleading results.
THE METERS
The meters display the LockIn output channels, which are X and Y as well R and Phi, in physical
units.
Manual USB Lockin 250 – Rev. 1.03 dated 07/11/13 Page 18 (37)
Figure 11: Effect of different time constants.

FREQUENCY
If written in black letters, this is the actual reference frequency which is used at the reference
output and as reference frequency for the signal evaluation of the input. Click with the right
mouse button to switch from external to internal reference. In case of internal reference, the
numbers are written in grey.
AMPLITUDE
This is the amplitude of reference output.
PHASE
Allows to give a phase offset between the reference output and the input. In the schematic in Fig.
4, this phase is equal to the LockIn input parameter “Phase γ”.
HARMONIC
Selects, which harmonic of the reference frequency is evaluated. The possible values range from 1
to 15. When selecting higher harmonics, take care, that, due to lowpass filtering, the maximum
input frequency the LockIn cannot be higher than 2 MHz.
SWEEP FREQUENCY
This window serves the acquisition of frequency dependent spectra of any of the LockIn input
channels. The frequency sweep uses the internal reference. When the PLL is enabled for normal
operation, it will be disabled during frequency sweep.
The number of data points, parameters for the visualisation as well as for the saving and copying
the acquired data can be changed in the option window.
WINDOW DESCRIPTION
“Delay”: is the time delay between each acquired data point. During spectrum acquisition, the
frequency is set to the next value. Then, the system waits “Delay” and takes one single value from
the acquired Channel.
As this delay has to be related to the time constant of the LockIn, the options in the drop down
list for the delay are given in multiples of τ. Thus, independently on the time constant τ given in
the main window, the time constant for the acquisition of the spectrum is always correct.
“ rom” and “to” define the values of the start frequency and the stop frequency. For the
spectrum's acquisition, one chooses the wanted frequency range, and presses the “start-button”.
If the time constant was very high, the spectrum might take a while. In order to stop the
acquisition, the start-button can be pressed a second time.
“Channel” is a drop down list of available data channels (X, Y, R, and Phi).
“Range back” - click with the right mouse button in the data screen, and a pop-up menu with
list of four frequency ranges appears. The upper one is a standard range, which can be changed in
the “Option/acquire” part. The next three are, from the bottom to the top, the last three used
frequency ranges.
Manual USB Lockin 250 – Rev. 1.03 dated 07/11/13 Page 19 (37)

OPTIONS FOR THE FREQUENCY SWEEP
The option window provides three cards: “save” - parameters about the saving and copying
format of data, “acquire” – parameters about the data acquisition, and “view” – parameters
around the screen of showing the data.
Save-Tab:
The saved files and the data copied to the clipboard have an ASCII structure. The data are written
in lines (each frequency value one line) and delimited by the given delimiter (“TAB” in the
example) are saved. The frequency values are only saved, if “Save x-Axis” is checked. All history
data are saved too and also delimited the same character.
Data file example:
1000,00 234,09
1200,00 237,98 ...
Manual USB Lockin 250 – Rev. 1.03 dated 07/11/13 Page 20 (37)
Figure 12: Window for the spectra acquisition.
Table of contents
Other Anfatec Amplifier manuals
Popular Amplifier manuals by other brands

Whelen Engineering Company
Whelen Engineering Company X-ECUTOR 2 installation manual

Infinity
Infinity 1211a Service manual

Bose
Bose B1500 owner's guide

Marantz
Marantz PM6006 Service manual

Hughes & Kettner
Hughes & Kettner GrandMeister 36 Head Service documents

Acoustic Research
Acoustic Research A-06 Service manual