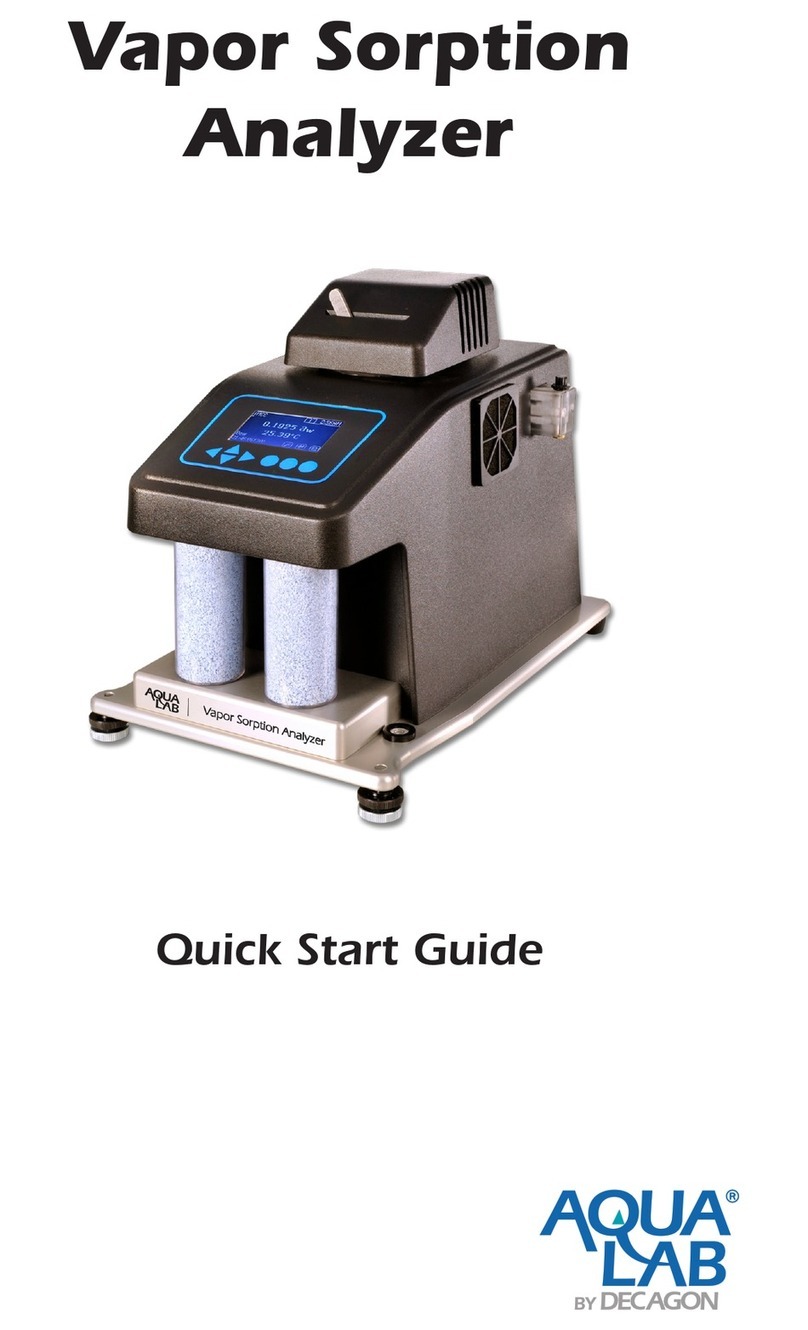
Decagon AquaLab User manual

Vapor Sorption
Analyzer
User‘s Manual
Version 2

Table of Contents
1. Introduction.................................................................... 1
About this Manual ...............................................................1
Warranty.............................................................................1
Customer Support...............................................................2
Seller’s Liability ...................................................................3
2. About the VSA ............................................................... 4
Moisture Sorption Isotherms ...............................................4
Measurement Method.........................................................5
Specifications......................................................................7
3. Theory............................................................................ 8
Moisture Sorption Isotherm Methods...................................9
4. Getting Started............................................................. 22
Instrument Setup...............................................................23
5. User Interface and Menus............................................ 28
Isotherm Tab.....................................................................28
Measurement Tab.............................................................29
Configuration Tab .............................................................29
Data Tab...........................................................................43
6. Cleaning and Maintenance .......................................... 46
Desiccant cartridge desiccant replacement.......................46
Cleaning the Testing Chamber..........................................48

7. Verification of Calibration..............................................54
Water Activity Verification ..................................................54
Verification Standards........................................................55
When to Verify for Linear Offset.........................................56
8. Running a Test .............................................................65
Becoming Familiar with Stages..........................................65
Running a Moisture Sorption Isotherm Test.......................65
For DDI method............................................................................69
For DVS method...........................................................................72
Using DDI to investigate Glass Transition..........................75
Creating a Working Isotherm Using the VSA .....................75
Editing a Running Isotherm Test........................................76
Running a Water Activity Test............................................78
9. VSA Downloader Software ...........................................79
Connect.............................................................................79
Configure and Start a New Test.........................................79
Download and Export ........................................................80
10. Troubleshooting..........................................................81
Diagnostic Screen..............................................................97
Appendix A .....................................................................101
Index...............................................................................102


AquaLab Vapor Sorption Analyzer
1. Introduction
1
1. Introduction
The AquaLab Vapor Sorption Analyzer (VSA) is an automatic
isotherm generator from the world leaders in water activity
measurement. The VSA is the only automatic isotherm generator
that can generate isotherms using both the Dynamic Vapor
Sorption (DVS) method, which generates equilibrium isotherms,
and the Dynamic Dewpoint Isotherm (DDI) method, which
generates dynamic isotherms. By combing both methods in one
instrument, the VSA makes it possible to investigate both
dynamic matrix changes due to water sorption and the kinetics of
those changes. This manual is for VSA operation and to be
informative regarding the capabilities of your VSA.
About this Manual
Included in this manual are instructions for setting up your VSA
which includes setting up an isotherm test, running a test, col-
lecting data, and analyzing data. Please read the manual before
operating the VSA to ensure your instrument performs to its full
potential.
Warranty
The VSA has a one year warranty on parts and labor. Your
warranty is automatically validated upon receipt of the
instrument. Decagon will contact you within the first 90 days of
your purchase to see how the VSA is working for you.

AquaLab Vapor Sorption Analyzer
1. Introduction
2
Customer Support
If you ever need assistance with your VSA, or if you just have
questions or feedback, there are several ways to contact us.
Customer service representatives are available to speak with
you Monday thru Friday, between 7am and 5pm Pacific time.
NOTE: If you purchased your VSA through a distributor, please
contact them for assistance.
E-mail:
Phone:
1-509-332-5601
Fax:
1-509-332-5158
If contacting us by email or fax, please include as part of your
message your instrument‘s serial number, your name, address,
phone, and fax number.
Note to Our VSA Users
This manual is written to aid the end user in understanding the
basic concepts of moisture sorption isotherms, enabling them to
use our instruments with confidence. Every effort has been made
to ensure the content of this manual is correct and scientifically
sound.

AquaLab Vapor Sorption Analyzer
1. Introduction
3
Seller’s Liability
Seller warrants new equipment of its own manufacture against
defective workmanship and materials for a period of one year
from date of receipt of equipment. The results of ordinary wear
and tear, neglect, misuse, accident and excessive deterioration
due to corrosion from any cause are not to be considered a
defect. The seller‘s liability for defective parts shall in no event
exceed the furnishing of replacement parts F.O.B. from the
factory where originally manufactured. Material and equipment
covered hereby which is not manufactured by Seller shall be
covered only by the warranty of its manufacturer. Seller shall not
be liable to Buyer for loss, damage or injuries to persons
(including death), or to property or things of whatsoever kind
(including, but not without limitation, loss of anticipated profits),
occasioned by or arising out of the installation, operation, use,
misuse, nonuse, repair, or replacement of said material and
equipment, or out of the use of any method or process for which
the same may be employed. The use of this equipment
constitutes Buyer‘s acceptance of the terms set forth in this
warranty. There are no understandings, representations, or
warranties of any kind, express, implied, statutory or otherwise
(including, but without limitation, the implied warranties of mer-
chantability and fitness for a particular purpose), not expressly
set forth herein.

AquaLab Vapor Sorption Analyzer
2. About the VSA
4
2. About the VSA
The VSA Isotherm Generator is an automatic moisture sorption
isotherm generator that can generate both dynamic and
equilibrium moisture sorption isotherms.
Moisture Sorption Isotherms
The relationship between water activity (aw) and moisture
content at a given temperature is called the moisture sorption
isotherm. This relationship is complex and unique for each
product due to different interactions (colligative, capillary, and
surface effects) between the water and the solid components at
different moisture contents. An increase in awis almost always
accompanied by an increase in water content, but in a non-linear
fashion. Moisture sorption isotherms are sigmoidal in shape for
most foods, although foods that contain large amounts of sugar
or small soluble molecules have a J-type isotherm curve shape.
Isotherms provide information about product quality and safety.
A few uses for isotherms include:
1. Monolayer moisture content determination.
2. Determine critical water activity or moisture content.
3. Limits for crispness, hardness, and flow properties.
4. Optimize moisture contents at a safe water activity that
maximizes moisture and avoids over drying.
5. Determine shelf-life and storage stability of a product.
6. Predict packaging requirements based on sorption
properties of a product.
7. Determine kinetics of sorption and water vapor diffusion
coefficients

AquaLab Vapor Sorption Analyzer
2. About the VSA
5
8. Determine the equilibrium water activity of a mixture of dry
ingredients.
9. Determine the degree of crystallinity of powders.
10. Determine the level of amorphous material in a product.
11. Determine critical water activities for phase transitions.
12. Determine the relationship between water activity and glass
transition temperature.
13. Determine the relationship between water activity and
crystallization.
14. Determine hysteresis levels for a product.
15. Determine the moisture sensitivity of a product.
16. Determine the equilibrium moisture content at a given water
activity.
17. Allow rapid moisture content determination from water
activity analysis through an isotherm curve.
Measurement Method
The VSA is the only automatic isotherm generator that can
create isotherms using both dynamic and static methods. To
produce dynamic isotherms, the VSA uses the Dynamic
Dewpoint Isotherm (DDI) method. To produce static or
equilibrium isotherms, the VSA uses a controlled humidity and
balance system commonly referred to as Dynamic Vapor
Sorption (DVS).
The DDI method for dynamic isotherms is a water activity and
gravimetric analysis method that controls neither water content
nor water activity, but dries or wets the sample and measures
water activity and water content during the wetting or drying
process. Water content is determined by weighing the sample
using a high precision magnetic force balance. Water activity is

AquaLab Vapor Sorption Analyzer
2. About the VSA
6
determined using Decagon‘s patented chilled-mirror dewpoint
sensor. Drying of the sample is imposed by flowing dry air from a
desiccant tube across the sample. Wetting of the sample is
imposed by saturating the air with water before it enters the
chamber and flows across the sample. The water reservoir is
mounted to the temperature controlled lower block to ensure
humidity saturation and minimize temperature fluctuation.
The DVS method for static or equilibrium isotherms consists of
tracking sample weight change as the sample is exposed to
different controlled humidities. The sample is held at each
humidity for a preset time interval or until a steady state weight
change is achieved, the goal being to achieve equilibrium
between the sample water activity and the controlled humidity.
Typically, several humidity levels are chosen and preset during
the setup process. The instrument then tracks equilibrium
progress at each humidity level and automatically steps to the
next humidity when equilibrium requirements are achieved.
Weight change vs. time data is recorded allowing for determining
kinetics of sorption for each humidity level. Using less stringent
equilibrium settings for weight change or setting a reduced time
interval at each step will speed up the isotherm test, but may
give non-equilibrium results. In addition, setting smaller steps in
humidity will increase the data resolution of the isotherm, but at
the expense of much longer test times.
The VSA is a stand-alone instrument with an integrated pump
system that eliminates the need for an external gas cylinder,
however an external gas source can be used if desired. The
instrument consists of a case which houses the power supply, air
pump, balance, temperature controlled sample chamber, sensor
block, sensor and temperature control electronics, water

AquaLab Vapor Sorption Analyzer
2. About the VSA
7
reservoir, and desiccant supply. Setup is as simple as plugging
the instrument in, installing the desiccant tubes, and filling the
water reservoir. Test parameters can be set using an onboard
interface or using a connected computer and VSA software
package.
Specifications
Water Activity (Relative Humidity) Range: 0.03 to 0.95 aw(3%
to 95% RH) for 15 to 50°C , 0.03 to 0.90 awfor 50 to 60°C
Water Activity (Relative Humidity) Accuracy: ±0.005 aw(0.5
%RH) (for volatiles setting, ±0.02 aw)
Water Activity (Relative Humidity) Repeatability: ±0.003 aw
(0.3% RH) (for volatiles setting, ±0.02 aw)
Sample Weight Range: 500-5000 mg
Temperature Control Range: 15 to 60°C at STP. Instrument
Control (sample temperature may vary)
Temperature Operating Range: 0 to 60°C
Humidity Operating Range: 10-90% non-condensing
Universal Power: 110 V to 220 V AC. 50/60Hz
Size (Footprint): 38.1 x 26.7 x 30.5cm (15 x 10.5 x 12in. (L x W
x H))
Weight: 33 pounds
Weight Resolution: ± 0.1mg

AquaLab Vapor Sorption Analyzer
3. Theory
8
3. Theory
Water profoundly influences product attributes such as quality
and safety. To completely understand water relations in a
product requires an understanding of the amount of water
(moisture content) that can be held at a given energy state
(water activity). Moisture sorption isotherms describe the
relationship between water activity and moisture content at a
constant temperature. The nature of this relationship depends on
the interaction between water and other ingredients. The amount
of water vapor that can be absorbed by a product depends on its
chemical composition, physical-chemical state, and physical
structure. Consequently, the isotherm shape is unique to each
product type due to differences in capillary, surface, and
colligative effects (Figure 1). Products that lie in the low water
activity portion of the isotherm are often referred to as dry, those
in the range of 0.60 aw to 0.90 aw are intermediate moisture
products, and those having water activities higher than 0.90 are
high water activity products.
For ease of interpretation, isotherms are often identified by
Brunauer classifications (Brunauer, 1945). Most food and
pharmaceutical products fall under type I, II, or III. Type I
isotherms are typical of very hygroscopic materials. Type II
(sigmoidal) isotherms are typical for intermediate moisture
products. Type III (J-shaped) isotherms are typical for crystalline
and coated materials. These general classifications proved
useful when conducting isotherms on every product was not
feasible due to time and labor constraints. However, with
automation and improved speed, isotherms can easily be
conducted on any product and the uniqueness of each isotherm

AquaLab Vapor Sorption Analyzer
3. Theory
9
often proves more valuable than placing them in a common
classification.
0
5
10
15
20
25
30
35
40
45
50
0 0.1 0.2 0.3 0.4 0.5 0.6 0.7 0.8 0.9 1
Water Activity
Moisture Content (% d.b.)
Icing Creme Filling Cake Wood Pulp Granola Bar Milk Powder
Figure 1. Moisture adsorption isotherms for icing (♦), crème filling (■),
cake (▲), wood pulp (♦), granola bar (*), and milk powder (●) showing
that the isotherm shape is unique to the product.
Moisture Sorption Isotherm Methods
Constructing an isotherm consists of collecting water activity and
moisture content data at various points along the water activity
range. The range of water activities used will depend on the
situation, but normally run from 0.10 awup to 0.90 aw. This can
be accomplished by controlling water activity levels using
saturated salt slurries or mechanical humidifiers and determining
equilibrium moisture content at each water activity level.
Equilibrium is assumed when the weight of the sample stops
changing. This process is often accomplished using sealed
chambers such as desiccators and the equilibration process can

AquaLab Vapor Sorption Analyzer
3. Theory
10
take weeks. Additional challenges with this manual method
include difficulty tracking the weight of the samples, removing the
samples for weighing exposes them to ambient humidity, and at
high humidities, there is the possibility of mold growth. Deca-
gon‘s VSA Isotherm Generator uses the DVS method described
above to speed up and automate the construction of equilibrium
isotherms, eliminating the challenges of manual determination. In
additional to equilibrium moisture contents at a given water
activity, equilibrium isotherms provide information about kinetics
of sorption and water vapor diffusion properties.
Moisture sorption isotherms can also be determined using
dynamic methods such as the DDI method used by the VSA.
The DDI method directly measures water activity while
gravimetrically tracking weight, so there is no dependence on
equilibration to known water activity levels to determine water
activity. Adsorption occurs as saturated wet air is passed over
the sample. Desorption is accomplished as desiccated air is
passed over the sample. After a short period of time, airflow is
stopped and a snapshot of the sorption process is taken by
directly measuring the water activity and weight. The advantages
of this method are increased analysis speed since the sample
does not have to wait for equilibration to a known water activity
and an unmatched level of resolution. This makes it possible for
dynamic isotherms to produce high resolution isotherms in a
matter of days instead of the weeks it would take to make a
comparable isotherm using equilibrium techniques. The high
resolution of dynamic isotherms makes them valuable for
observing sudden changes in sorption properties associated with
matrix changes such as glass transition.

AquaLab Vapor Sorption Analyzer
3. Theory
11
The dynamic nature of the DDI method means that moisture
contents may or may not be at equilibrium and it is possible for
there to be differences between dynamic and equilibrium
isotherms. For samples with fast vapor diffusion, penetration by
water vapor into the whole sample is rapid and isotherms using
the DDI method for these types of products will be comparable
equilibrium methods. However, for samples with slow diffusion
rates, moisture movement through the sample is slow and
complete diffusion of moisture into and out of the sample may be
slow enough to give the appearance of vapor equilibrium in the
headspace during water activity analysis. In reality, the moisture
has not had time to be completely absorbed by the sample.
Isotherms for these types of samples developed using the DDI
method may have lower moisture contents during adsorption and
higher moisture contents during desorption than equilibrium
isotherms, resulting in higher levels of apparent hysteresis.
Combining DVS and DDI in one instrument
A unique and important feature of the AquaLab VSA is that it can
generate both dynamic and equilibrium isotherms. As explained
above, both DVS and DDI methods have advantages and
disadvantages. While the data they generate will agree in some
cases, it is the uniqueness of the results from each method that
gives them value. There is information that can only be obtained
from dynamic isotherms such as critical water activities for glass
transition. Similarly, there is information that can only be
obtained by equilibrium isotherms such as kinetics of sorption.
Therefore, to provide the most information about the moisture
characteristics of a material, both types of isotherms are needed.
The VSA can provide both DVS and DDI isotherms and even run
them both on one sample.

AquaLab Vapor Sorption Analyzer
3. Theory
12
Hysteresis
Figure 2 shows two isotherms, one obtained by wetting a sample
from complete dryness and the other obtained by drying a
sample from saturation. The arrows show the direction of the
process. The water content at each water activity is higher during
desorption (drying from high water content) than adsorption
(wetting from low water content). This phenomenon is called
hysteresis. The curves in Figure 2 represent limits or bounding
isotherms since they begin at water activities near zero and one.
If a drying process reduces the water activity of a sample only
part way to dryness, and the sample is then re-wet, it follows a
path between the wetting and drying boundary curves, as shown
in Figure 3. These curves are called scanning curves, and there
can be an infinite number of them depending on where drying
stops and starts.
Figure 2. Full isotherm showing hysteresis.

AquaLab Vapor Sorption Analyzer
3. Theory
13
0.00
2.00
4.00
6.00
8.00
10.00
12.00
14.00
0 0.2 0.4 0.6 0.8 1
Water Activity
Moisture Content (%d.b.)
Figure 3. Scanning adsorption curves resulting from drying to
different water activities.
These observations help clarify the point that an isotherm is not
a single valued function. The water content for any given water
activity value depends on the wetting and drying history of the
sample.
It is possible to obtain isotherm data which appear to show
hysteresis by failing to allow a sample to equilibrate at each step,
or by inducing changes in the water binding properties of the
matrix by wetting or drying. We prefer to treat these cases
separately, and reserve the term hysteresis for situations where
equilibrium is reached, but water contents of wetted and dried
samples still differ because of their history.
Several plausible models exist for hysteresis. Theories are
based on; capillary condensation of porous solids, phase

AquaLab Vapor Sorption Analyzer
3. Theory
14
changes of non-porous solids, structural changes within a solid
matrix, and supersaturation of some solutes during desorption.
Depending on the composition of the sample, these theories
explain why the water content of a desorption process is greater
than that for a wetting process.
1. Capillary condensation of porous solids theory is illustrated
by the ‗ink bottle‘ model, in which pores and capillaries fill
and empty differently. Such a pore fills when the water
activity corresponding to the energy state of the larger
radius is exceeded, but will empty only when the water
activity drops below the energy state of the narrow neck
radius.
2. A phase change of non-porous solids is illustrated by the
fact that desorption from rubbery state can reach equilibrium
faster due to increased molecular mobility, while adsorption
into a glassy material can be slow due to restrictions in
molecular mobility.
3. Structural changes within a solid matrix occur when the
material swells and polar sites once obscured are now
exposed to ‗bind‘ with water. For example, hydrated protein
contains many sites for water ‗binding‘ before desorption
while dehydrated protein have limited polar sites for water
‗binding‘ prior to adsorption.
4. Some solutes may supersaturate below their crystallization
water activity (non-equilibrium condition) and thus, hold
more water as awis lowered. Foods with high sugar content
frequently exhibit this phenomenon.

AquaLab Vapor Sorption Analyzer
3. Theory
15
Non-Equilibrium
If diffusion of water into (adsorption) or out of (desorption) a
material is slow and sufficient time is not allowed for complete
diffusion, there will be a large amount of apparent hysteresis that
could be reduced by allowing sample equilibration.
Matrix Changes
Figure 4 shows three different isotherm curves of spray-dried
milk powder with different maximum water activities and different
sorption histories. The boundary isotherm with a 0.80 aw
maximum experienced a phase change at 0.43 aw, indicated by a
sharp inflection point in the curve. The desorption curve for this
isotherm appears to show hysteresis, especially below a water
activity of 0.60. However, an isotherm, run on a sample wetted to
a maximum water activity below the phase change, exhibits very
little hysteresis. The lack of hysteresis in this isotherm indicates
that the matrix changes that occur at 0.43 aware completely
responsible for the apparent hysteresis.
Water in a sample is bound to particle surfaces by various
bonding mechanisms. When the configuration of particle
surfaces changes due to a phase change, binding sites change
and the amount of water which can be bound at a given energy
of water also changes. An isotherm curve of the phase changed
sample does not show further phase transitions since simply
drying the sample does not return it to an amorphous state.
These matrix changes represent a true physical change in the
material. They are not reversible by drying, no matter how many
drying cycles occur. Differences between the adsorption and

AquaLab Vapor Sorption Analyzer
3. Theory
16
desorption curves in the initial isotherm is not true hysteresis
since the sample matrix has experienced a physical change.
Differences between sorption curves in the subsequent
isotherms represent true hysteresis.
0
5
10
15
20
25
0 0.2 0.4 0.6 0.8 1
Water Activity
Moisture Content (% d.b.)
Figure 4. Moisture sorption isotherms for spray-dried milk
powder showing a change in hysteresis due to a phase change
at 0.43 aw. When the isotherm is ended prior to the phase
change at 0.43 aw (■), there is little hysteresis. When the
isotherm is ended above the phase change (), there is
apparent, but not actual hysteresis due to the phase change.
Subsequent isotherms run on the sample after experiencing a
phase transition (▲) do not show an inflection point, are
repeatable, and exhibit only small levels of hysteresis.
Working Isotherms
Full boundary isotherms give information about the physical
characteristics of a product, show hysteresis, and are important
in establishing critical control points, but in many cases a
working isotherm will prove very useful. A working isotherm
Other manuals for AquaLab
1
Table of contents
Other Decagon Measuring Instrument manuals
Popular Measuring Instrument manuals by other brands
Sennheiser
Sennheiser RV 54 Bedienungsanleitung
PRECISION DIGITAL
PRECISION DIGITAL Loop Leader PD683 instruction manual
PROLEC
PROLEC Liftwatch Rail Operator's manual
ProMinent
ProMinent DULCOMETER DMT Series operating instructions
TA Instruments
TA Instruments TMA 2940 instructions
Traceable
Traceable Digi-Sense 98767-05 instructions
