eDAQ e-corder pH/mV Amp User manual
e-corder
®
www.
eDAQ
.com
eDAQ Amp User Manual
pH/mV Amp
pH / mV Amp
Electrode Reference
Temperature

ii
pH/mV Amp
This document was, as far as possible, accurate at
the time of printing. Changes may have been made
to the software and hardware it describes since
then: eDAQ Pty Ltd reserves the right to alter
specifications as required. Late-breaking information
may be supplied separately. Latest information and
software updates can be obtained from our web
site.
Trademarks of eDAQ
e-corder
and PowerChrom are registered trademarks
of eDAQ Pty Ltd. Specific model names of data
recording units, such as
e-corder
201, and
PowerChrom 280, are trademarks of eDAQ Pty Ltd.
Chart and Scope are trademarks of ADInstruments
Pty Ltd and are used under license by eDAQ.
EChem is a trademark of eDAQ Pty Ltd.
Other Trademarks
Mac OS, and Macintosh, are registered trademarks
of Apple Computer, Inc. Windows 98, Windows
Me, Windows 2000, and Windows XP are
trademarks of Microsoft Corporation.
PostScript, and Acrobat are registered trademarks of
Adobe Systems, Incorporated.
All other trademarks are the properties of their
respective owners.
Product: pH/mV Amp (EA165)
Document Number: U-EA165-1103
Copyright © November 2003
eDAQ Pty Ltd
6 Doig Avenue
Denistone East, NSW 2112
AUSTRALIA
http://www.eDAQ.com
email: [email protected]
All rights reserved. No part of this document may be
reproduced by any means without the prior written
permission of eDAQ Pty Ltd.

pH/mV Amp
iii
Contents
1
Overview
1
How to Use this Manual 2
Checking the pH/mV Amp 2
.
eDAQ Amps 2
2
The pH/mV Amp
5
The Front Panel 6
The Electrode and Reference Input 6
The Online Indicators 6
The Temperature Input 7
The Back Panel 7
The Signal Outputs 8
I
2C Connector 8
Connecting to the e-corder 8
The pH/mV Amp Self Test 10
Using Chart and Scope 10
Setting up the pH/mV Amp 10
Previewing the Signal 11
Setting up the Temperature Amp 14
The Temperature Probe 17
3
pH Calibration Extension
19
Electrode Calibration 20
Temperature Compensation 25
Manual Temperature Compensation 25
Automatic Temperature Compensation 26
Isopotential Point 28
Viewing Electrode Response 28
Manual Compensation Response 29
Removing the Calibration 30
A
Technical Aspects
31
pH/mV Amp Operation 31
Technical Description 32
B
Troubleshooting
35
C
Specifications
37
D
Electrode Behavior
39
The Nernst Equation 39
Electrode Response 40
The Isopotential Point 40
Non-Linear Calibration 41
Index
43
License & Warranty
45
pH / mV Amp
Electrode Reference
Temperature

iv
pH/mV Amp

pH/mV Amp
1
CHAPTER ONE
1
Overview
The eDAQ pH/mV Amp is designed to work with an e-corder system,
recording signals from:
• pH electrodes
• potentiometric ion selective electrodes (ISEs)
• redox (or ORP, oxidation–reduction) potentiometric electrodes
• other high impedance sources up to ±2 V requiring electrometer
input.
The in built temperature amplifier can be used to provide automatic
temperature compensation (ATC) for pH and ion selective electrodes.
This chapter provides an overview of the pH/mV Amp, and describes
its basic features.

2
pH/mV Amp
How to Use this Manual
This manual describes how to set up and begin using your pH/mV
Amp. The use of the pH/mV Amp with the Chart software pH
Calibration extension is discussed. The appendices provide technical
and troubleshooting information.
Checking the pH/mV Amp
Before you begin working with the pH/mV Amp, please check that:
• all items described in the packing list are included; and that
• there are no signs of damage that may have occurred during
transit.
Contact your eDAQ distributor if you encounter a problem.
You should also become familiar with the basic features of your
e-corder
system, which are discussed in the
e-corder
Manual
on the
Installer CD.
.
eDAQ Amps
The pH/mV Amp is part of a family of preamplifiers known as eDAQ
Amps.
The pH/mV Amp is designed for recording signals from pH and other
potentiometric electrodes. As with other eDAQ Amps, it is designed to
be operated under full software control and is automatically recognized
by Chart or Scope software which controls its gain range, signal
filtering, and other settings.
The range of eDAQ Amps includes the:
•
pH/mV Amp
, suitable for connection of pH, ion selective, and
potentiometric (ORP) electrodes

Chapter 1 —
Overview
3
•
Potentiostat
, a three–electrode potentiostat that can be used for
voltammetric and amperometric experiments. Gain ranges of 20 nA
to 100 mA in 1:2:5 steps.
•
Picostat
, a high sensitivity three–electrode potentiostat suitable for
use with carbon fibre and other microelectrodes. Current gain
ranges of 10 pA to 100 nA in 1:2:5 steps.
•
Bridge Amp
, suitable for sensors requiring a low drift, high gain
differential amplifier. Also provides DC excitation
•
GP Amp
, suitable for high output sensors requiring a high
impedance single ended or differential amplifier. Also provides DC
excitation.
See our web site at www.eDAQ.com for more information.

4
pH/mV Amp

pH/mV Amp
5
CHAPTER TWO
2
The pH/mV Amp
This chapter describes how to connect and use your pH/mV Amp.
IMPORTANT:
Always make sure that the
e-corder
is turned off before
you connect or disconnect the pH/mV Amp. Failure to do this may
result in damage to the
e-corder
and/or the pH/mV Amp.
6
pH/mV Amp
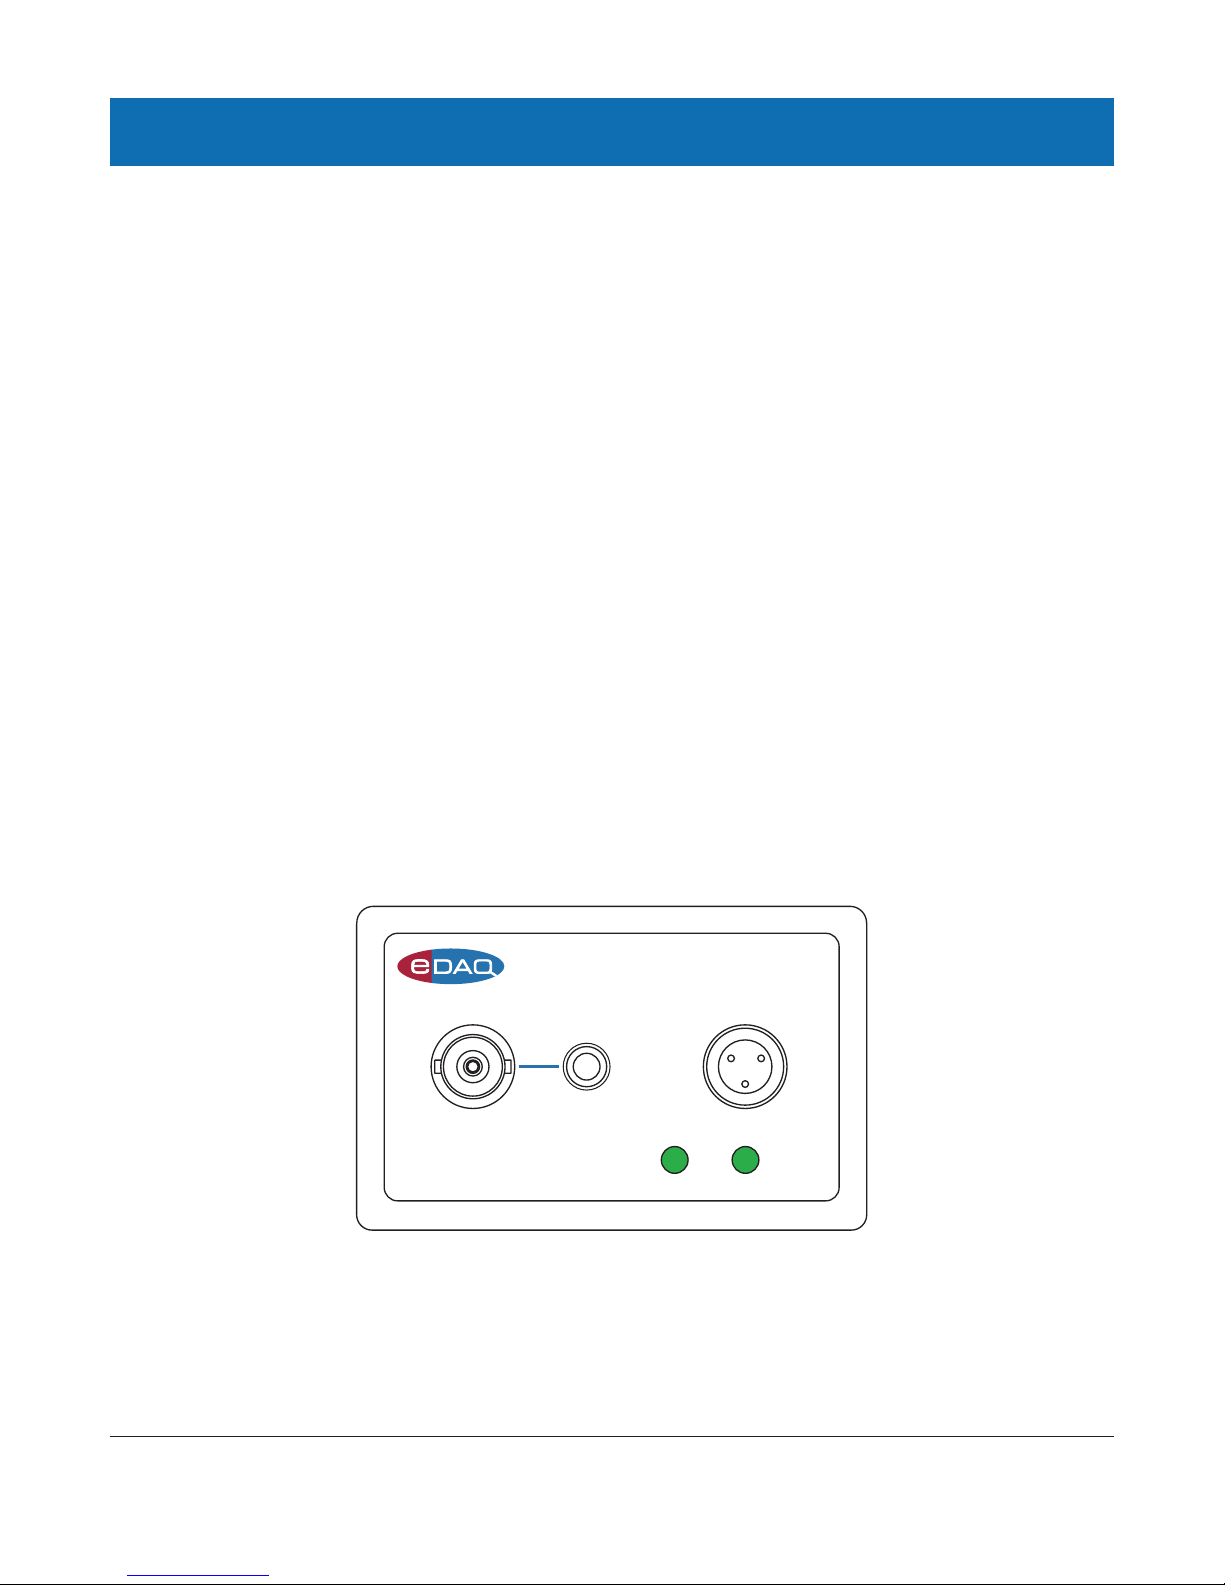
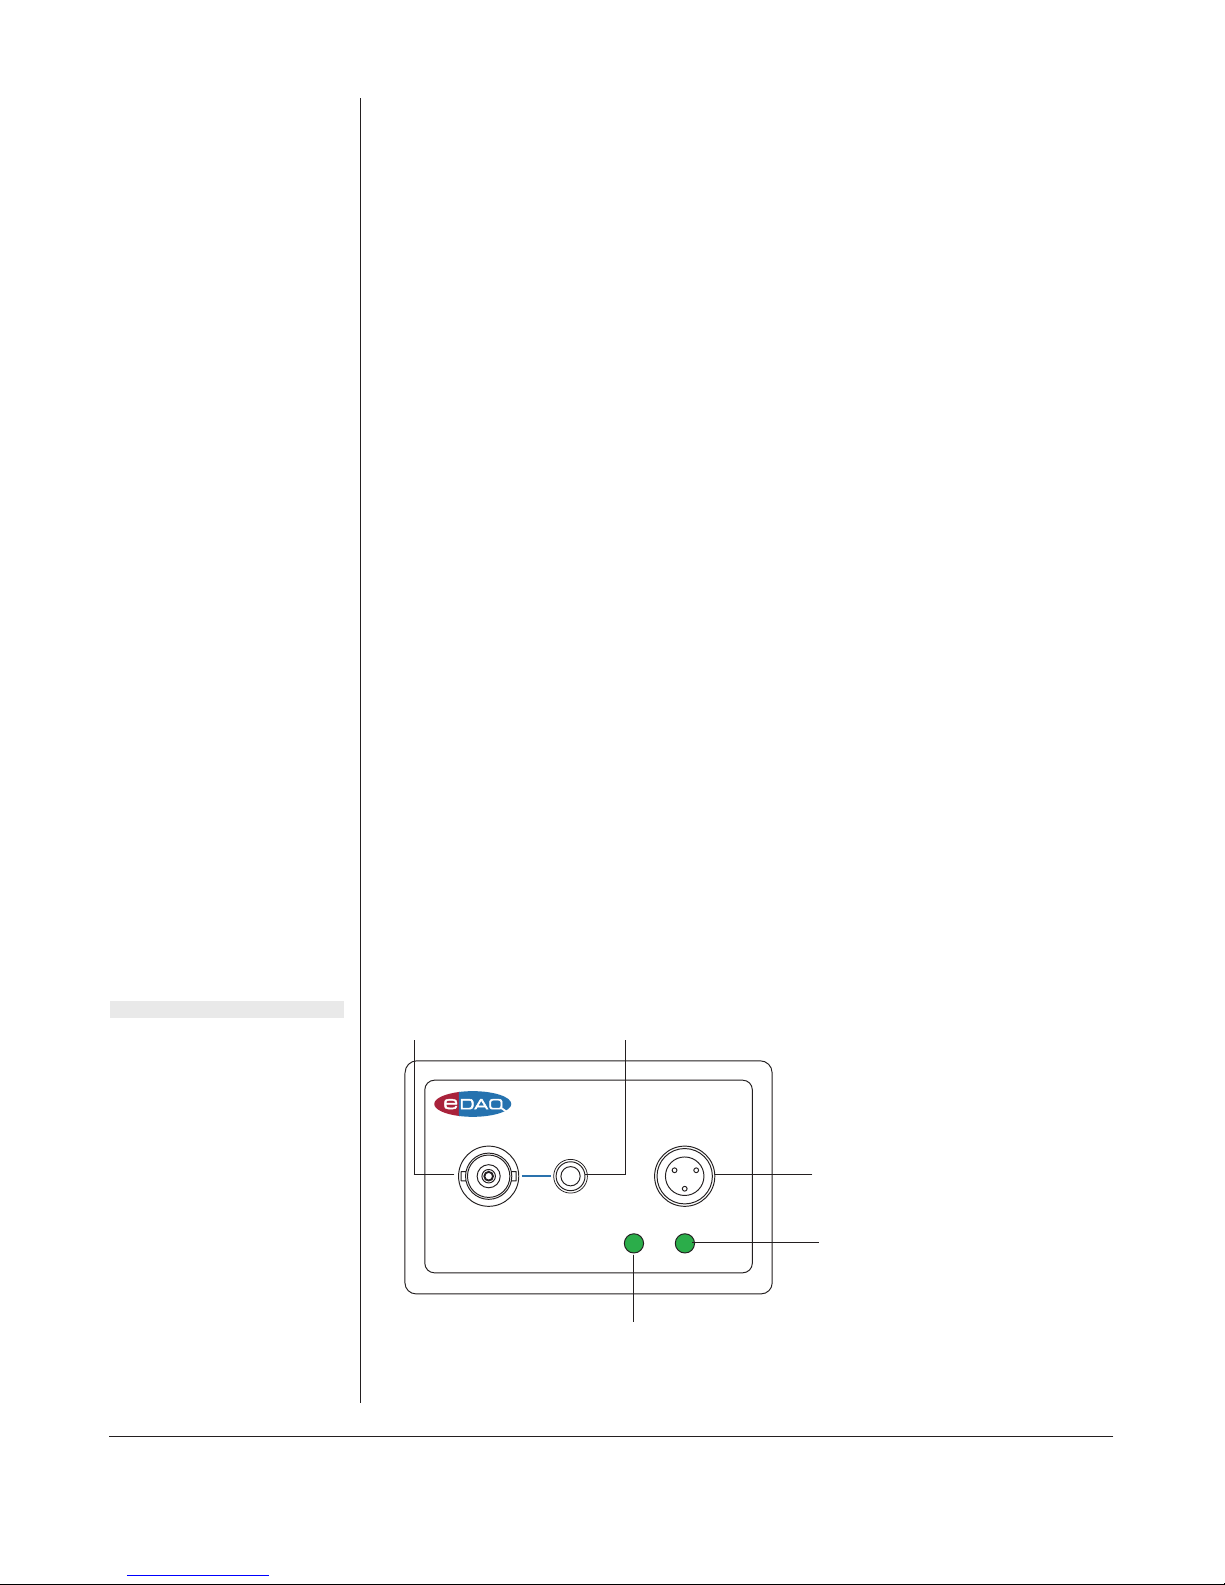
The Front Panel
The
front panel of the pH/mV Amp is shown in Figure 2–1.
The Electrode and Reference Input
The BNC input connector of the pH/mV Amp provides connection for a
pH, ISE or redox electrode. Combination electrodes (that is those with
an internal reference) will only need to be connected to this input.
Electrodes that do not have an internal reference (most ISEs and some
pH electrodes), will need to be used with a separate reference
electrode. This electrode can be connected via the 4 mm Reference
socket. This is in common with the shield (ground) of the BNC electrode
input connector.
The Online Indicators
When lit, these indicate that the software (such as Chart or Scope) has
located and initialized the pH/mV Amp. If the light does not go on
when the software is run, check that the pH/mV Amp is properly
connected. There are two indicators, one to show connection of the
electrode signal, and the second to show connection of the temperature
signal.
pH / mV Amp
Electrode Reference
Temperature
Temperature probe input,
3-pin mini-audio socket
On-line indicator,
temperature signal
Reference electrode,
4 mm socket
Electrode input,
BNC connector
On-line indicator,
electrode signal
Figure 2–1
The pH/mV Amp front
panel
Chapter 2 — The pH/mV Amp 7
The Temperature Input
The temperature input can be used with the 100 Ω platinum resistance
(RTD) probe supplied with the unit.
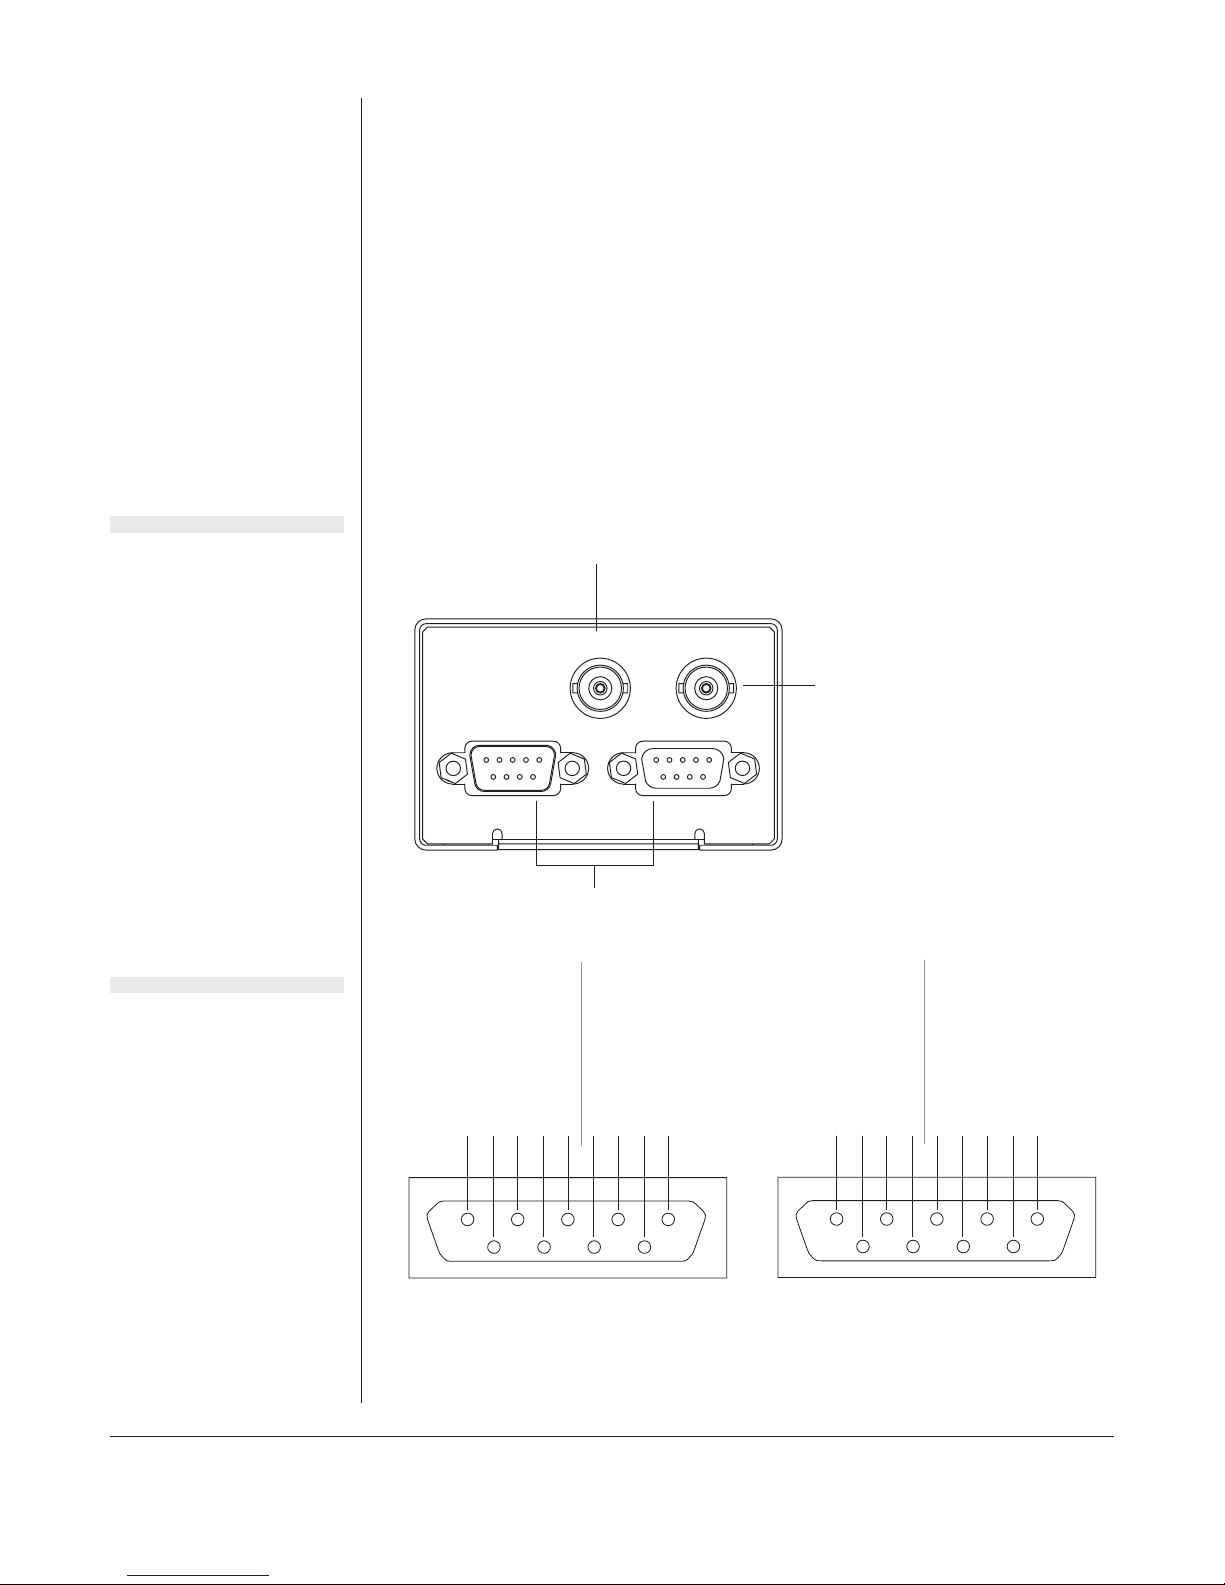
The Back Panel
The back panel of the Potentiostat is shown in Figure 2–2.
1 5
96
Digital Ground
Regulated –17 V DC
Regulated +8 V DC
Regulated +17 V DC
Power lines
SCL
DSC
SDA
DSD
INT
I2C control signals
15
9 6
Digital Ground
Regulated –17 V DC
Regulated +8 V DC
Regulated +17 V DC
SCL
DSC
SDA
DSD
INT
I2C control signals
Input Output
pH Output
Input Output
I C
Bus
I C
2
Temp Output
pH/mV signal,
BNC connector
Temperature signal,
BNC connector
DB–9 pin, I2C connectors
Figure 2–2
The pH/mV Amp back
panel
Figure 2–3
I2C connector pin
assignments

8 pH/mV Amp
The Signal Outputs
The pH/mV Amp back panel has two BNC connectors labelled pH
Output and Temp Output.
The pH/mV Amp provides two signals, the electrode (pH) signal
indicates the potential at the electrode, while the temperature signal
indicates the temperature of the temperature probe. These signals are
independent of one another and do not have to be recorded
simultaneously.
I2C Connector
The back panel, Figure 2–2, has two DB-9 pin ‘I2C bus’ connectors
labelled Input and Output. The Input connector enables connection to
the e-corder (or to the output of other eDAQ Amps). This connection
provides power to the pH/mV Amp and carries the various control
signals (for gain range and filter selection) to and from the e-corder.
The pin assignments are shown in Figure 2–3.
Connecting to the e-corder
Your pH/mV Amp will have been supplied with an I2C cable (DB-9 pin
connectors at either end), and two cables with BNC connectors at
either end.
First make sure that the e-corder is turned off. Then connect the I2C
cable to the I2C connector on the back panel of the e-corder, and the
other end to the I2C Input connector on the back panel of the pH/mV
Amp. Use BNC cables to connect the signal outputs on the back panel
of the pH/mV Amp to the front panel of the e-corder as shown in Figure
2–4. Please note that you can use the pH Output (electrode signal) or
the Temperature Output by itself: you do not need to have both signal
outputs connected.
Check that all connections are firm. Loose connections may cause
failure to recognize the eDAQ Amp by the software, erratic behavior,
or loss of signal.

Chapter 2 — The pH/mV Amp 9
Temp Output pH OutputTemp Output pH Output
Output
Input 1 Input 3Input 2
Input 4
pH/mV Amp
Electrode
Trigger
Power
Status
401
Output
Reference
Temperature
Temp Output pH Output
I2C output I2C input
Figure 2–5
Connecting multiple
pH/mV Amps
Figure 2–4
Connecting a pH/mV
Amp to an e-corder
e-corder
I2C output
I2C input
I2C connector cable
Electrode signal output

10 pH/mV Amp
Multiple eDAQ Amps can be connected to an e-corder. The number
that can be connected depends on the number of input channels on the
e-corder. The initial eDAQ Amp should be connected as shown in
Figure 2–4. The remainder are linked via I2C cables, connecting the
I2C output of one eDAQ Amp to the I2C input of the next, as in Figure
2–5. The signal outputs of each eDAQ Amp are connected to an input
channel of the e-corder.
The pH/mV Amp Self Test
After you have installed the software, connected the e-corder to a
computer as described in your e-corder Manual, and connected the
pH/mV Amp as described above, a quick check can be performed on
the pH/mV Amp:
• Turn on the e-corder and check that it performs its normal
diagnostic tests, as described in the e-corder Manual
• Once the e-corder is ready, open Chart or Scope.
• During initialization, you should see these indicators flash briefly
and then remain lit — the pH/mV Amp is ready for use.
If the indicators do not light, check your cable connections and repeat
the procedure, Appendix B. If this does not solve the problem, contact
your eDAQ distributor. Note, If only the pH Output is connected (as
shown in Figure 2–4), then the Temperature online indicator will not
light, and vice versa.
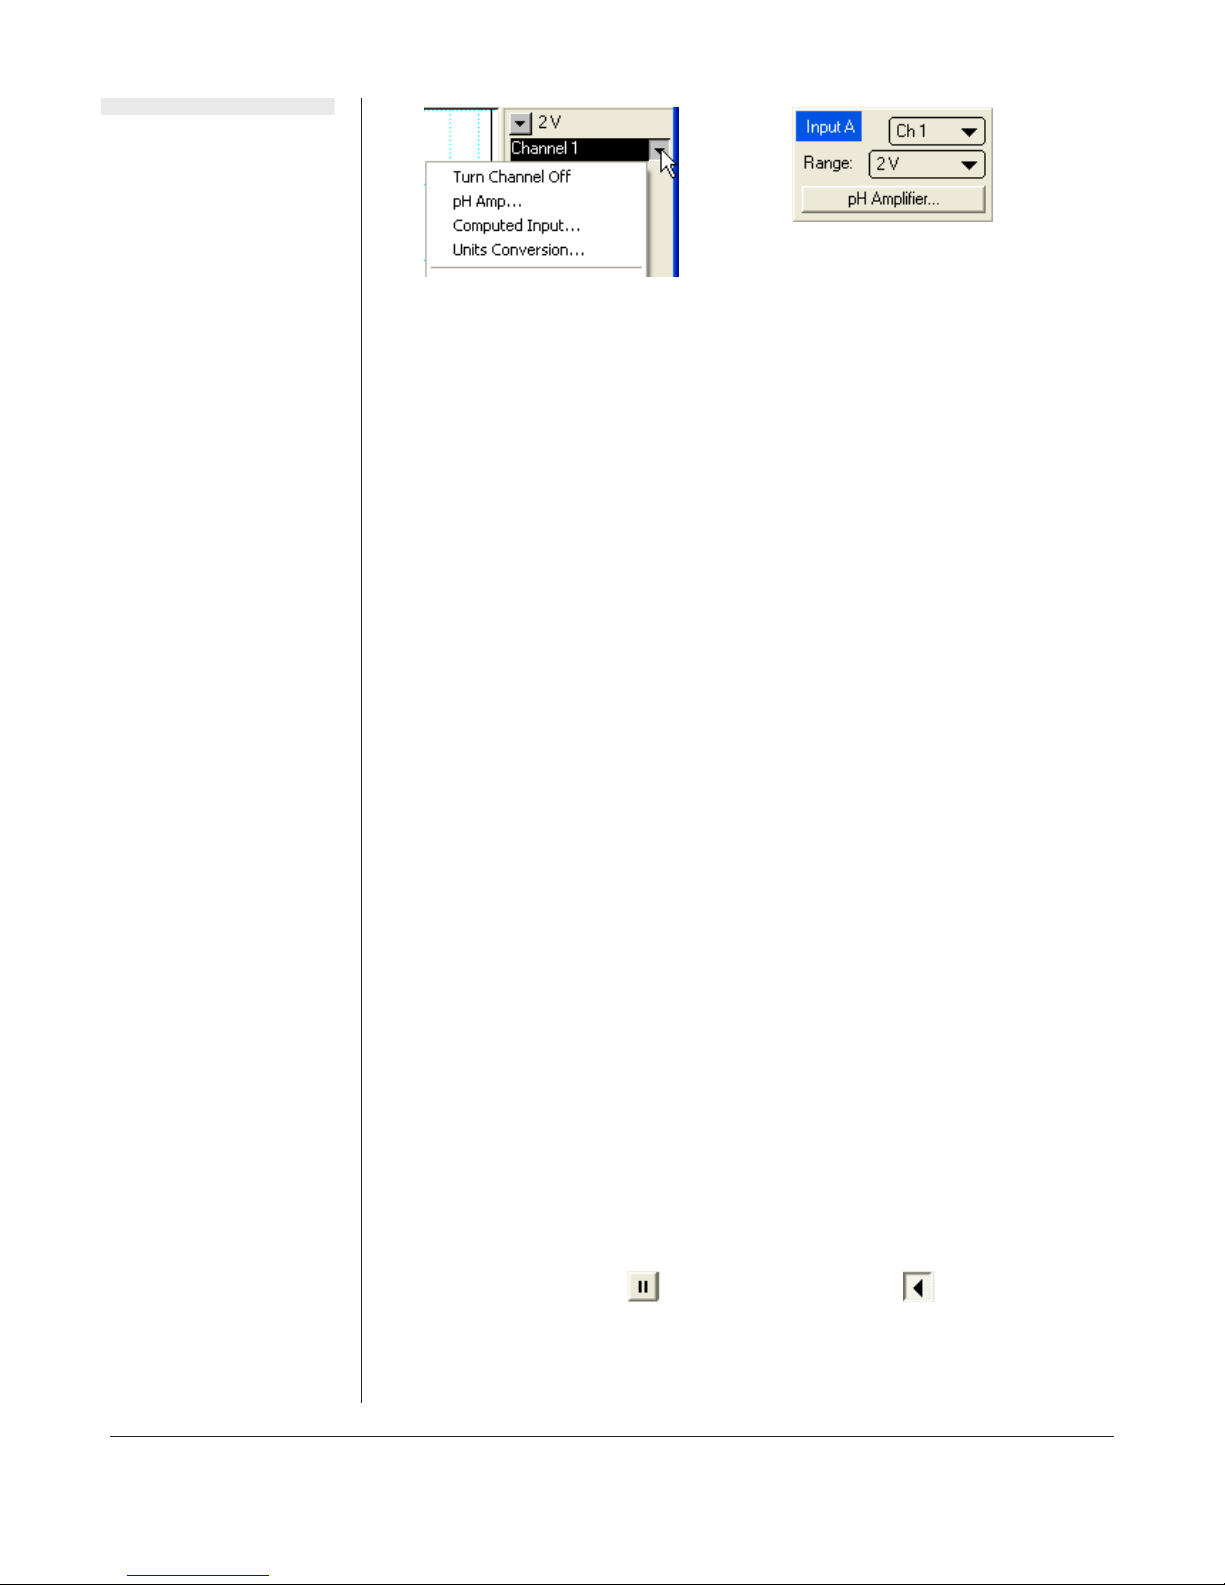
Using Chart and Scope
Setting up the pH/mV Amp
When the pH/mV Amp is connected to an e-corder input and
successfully installed, the pH Amp… menu command appears in the
Chart software Channel Function pop-up menu, Figure 2–6. In Scope
software, the button appears in the Input A (or
Input B) panel, see Figure 2–6.
If the application fails to find the pH/mV Amp, the normal Input
Amplifier… command or button remains. If you were expecting a
Chapter 2 — The pH/mV Amp 11
connected pH/mV Amp, you should check the connections at this point,
quit the application, then open it again.
Choosing the pH Amp… menu command or clicking the button will
bring up the pH Amp dialog box, which replaces the Input Amplifier
dialog box for the channel (your Chart and Scope Software Manuals
have details on the Input Amplifier dialog box).
Previewing the Signal
The pH Amplifier dialog box allows you to preview a signal so that you
can select the amplification, filtering and other settings. The dialog
boxes for Chart software are shown in Figure 2–7 and Figure 2–8. The
Scope software controls are similar.
The incoming signal is displayed in real time, but is not recorded to
hard disk (once the signal moves across the display area it is lost). Click
the OK button to apply the selected settings.
Signal Display
The input signal is displayed so that you can see the effect of changing
the settings. The average signal value is displayed at the top left of the
display area. Slowly drifting signals (as from pH electrodes) will be
represented quite accurately, whereas quickly changing signals will be
displayed as a solid dark area showing only the envelope (shape) of
the signal formed by the minimum and maximum recorded signals.
You can stop the signal scrolling by clicking the Pause button at the top
right of the display area . Click the Scroll button to resume
scrolling.
Chart software
Scope software
Figure 2–6
Accessing the pH/mV
Amp controls

12 pH/mV Amp
Select
filter
Drag labels and tick
marks to adjust axis
e-corder input
channel number Pause/Resume buttons
Select input
channel
Invert signal
Gain range
(sensitivity)
Preview signal
Average signal
amplitude
Select filter
e-corder input
channel number
Pause/Resume button
Preview signal
Invert
signal
Gain range
(sensitivity)
Select input
channel Average signal amplitude
Figure 2–7
The pH/mV Amp pH
dialog box, for
previewing a signal
(Chart software on a
Windows Computer)
Figure 2–8
The pH/mV Amp pH
dialog box, for
previewing a signal
(Chart software on a
Macintosh Computer)

Chapter 2 — The pH/mV Amp 13
You can shift and stretch the vertical Amplitude axis to make the best
use of the available display area (see the Input Amplifier dialog in the
Chart Software Manual for further details). Changes made here update
settings in the main window of the program.
Setting the Range
Use the Range pop-up menu to select the input range or sensitivity of
the channel — the combined range of the pH/mV Amp and the
e-corder. Changing the range in the pH/mV Amp dialog box is the
equivalent to changing it in the Chart or Scope window (all dialog box
changes are made in the main window on clicking the
button).
At 25 °C a range of 59 mV corresponds to a range of approximately
one pH unit. This relationship is used in Table 2–1 which shows the pH
ranges corresponding to the pH/mV Amp range settings. For general
pH measurements, a range of 500 mV should be used, while the
200 mV range is suited for biological pH monitoring.
Filtering
The pH/mV Amp has three low pass filter settings of 2 kHz, 50 Hz and
10 Hz. The low pass filter will remove high frequency noise. pH and
ion selective electrodes have a slow response time, usually in the order
†
Resolution is 16 bits, or 0.0015%, of range setting with Chart and Scope software.
* This range will be limited by the pH electrode
Range setting (mV) Resolution†(µV) Range (pH) Resolution (pH)
±500 15.6 –1.5 to 15.5* < 0.001
±200 6.25 3.6 to 10.4 < 0.001
±100 3.13 5.3 to 8.7 < 0.001
±50 1.56 6.2 to 7.8 < 0.001
±20 0.625 6.7 to 7.3 < 0.001
Table 2–1
pH/mV Amp range
settings corresponding to
pH ranges
14 pH/mV Amp
of seconds, and the 10 Hz filter setting should be used with these
electrodes.
The Mains filter, , removes 50 or 60 Hz interference due to
mains hum. See the Chart Software Manual for more information.
Inverting the Signal
Ticking the Invert checkbox, , reverses signal polarity (that is
positive and negative signal values are reversed).
Units
Clicking the button access the Units Conversion dialog box.
However, when using Chart software for recording data from pH and
ion selective electrodes, where single or double point calibration is
employed, use the pH Calibration extension, see Chapter 3 — do NOT
use Units Conversion. Where multiple point calibration (more than two
points) is required, use the Multiple Point Calibration extension. Both
extensions are available from the eDAQ website (www.eDAQ.com)
For more information about Units Conversion, see the Chart Software
Manual or Scope Software Manual.
Setting up the Temperature Amp
Signal Display
The input signal is displayed so that you can see the effect of changing
the settings — no data is actually recorded when setting up the
Temperature Amp. The average signal value is displayed at the top left
of the display area. Slowly changing waveforms will be represented
quite accurately, whereas quickly changing signals will be displayed as
a solid dark area showing only the envelope (shape) of the signal
formed by the minimum and maximum recorded signals.
You can stop the signal scrolling by clicking the Pause button . Click
the Scroll button to re-start scrolling.
You can shift and stretch the vertical Amplitude axis to make the best
use of the available display area (see the Input Amplifier dialog in the

Chapter 2 — The pH/mV Amp 15
Chart Software Manual for further details). Changes made here update
settings in the main window of the program.
Setting the Range
The Range pop-up menu, , is used to select the input
range, or sensitivity, of the temperature measurement. Use the 2 V
setting for up to 40 °C and the 5 V settings for up to 100 °C.
Inverting the Signal
Ticking the Invert checkbox, , reverses signal polarity (that is
positive and negative signal values are reversed).
Units
Clicking the button accesses the Units Conversion dialog
box, allowing calibration of the signal. The raw temperature reading
will be in volts and must be converted to degrees Celsius, Fahrenheit or
Kelvin for correct display. The Temperature Amp has been factory set to
Amplitude
axis
e-corder input
channel number Pause/Resume buttons
Select input
channel
Units calibration
Signal invert
control
Gain range
(sensitivity)
Average signal
amplitude
Incoming signal
Figure 2–9
The temperature dialog
box (Chart software on a
Windows Computer)

16 pH/mV Amp
produce 0 mV at 0°C with an output of 50 mV/°C with the RTD
temperature probe provided with the unit. If temperature accuracy is of
critical importance you should use two precision temperature sources to
calibrate the temperature probe more accurately — refer to the Chart or
Scope Software Manual.
When using the pH extension with automatic temperature
compensation, the Temperature Amp signal must first be calibrated in
degrees Celsius (°C), degrees Fahrenheit (°F), or Kelvin (K).
Clicking the button transfers the signal in the data display
area of the dialog box to the data display area of the Units Conversion
dialog box. (Use the Pause button to capture any specific signal that
Pause/Resume
button
Select Temperature from
the channel menu
Select suitable range:
5 V up to 100 °C
2 V up to 40 °C
Access Units
Conversion for
Preview of
temperature signal
0 V = 0 °C and
5 V = 100 °C
are the factory
default settings for
the RTD probe
Select
temperature
units
Figure 2–10
The temperature dialog
box (Chart software on a
Macintosh Computer)
Table of contents
Other eDAQ Amplifier manuals


Popular Amplifier manuals by other brands

SoundShaker
SoundShaker TA-4800 installation guide

Cerwin-Vega
Cerwin-Vega Vega Series user manual

Musical Fidelity
Musical Fidelity Tri-Vista 300 Instructions for use

Fosi Audio
Fosi Audio BT10A user manual

Extron electronics
Extron electronics TP T BNC DA4 Specification sheet

axing
axing Basic-line SVS 1-00 Operation instructions


