Peet Bros ultimeter 100 User manual

1
ULTIMETER®100 OWNER’S MANUAL
TABLE OF CONTENTS
Page No.
QUICK START........................................................................... 3
I. INTRODUCTION............................................................. 9
II. PRE-INSTALLATION TESTING.................................... 10
III. PLANNING YOUR INSTALLATION............................... 16
IV. INSTALLING ULTIMETER 100 COMPONENTS........... 20
V. CONNECTING YOUR ULTIMETER 100 SYSTEM........ 23
VI. INITIAL SETTINGS……………….................................. 25
SET YEAR..................................................................... 25
SET DATE AND DATE FORMAT.................................. 25
RESET LONG-TERM MEMORIES................................ 25
SET TIME AND TIME FORMAT.................................... 26
SELECT TEMPERATURE UNITS................................. 26
SELECT WIND SPEED UNITS..................................... 26
SELECT RAIN GAUGE INCREMENTS & UNITS.......... 27
TO ADJUST THE LONG-TERM RAIN TOTAL.............. 29
VII. DISPLAYING CURRENT DATA.................................... 30
VIII. THE ULTIMETER 100 HI/LO MEMORY SYSTEM........ 31
IX. DISPLAYING STORED DATA...................................... 32
TO DISPLAY HIGHEST VALUES................................. 33
TO DISPLAY LOWEST VALUES.................................. 33
TO DISPLAY RAINFALL............................................... 34
X. RESETTING LONG-TERM MEMORY VALUES............ 34
TO RESET A SINGLE LONG-TERM HI OR LO............ 34
TO RESET ALL LONG-TERM HI & LO MEMORIES..... 34
XI. ALARMS........................................................................ 35
TO SET AN ALARM....................................................... 35
THE RAIN RATE ALARM.............................................. 35
TO MOMENTARILY STOP AN ALARM......................... 36
TO DISABLE AN ALARM............................................... 36
Continued On Next Page
2
XII. THE ULTIMETER 100 SERIAL PORT.......................... 37
WEATHERTEXT OUTPUT MODE................................ 37
COMPLETE RECORD MODE....................................... 37
DATA LOGGER MODE................................................. 38
PACKET MODE............................................................ 38
COMPLETE HISTORY MODE...................................... 38
MULTIPLE OUTPUT MODE.......................................... 38
MODEM MODE............................................................. 38
XIII. SUPPLEMENTAL WIND VANE CALIBRATION............ 39
XIV. TEMPERATURE OFFSET ADJUSTMENT.................... 40
XV. ROUTINE MAINTENANCE............................................ 41
XVI. REPAIR & EXCHANGE SERVICE................................. 42
XVII. SPECIFICATIONS......................................................... 43
XVIII. AVAILABLE ACCESSORIES......................................... 47

3
QUICK START GUIDE
FOR THOSE WHO DON’T HAVE TIME TO READ
INSTRUCTIONS
(AND THOSE WHO DO)
In addition to these few "Quick Start" paragraphs,
please be sure to read the section on installation very
carefully. It includes important safety information as
well as time saving installation tips.
SUGGESTION: DO NOT UNCOIL CABLES UNTIL YOU
HAVE TESTED AND BECOME FAMILIAR WITH ALL
COMPONENTS AND ARE READY TO INSTALL THE
SYSTEM.
ABOUT THE KEYBOARD
There are six “data keys,” each identified by a symbol as
shown below:
WIND
SPEED WIND
CHILL TEMP RAIN TIME DATE
In addition, there are six “utility keys,” each identified by a
symbol as shown below:
cb
a
SCAN LAMP CLEAR ALARM DOWN UP
4
CONNECT SYSTEM COMPONENTS
Connect components to Junction Box as shown in diagram below. Refer
to the section "Installing Your ULTIMETER 100 Components".
WEATHER BASE 10
West M arine
W
N
S
E
ULTIMETER 100
ULTIMETER
PC Data Logger
(Optional)
Junction Box Cable
AC Adapter
Junction Box
Wind Sensor
Temperature Sensor
Rain Gauge (Optional)
Indoor Temperature Sensor
(Optional)
R
THE WEATHER PICTURE
PEET BROS.
W
S
E
N
2 4
WIND CHILL
HI WIND TODAY
WIND SPEED
HI TEMP TODAY
TEMPERATURE
LO TEMP TODA Y
RAIN TOD AY
9
6 4
7 6
7 0
5 4
0 0.2 8
The Weather Picture
(Optional)
OR
ULTIMETER 100
Keyboard Display
Connection of both The Weather Picture
AND a PC Data Logger to the i/oport
requires a Duplex Cable.
*
*
Duplex Cable
(Optional)
NOTE: The Weather Picture requires a 12v/1000mA AC Adapter be
used in place of the 12v/400mA AC Adapter supplied with the
ULTIMETER 100. Also, BEFORE YOU INSTALL PLUGS IN
RECEPTACLES, be sure to check connectors as shown on p. 13.

5
TO DISPLAY WIND SPEED, WIND CHILL, TEMPERATURE,
TIME, OR DATE
Press and release the desired data key: , , ,
, or .The corresponding symbol will appear on the
screen and the current data value will be displayed.
NOTE: When you first press ,the instrument will display
the outdoor temperature.
TO DISPLAY WIND DIRECTION
After installation, the ULTIMETER 100 will constantly indicate the
prevailing wind direction on its 16 point compass rose. The
system minimizes confusing "jitters" by ignoring momentary
direction changes that occur during transient wind gusts. It also
avoids erroneous readings, by "locking" the wind direction display
when there is no wind, i.e. when the cups are not spinning.
Therefore, in order to test or demonstrate the wind direction
function, you must spin the cups. You'll find it is best to blow
somewhat steadily on the cups, rather than abruptly spinning the
anemometer rotor with your fingers.
The current wind direction in degrees (°) is displayed by pressing
the key twice (the first press displays the current wind speed):
N=0°, E=90°, S=180°, W=270°, etc. Pressing the key again
returns the display to the current wind speed.
TO DISPLAY INDOOR TEMPERATURE (REQUIRES OPTIONAL
SENSOR)
a) Press and release to display outdoor temperature.
b) Next, press and release a second time to display
indoor temperature.
TO DISPLAY HIGHEST AND LOWEST READINGS
a) Press the desired data key to display the current value.
b) To display TODAY'S highest or lowest values (since
midnight), press or once. The display will
repeatedly cycle through today's date, today's high or low
value, and the time at which it occurred.
c) To display PREVIOUS DAY'S highest or lowest values
(from midnight to midnight), press or again, 6
repeatedly, to display the values for each of the LAST SEVEN
DAYS. After each press, the display will repeatedly cycle
through: the selected date, that day's high or low value, and
the time at which it occurred.
d) To display the LONG TERM High or Low values (since last
RESET), press or a ninth time. The display will
repeatedly cycle through: the date on which the high or low
occurred, the highest or lowest value since last reset, and the
time at which it occurred. This display mode is easily
recognized by the flashing when the date is displayed.
e) Pressing or a tenth time returns the display to
TODAY'S high or low value.
TO DISPLAY RAINFALL
a) To display TODAY'S rainfall (since midnight), press .
b) To display PREVIOUS DAY'S rainfall (from midnight to
midnight) press , repeatedly, to display daily rainfall for
each of the LAST SEVEN DAYS. The display will alternate
between the selected date and that day's total rainfall.
c) To display the LONG-TERM ACCUMULATED rainfall
(since you last reset this value to zero), press an eighth
time. The display will alternate between the date you last
reset this total and the rainfall accumulation since that date.
d) Pressing a ninth time returns the display to
TODAY'S rainfall.

7
TO CHANGE MEASUREMENT UNITS OR FORMAT
Use the procedure below to select: Wind Speed in mph, m/s,
knots, or km/h; Temperatures in Fahrenheit or Celsius; Time
in 12- or 24-hr format; Date in day/month or month/day
format; Rainfall increments of 0.01 in, 0.25 mm, 0.1 in, 0.1
mm, or 2.5 mm according to your preference and the type of
rain gauge you are using.
a) Press and hold the desired data key: , , ,
, or . KEEP IT PRESSED UNTIL THE DISPLAY
CHANGES (after flashing three times).
NOTE: Units for wind chill , dew point d.p. , and heat
index will be the same as for temperature.
b) Repeat this step until data is displayed in the desired units
or format.
TO ADJUST TIME, DATE, AND YEAR SETTING
This instrument features a perpetual calendar. For it to operate
correctly, you must set the current year before you set the day and
month.
a) Press and release and simultaneously. The
clock and calendar symbols will appear on the screen and the
instrument will display the year setting (default is 2009).
b) Press and KEEP IT PRESSED until the year begins
to change. Then press or as required until the
display shows the current year.
c) Press and release to set time or to set date.
d) Press and hold or as required until the displayed
value is close to correct, then press repeatedly until correct
setting is displayed. Press any data key to return to normal
operation.
NOTE: The ULTIMETER 100 is designed to minimize the
chance of someone else accidentally clearing your data or
changing your settings. That is why, in many of the
procedures below, you must first display the value you wish to
change, then press and hold a key for 3-4 seconds before
settings are cleared or changed.
8
ANSWERS TO A FEW MOST LIKELY QUESTIONS . . .
WHAT IS THE BUTTON FOR?
This button activates display backlighting, for viewing in a
dark room. Pressing the button once turns backlighting on,
and pressing it again turns it off. Backlighting may be left on
continuously if desired.
WHAT DOES THE BATTERY SYMBOL MEAN?
The battery symbol (not flashing) means the instrument is
operating from battery power. Likely causes are a
disconnected AC adapter, an AC power outage, or a faulty
AC adapter.
WHAT DOES A FLASHING BATTERY SYMBOL MEAN?
The battery symbol will flash if the battery is weak, or if no
battery has been installed.
WHAT IS THE MODULAR 6-CONDUCTOR JACK ON THE SIDE
OF THE CONTROL UNIT?
This jack is an RS232-compatible Serial Data I/O jack. It is
used for sending weather data to a personal computer or
other external device, such as The Weather Picture, Weather
Vox, or a radio transmitter. It is also used for connecting the
optional Indoor Temperature Sensor.
An additional Serial Data Output port is located in the junction
box (labeled "i/o").

9
I. INTRODUCTION
Congratulations on selecting The ULTIMETER 100 Weather
Station. To take full advantage of its advanced features,
please take a few minutes to read through and follow this
short booklet. Its simple step-by-step instructions will speed
you through system installation and help assure you many
years of complete satisfaction.
SUGGESTION: DO NOT UNCOIL CABLES UNTIL YOU
HAVE TESTED AND BECOME FAMILIAR WITH ALL
COMPONENTS AND ARE READY TO INSTALL THE
SYSTEM.
IMPORTANT NOTE CONCERNING WIND DIRECTION:
The ULTIMETER 100 is designed to detect and display the
prevailing wind direction on its 16 point compass rose. The
system minimizes confusing "jitters" by ignoring momentary
direction changes that occur during transient wind gusts. It
also avoids erroneous readings, by "locking" the direction
display when there is no wind, i.e. when the cups are not
spinning. Therefore, in order to test or demonstrate the wind
direction function, you must spin the cups. You'll find it is
best to blow somewhat steadily on the cups, rather than
abruptly spinning the anemometer housing with your fingers.
The current wind direction in degrees (°) is displayed by
pressing the key twice (the first press displays the
current wind speed). Pressing the key again returns the
display to the current wind speed.
10
II. PRE-INSTALLATION TESTING
Before you uncoil any cables, you should interconnect and test the
system components, as described below. This will allow you to
become familiar with the system and assure that all components
are functioning properly before you install them.
Setup
1. Carefully remove each component from its shipping container
and place them all on a clear work area.
2. As shown below, identify the basic system components and
any accessories you have ordered.
Keyboard/Display Unit Junction Box
PRO
Anemometer/
Wind Vane
Junction Box Cable
Desk Stand
AC Adapter
Cable Ties
Anemometer Cups
(PRO)
Temperature Sensor
Wall Mount Bracket
Wind Vane Fin
Cup Retaining Clips
WEATHER BASE 10
West Ma rine
W
N
S
E
ULTIMETER 100
N2:00
Not shown: 2 screws for desk stand; 2 screws for wall mounting keyboard/display unit; 2
drywall screws for wall mounting keyboard unit; mounting bracket and screw for
temperature sensor.

11
3. Install Anemometer Cups
Plug each cup firmly into place on the anemometer rotor
housing. Be sure that each cup arm snaps solidly.
NOTE: THE CUPS MUST BE ORIENTED AS SHOWN OR
WIND DIRECTION WILL BE INCORRECTLY DISPLAYED,
AND THE CUPS WILL NOT PROPERLY LOCK INTO
PLACE.
CUP ORIENTATION
(viewed from above)
4. Install Cup Retaining Clips (PRO Anemometer Only)
Spread the metal retaining clip apart and over the top of each
cup connection as shown.
Press down until clip is FULLY seated. Press the sides of the
clip to be sure the clip wraps around the bottom side of the cup
connection.
12
5. Install the Wind
Vane Fin
Insert the fin into the
open end of the
wind vane pointer
as shown. Press in
firmly until a “snap”
is felt.
6. Select the correct Anemometer Calibration
The correct anemometer (PRO, w/2.6” cups, or Standard, w/1.2”
cups) must be selected on the ULTIMETER keyboard/display for
wind speed to be properly calculated and displayed.
a. Press and buttons simultaneously to display the
presently selected anemometer. The default setting is “PRO”.
b. To change setting between “PRO” anemometer and “Std”
anemometer, press and HOLD and buttons
simultaneously while the display flashes three times. The new
selection is then displayed.
c. Press any key to return to normal operation.
d. Displayed wind speeds using PRO calibration will include
tenths of units (ex: 10.5), where wind speeds using Std
calibration will be display as whole numbers (ex: 10).

13
IMPORTANT NOTE CONCERNING UPGRADES:
If you have upgraded your weather station by adding a new
ULTIMETER 100 keyboard/display, but are still using an earlier
anemometer (with 1.2-inch cups), you must select the Standard
(“Std”) calibration in order to properly measure wind speeds.
7. Check all receptacles for crossed wires (see illustration below).
This can occur during plug-in and unplugging of the cables. It can
be corrected by using a pair of tweezers to gently lift the wire back
into the correct slot.
WRONG RIGHT
8. Without uncoiling the cables, plug the wind vane cable and the
temperature cable into the junction box, in accordance with the
markings on top of the junction box.
NOTE: If you have ordered any extension cables, do not
uncoil them, but insert each between the junction box and
the thermometer or anemometer/wind vane, just as it will be
used in your actual installation.
9. Uncoil the 8-ft. junction box cable and plug one end into the
receptacle on the back of the keyboard/display unit. Plug the
other end into the junction box, opposite the temperature cable.
10. Plug the AC adapter cable into the junction box, then plug the
adapter itself into a 110-volt 60-cycle outlet. After 2 or 3 seconds,
the liquid crystal screen will come on, displaying the clock symbol,
“12:00” and the compass rose for wind direction, as shown below.
WEATHER BASE 10
West Marine
W
N
S
E
ULTIMETER 100
14
Test Anemometer/Wind Vane Functions
1. Press and release the wind speed key, marked , to display
current wind speed. Press and release it a second time to display wind
direction in degrees°(N=0°, E=90°, S=180°, W=270°, etc.)
2. If you wish to display wind speed in units other than mph, press
again and keep it pressed. The screen will flash 3 times, then display
wind speed in m/s. Each time you repeat the procedure, wind speed will
be displayed in alternate measurement units; mph, m/s, knots, or km/h.
3. Blow gently and steadily on the anemometer cups, so they rotate
clockwise when viewed from above and the screen displays a fairly
steady wind speed of 3.0 mph or more (4.8 km/h or 2.6 knots). Stop
blowing when a wind direction arrow is displayed within the compass
rose. The wind direction is calculated only while the anemometer cups
are spinning. This prevents any false indication of the last wind
direction.
4. Point the wind vane in the opposite direction. Again blow gently and
steadily on the cups. The wind direction arrow will shift to the opposite
side of the compass rose.
5. Now blow on the cups a little harder, until the reading increases, then
let the cups stop.
6. Press the up key, which is marked . The screen will display the
highest wind speed registered while you were blowing on the cups. The
direction in degrees (of the highest wind) and the time and date at which
the high wind speed occurred will be alternately displayed (see
"Displaying Stored Data" section for complete information). Don't worry
that time and date are not yet correct - we'll be setting them in "Initial
Adjustments" instruction section.
NOTE: The ULTIMETER 100 does not display a low wind speed value,
simply because zero is normally the lowest wind speed measured.
7. Press any function key to exit the highest value display.
Test Temperature Functions
1. Press and release the temperature key, which is marked on the
keyboard/display unit. The screen will display current temperature in
degrees Fahrenheit and a thermometer symbol.
2. Press again and keep it pressed. The screen display will flash 3
times, and then display the temperature in degrees Celsius. Release the
key. Repeat this procedure until the units you intend to use are

15
displayed. Each time you repeat this procedure, temperature will be
displayed in alternate units, Celsius or Fahrenheit.
3. Hold the temperature sensor in your hand for 2 or 3 minutes. The
temperature indicated on the screen will rise.
4. Release the temperature sensor and allow the indicated temperature
to come back down several degrees.
5. Press the up key, which is marked . The screen will display the
date, highest temperature registered, and time it occurred, while you
were holding the sensor.
6. Press any function key to exit the highest value display. When you
are entirely satisfied with the instrument's performance, you are ready to
proceed.
7. Unplug the junction box cable from the back of the keyboard to erase
test readings from memory.
16
III. PLANNING YOUR INSTALLATION
Please take a few minutes to plan the installation of your home
weather station. You'll help assure your long term satisfaction
with the installation and almost certainly save time and effort in the
process.
It may be helpful to remember that the cable lengths are:
Wind Sensor: 40 feet Temperature Sensor: 25 feet
Rain Gauge (Optional): 40 feet Junction Box Cable: 8 feet
AC Adapter Cord: 6 feet
First you must decide where each system component is to be
installed. We suggest that you determine the optimum location of
the prime components in the order shown below.
Control Unit Location - The primary considerations in
placement of the Keyboard/Display unit are: which room it
should go in, and should it be wall mounted or desk mounted.
Room Selection
- in which room will the data be most useful (e.g. bedroom,
kitchen, hallway near hall closet, solarium, etc.);
- in which room will the most people be able to enjoy and use
the data (e.g. living room or family room);
- other factors being equal, which room will make for easiest
wiring.
Wall Mount Advantages
- better visibility from most of the room;
- wiring can often be completely concealed -- may offer
shorter wire runs to outside sensors, possibly avoiding the
need for extension cables.
Desk Mount Advantages
- convenient access to keyboard;
- optimum visibility from desk chair;
- convenient for connection to a Personal Computer.

17
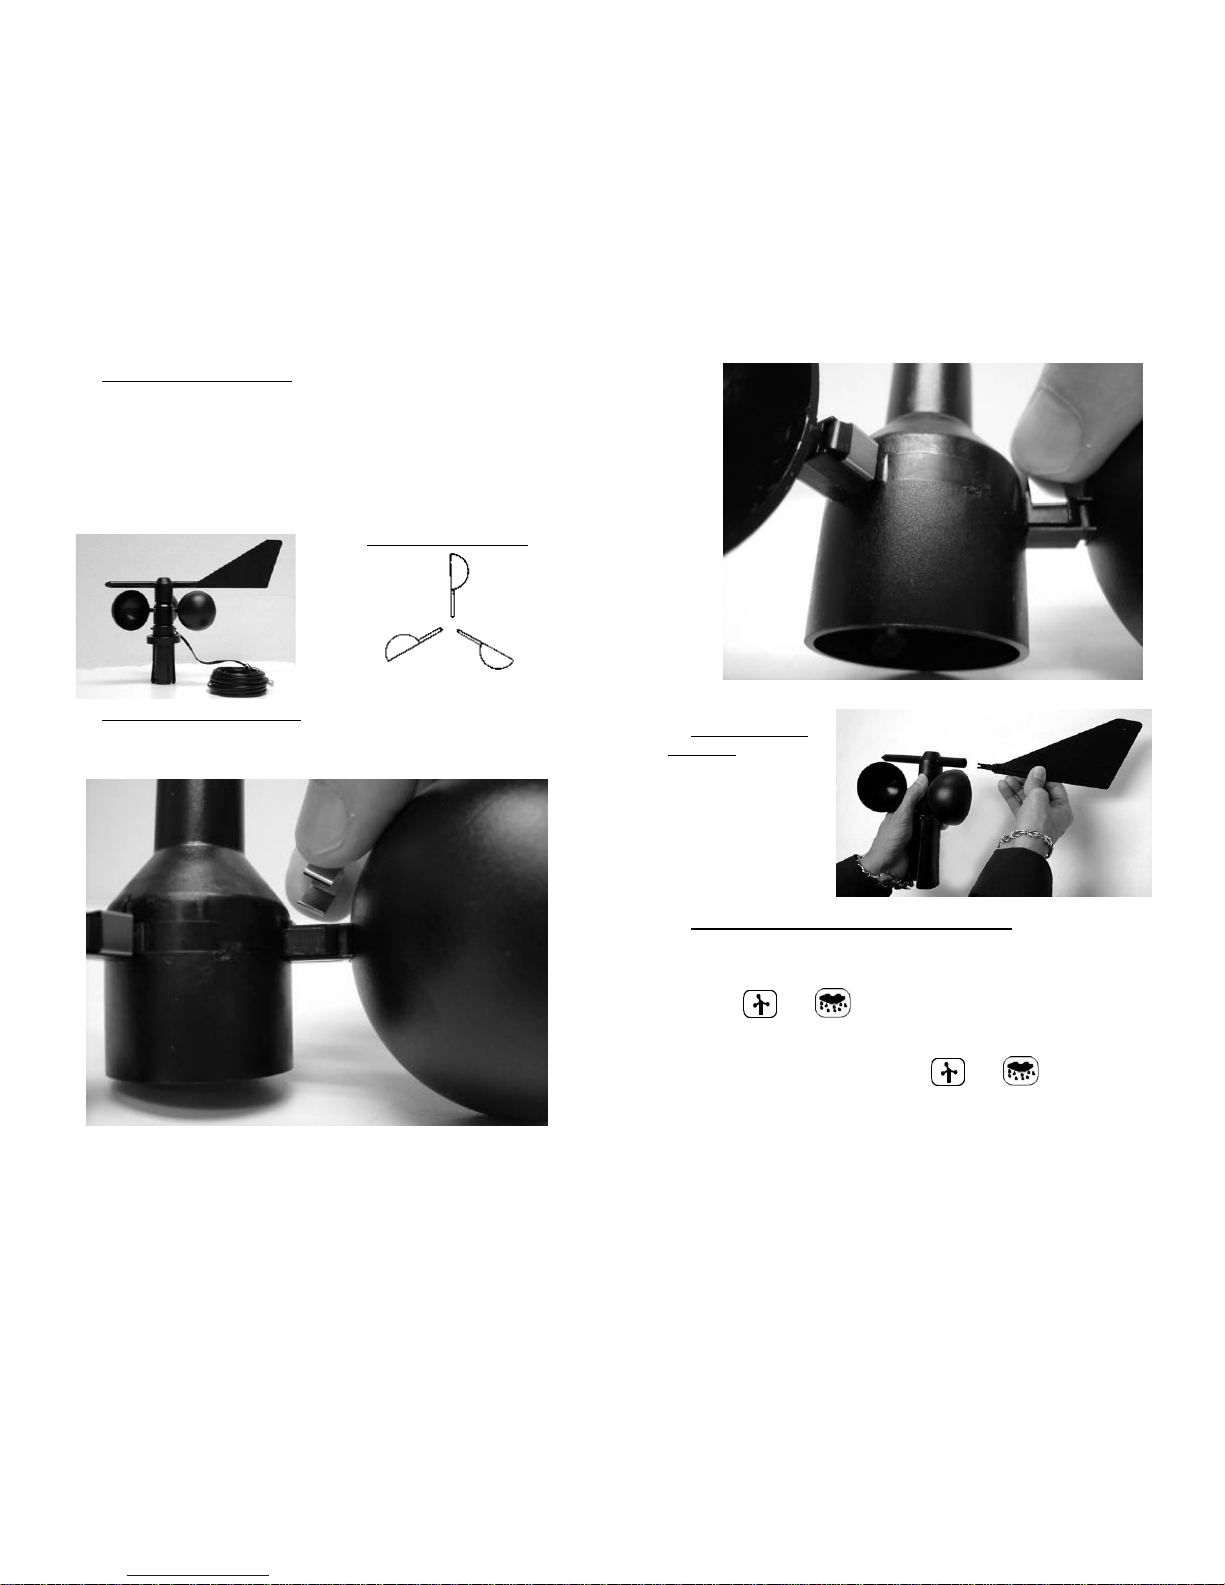
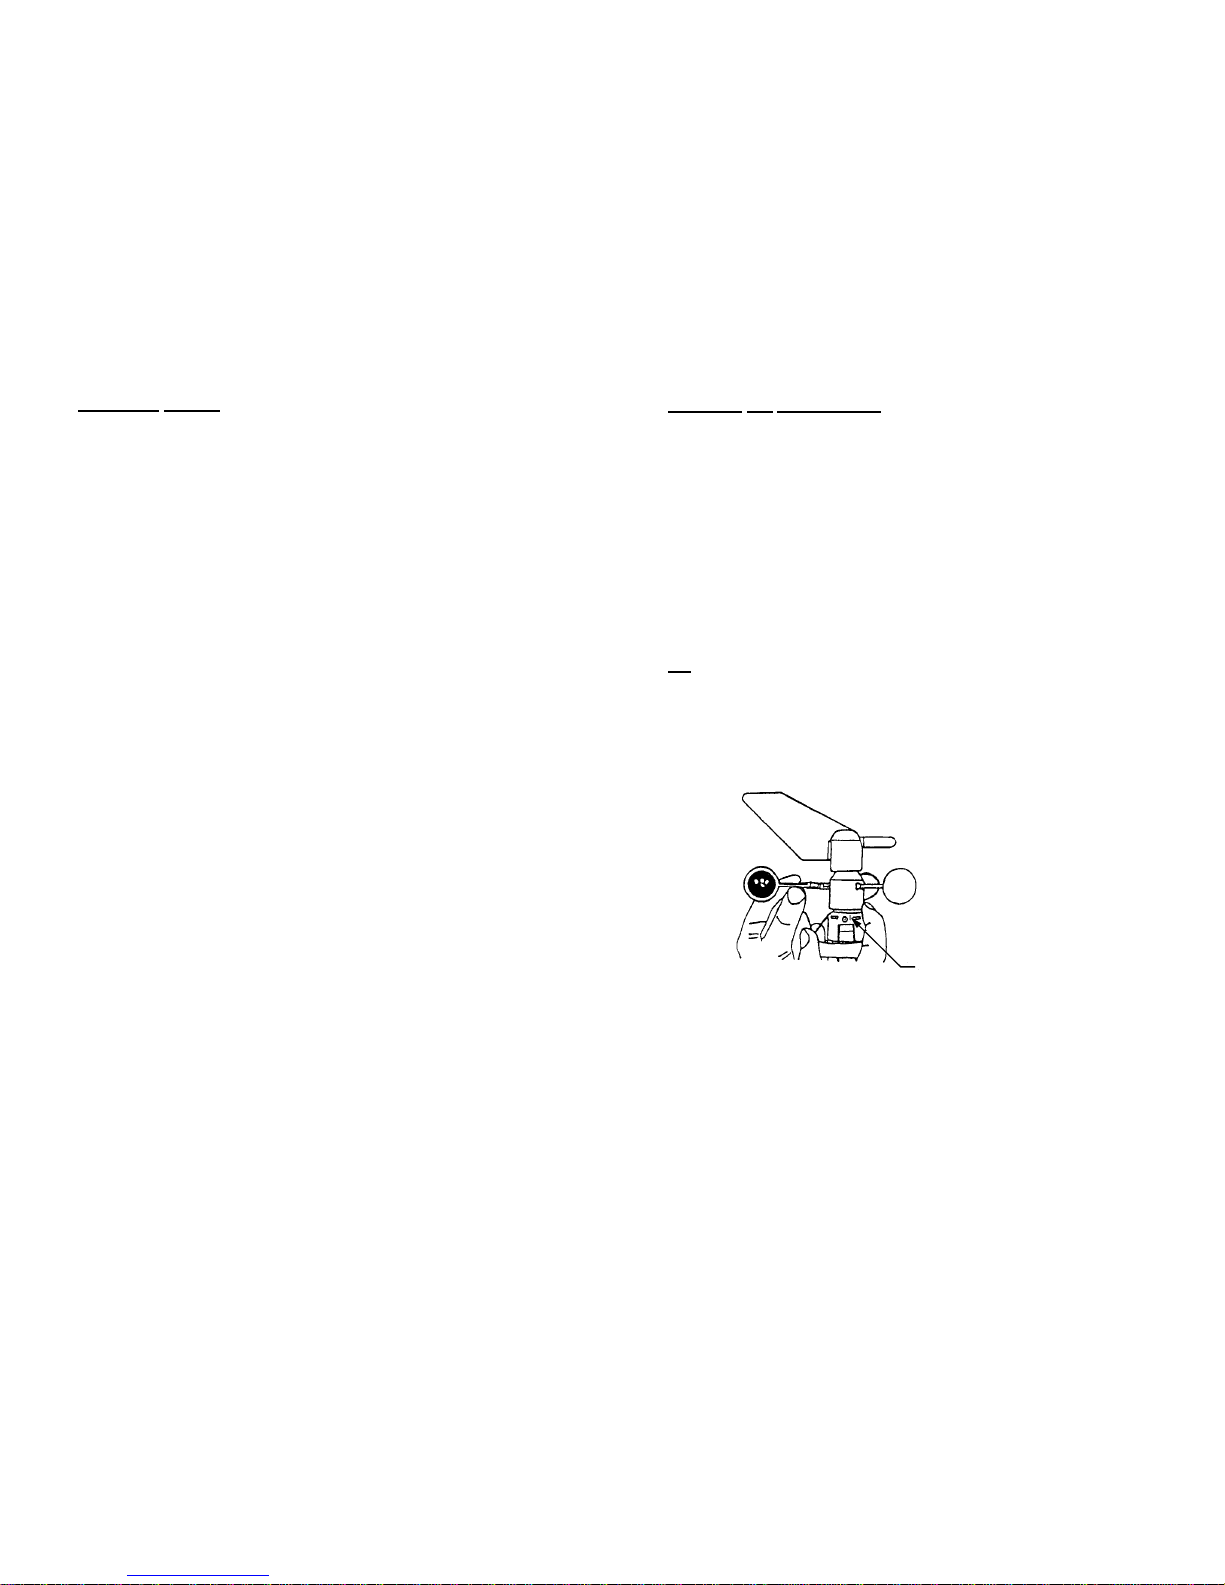
Anemometer/Wind Vane Location - The anemometer/wind vane is
designed to clamp to the top 3.5 inches of a mast having a having a
diameter of at least 1 in. and not more than 1-1/4 in. A thin-wall steel
TV antenna mast is ideal (available at Home Depot, Radio Shack and
many other stores).
NOTE: DO NOT MOUNT THE WIND SENSOR DIRECTLY ON
TOP OF IRON PLUMBING PIPE OR EMT ELECTRICAL
CONDUIT. Pipes and conduit have relatively thick ferrous
(magnets will stick to them) walls, which can interfere with the
proper operation of the magnets in the anemometer/wind vane.
If you wish to use iron pipe or electrical conduit as a mast, simply
add a short section of PVC to the top and clamp the wind sensor
onto the PVC. There are many ways to do this, but two typical
methods are:
a. If you are using a 3/4 inch iron water pipe as a mast, screw a
PVC pipe adapter with a 6-inch piece of 3/4 inch Schedule 40
PVC pipe onto the top of your mast.
b. If you are using 1-inch EMT electrical conduit as a mast, just
press a 12-inch long piece of 3/4 inch Schedule 40 PVC pipe six
inches into the top of the conduit.
In either method, PVC should not be used for the entire mast
because the MAST MUST BE GROUNDED. In addition, PVC
pipe is not strong enough to be used as a mast without
reinforcement.
Considerations for locating the mast:
- use an existing TV or FM-type mast if you can.
- mast should extend at least 3 feet (more if possible) above the
highest part of your roof or other nearby obstruction. You may
be able to add an extension to an existing mast.
- the mast should, as nearly as possible, be exactly vertical.
- the top 3-1/2 in. of the mast must be free. Again, you may be able
to add a short extension to an existing mast.
- if you are installing a new mast, it will be most economical to locate
it within 40 ft. of the junction box, so you won't need an extension
cable.
- mast must not be mounted on, or directly next to, an active
chimney. Flue gasses are very corrosive.
CAUTION: MAKE SURE THE MAST YOU USE IS PROPERLY
GROUNDED. IF YOU HAVE ANY DOUBT, HAVE IT CHECKED BY
A QUALIFIED TV SERVICE PERSON.
18
Temperature Sensor Location
NOTE: Before drilling holes and permanently installing the
temperature sensor, you may wish to experiment with the
temperature sensor location to be sure of satisfactory
readings.
Generally speaking, you should locate the temperature sensor:
- in the shade where it can never receive direct sunlight
- protected from wind and rain
- where air can circulate freely around it (e.g. avoid closed
gable ends that can trap a pocket of warm air)
- away from incidental heat sources, such as roof circulation
vents
- not directly above radiated or reflected heat sources such as
cement patios or large picture windows
- so that the last three feet of cable (or more) are outside the
structure in the open air
- so that the cable, rather than the sensor itself, is secured by
the supplied mounting clamp
It is surprising how much these factors affect temperature
readings; we have seen errors of 4°to 6°caused by just one of
these factors.
Rain Gauge (Optional) Location
- in the open, away from overhanging trees
- well clear of the house or other structures that might block
blowing rain
- easily accessible for periodic inspection and cleaning
- DO NOT locate on high tower or inaccessible rooftop!
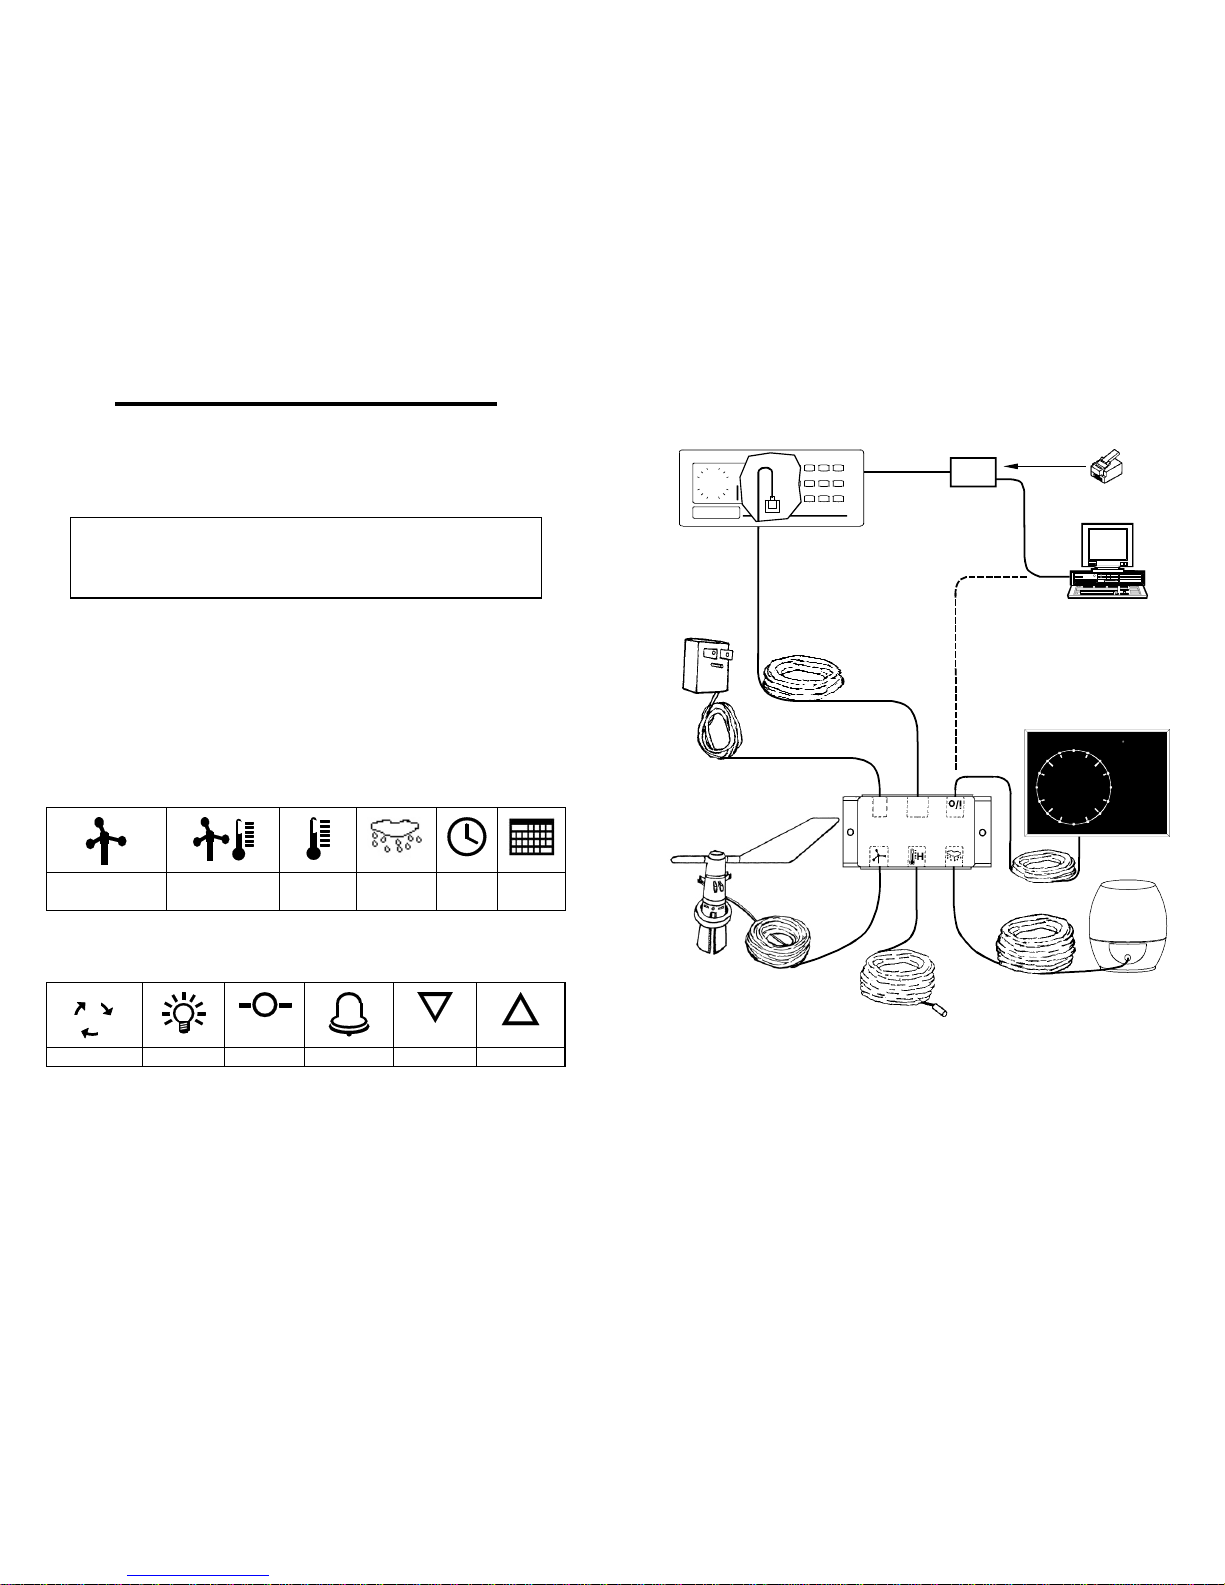
Junction Box Location
- must be indoors
- must be close to an ac outlet, so the ac adapter cord can
reach it
- a vertical orientation is preferable to minimize the possibility
of dust getting into the junction box
- consider connecting serial data peripherals such as a PC or
Weather Picture to the Junction Box’s “i/o” port
If you will not require extension cables (that is, if the external
sensors are each close enough to the control unit location) it is
usually best to locate the junction box within 8 feet of the
control unit.

19
Extension Cables
There is no problem extending the anemometer/wind vane cable or
optional rain gauge cable to 250 feet or more. Be sure the extension
cable used is correctly wired - if in doubt, proper 40' Extension Cables
may be obtained from Peet Brothers Company.
The Outdoor Temperature Sensor cable length should be kept as
short as practical, but extension up to 100 feet will not degrade
performance.
Normally it is best not to extend the total cable length from the
temperature sensor to the keyboard display unit any more than
necessary. Longer cables tend to decrease the temperature reading
slightly. For example, a total length of 265 feet (using six 40-foot
extension cables) can decrease temperature readings about 1.5°F.
This applies only to temperatures above about 60°F; measurements
of temperatures below 60°F are unaffected by long cable lengths.
Instead of extending more than one sensor cable, it may be possible
and more economical to place the junction box further from the
keyboard/display unit, using a 40' Junction Box Extension Cable.
NOTE: If you plan to use a sensor extension cable that will be joined
outside, you must waterproof the connection.
20
IV. INSTALLING YOUR ULTIMETER 100 COMPONENTS
Installing the Anemometer
1. Slide the locking ring up as far as it will go on the fingers.
2. Place the anemometer/wind vane over the top of the mast with
all four fingers on the outside of the mast.
3. Slide the clamping ring down over the fingers until you start to
feel significant resistance.
4. Find the North Calibration Mark on the anemometer (this is the
small silver line located near the screw head - see illustration
below). Rotate the anemometer on the mast until the calibration
mark is facing due north. Use a compass or other directional
reference.
Tip: Use a piece of tape to hold the wind vane pointed in the
direction of the silver mark, and use the wind vane pointer to help
to install the anemometer in the correct position. Rotate the
anemometer on the mast until the wind vane points North
(remember to remove tape!).
North Calibration Mark
5. Firmly clamp the anemometer in place by repeatedly pulling the
locking ring down, first a little on one side, then a little on the
opposite side, keeping it more or less level, until you can't pull it
down any further.
6. Using the cable ties provided, secure the cable to the mast.
One tie should be placed just about 2 in. below the
anemometer/wind vane. The other two should be evenly spaced
below that.

21
Installing the External Temperature Sensor
1. Drill a pilot hole at the desired location.
2. Mount the supplied clamp and temperature sensor taking care
that its protective metal housing does not touch any nearby
surface. The metal end should be pointed "up", with the cable
exiting downward, to discourage water droplets or ice from
"hanging on" to the metal housing.
Installing the Keyboard/Display Unit
Desk or Shelf Mounting
1. Assemble the desktop stand as shown below.
2. Place the keyboard/display unit on the stand so the two
alignment pins on the stand fit firmly into the matching holes on
the back of the instrument.
3. Secure the Keyboard/display unit to the stand, using the two
screws provided.
4. Insert the plug of the junction box cable into the back of the
control panel. Be sure it "clicks" into place.
5. Position the assembled unit as desired.
Wall Mounting
1. Using the mounting bracket as a template, use a pencil to mark
two holes 3.75 in. apart for the wood screws or drywall anchors
provided. Mount at a height slightly above eye level for best
viewing angle.
2. Install the mounting bracket using the two screws provided. Do
not overtighten.
22
3. Insert the plug of the junction box cable into the back of the
control panel. Be sure it "clicks" into place.
4. If the junction box cable is to run down the wall, insert the cable
into the groove provided on the back of the keyboard/display unit.
5. Hang the keyboard/display unit from the two projecting nubs on
the mounting bracket.
Installing the Junction Box
1. Drill two pilot holes 3-1/2 in. apart at the desired mounting
location.
2. Mount the junction box; use wood screws (provided) for a
wooden wall or drywall anchors (provided) for a sheet rock
wall.
3. Plug in cables from the ac adapter, keyboard display unit,
thermometer, anemometer/wind vane, and rain gauge, also
PC or Weather Picture if applicable.

23
V. CONNECTING THE ULTIMETER 100 SYSTEM
Connect components to configure your system as shown in
the Wiring Diagram.
Notes concerning Unimounts: If your system includes a
Unimount Sensor Array (optional), please refer to the wiring
diagram provided with the Unimount. Also, in Unimount
systems, The Weather Picture®MUST be connected to the
serial data port of the ULTIMETER 100 keyboard using an
adapter cable, and cannot be connected to the junction box.
Using the following sequence, apply power to your system:
1. Plug one end of the 8-conductor cable into the junction
box. Plug the other end into the back of the instrument.
2. Connect the AC adapter into an AC outlet. In 110 volt
systems, be sure to use the 3-prong AC adapter and a
properly grounded 3-prong outlet. Then, plug the AC adapter
output cable into the junction box. Allow 2 or 3 seconds for
the keyboard display to come on.
3. Install a fresh 9 volt back-up battery (not included) at this
time, in order to preserve any settings or adjustments that you
make while installing the system.
The back-up battery compartment is located on the lower right
side of the keyboard/display unit. To open the compartment,
slide the cover in direction of arrow. Insert a 9-volt battery,
with the +and -terminals oriented as shown in the diagram
on the back of the keyboard housing. Replace the cover.
4. Press and simultaneously to initiate the battery
check function. In a few seconds, the flashing battery symbol
should go out.
About the Battery Symbol in the Display
In operation, a flashing battery symbol indicates a weak battery in
need of replacement. Your keyboard automatically performs a
battery check daily. To perform a battery check manually, press
and simultaneously to initiate the battery check function.
In a few seconds, the flashing battery symbol should go out. If it
does not, the battery should be replaced.
24
WIRING DIAGRAM
Connect components to Junction Box as shown in diagram below.
WEATHER BASE 10
West M arine
W
N
S
E
ULTIMETER 100
ULTIMETER
PC Data Logger
(Optional)
Junction Box Cable
AC Adapter
Junction Box
Wind Sensor
Temperature Sensor
Rain Gauge (Optional)
Indoor Temperature Sensor
(Optional)
R
THE WEATHER PICTURE
PEET BROS.
W
S
E
N
2 4
WIND CHILL
HI WIND TODAY
WIND SPEED
HI TEMP TODAY
TEMPERATURE
LO TEMP TODA Y
RAIN TOD AY
9
6 4
7 6
7 0
5 4
0 0.2 8
The Weather Picture
(Optional)
OR
ULTIMETER 100
Keyboard Display
Connection of both The Weather Picture
AND a PC Data Logger to the i/oport
requires a Duplex Cable.
*
*
Duplex Cable
(Optional)
NOTE: The Weather Picture®requires a 12v/1000mA AC Adapter be
used in place of the 12v/400mA AC Adapter supplied with the
ULTIMETER 100.
Also, BEFORE YOU INSTALL PLUGS IN RECEPTACLES, be
sure to check connectors as shown on p. 13.

25
VI. INITIAL SETTINGS
SET THE YEAR
This instrument features a perpetual calendar, using a leap year counter
to keep track of each leap year. For it to operate correctly, you must set
the current year before you set the day and month.
1. Press and release and simultaneously. The clock and
calendar symbols will appear on the screen and the instrument will
display the year setting (default is 2009).
2. Press and KEEP IT PRESSED until the year begins to
change. Then press or as required until the display
shows the current year.
SET DATE AND DATE FORMAT
1. Press and release . The date will be displayed in mm/DD
format. If this is satisfactory, you may skip to Step 3.
2. If you prefer a DD/MM date display, press and hold until the
display stops flashing (the display will flash three times, then
change to DD/mm format). To change back to MM/DD format,
repeat the procedure.
3. Press and hold the for at least three seconds. The date
display will flash three times, then enter a setting mode and the date
will begin to change. Press or as required to set the
correct date. If you press and hold or , the display will
change rapidly.
4. When you have finished setting the date, press to return to
normal operation.
RESET LONG-TERM MEMORIES
Press and hold and simultaneously for at least three
seconds. The display will flash three times, then stop. All Long
NOTE: It's best to set the Year BEFORE you set the date. If you
have already set the date, check it after setting the year, and adjust
the date display as necessary.
NOTE TO SERIAL PORT USERS: It is essential to make the
correct Year setting; otherwise, date data from the serial port may
be incorrect.
26
Term high and low values will be replaced by the current values, the
Long Term rainfall total will be reset to zero, and the rainfall "since"
date will be reset to the current date.
You may wish to use this "master reset" procedure on the first day
of each new month. All Long Term high and low values will then be
the highest and lowest values, and also the total rainfall, for the
month to date.
SET TIME AND TIME FORMAT
1. Press the key.
2. If you prefer a 24-hour clock display, press again and hold
until the display stops flashing (the display will flash three times,
then change to 24-hr format). To change back to 12-hr format,
repeat this procedure.
3. Press and hold for at least 3 seconds. The time display will
flash three times, then enter a setting mode and the time will begin
to change. Press or as required to set the correct time. If
you press and hold or , the display will change rapidly.
4. Press to return to normal operation.
SELECT TEMPERATURE UNITS
Temperature is initially displayed in degrees Fahrenheit. Use the
following procedure if you prefer degrees Celsius.
1. Press and release the key.
2. Press again and hold until the display stops flashing.
Temperature will be displayed in Celsius. To return to Fahrenheit,
repeat this step.
NOTE: Units for wind chill , dew point d.p. , and heat index
will be the same as for temperature.
SELECT WIND SPEED UNITS
Wind Speed is displayed initially in mph. You may select m/s,
knots, or km/h as preferred.
1. Press and release the key to display current wind speed.
2. Press again and hold until the display stops flashing. Wind
speed will be displayed in m/s.
3. Repeat this procedure to select knots or km/h.

27
SELECT RAIN GAUGE INCREMENTS AND RAINFALL UNITS
If your ULTIMETER system does not yet include a self-emptying rain
gauge, you may skip this section and proceed to "DISPLAYING
CURRENT DATA".
Use the procedure below to tell the instrument the measuring increment
of your rain gauge. Allowable rainfall increments are: 0.01 inches, 0.25
mm, 0.1 inches, 0.1 mm, and 2.5 mm.
1. Press and release the key. The rain icon and "0.00 in" will
appear in the display. Each time your rain gauge reports an
increment of rain, the rain display will increase by 0.01 inches. If
your rain gauge reports rainfall in increments of 0.01 inches, skip
the rest of this section.
2. Press and hold the key a second time until the display
stops flashing. "0.00 mm" will appear in the display. Each time
your rain gauge reports an increment of rain, the rain display will
increase by 0.25 mm. If your rain gauge reports rainfall in
increments of 0.25 mm, skip the rest of this section.
3. Press and hold the key a third time until the display stops
flashing. "0.0 in" will appear in the display. Each time your rain
gauge reports an increment of rain, the rain display will increase by
0.1 inches. If your rain gauge reports rainfall in increments of 0.1
inches, skip the rest of this section.
4. Press and hold the key a fourth time until the display stops
flashing. "0.0 mm" will appear in the display, with the "mm" flashing.
Each time your rain gauge reports an increment of rain, the rain
display will increase by 0.1 mm. If your rain gauge reports rainfall in
increments of 0.1 mm, skip the rest of this section.
Note to Serial Data Port Users: when you select 0.1mm
increments, the serial data output will report rain totals in metric
rather than English units.
5. Press and hold the key a fifth time until the display stops
flashing. "0.0 mm" will appear in the display, with the "mm" not
flashing. Each time your rain gauge reports an increment of rain,
the rain display will increase by 2.5 mm. If your rain gauge reports
rainfall in increments of 2.5 mm, this is the correct setting.
INITIALIZE THE LONG-TERM RAINFALL TOTAL
Press and release the key. Then press and release the
key eight times to display the long-term rainfall. Press and hold
28
for at least three seconds. The display will flash three times,
then stop. The Long Term rainfall total will be reset to today's
rainfall, and the rainfall "since" date will be reset to the current date.
Or, to reset ALL long-term memories (including rainfall), press and
hold and simultaneously for at least three seconds. The
display will flash three times, then stop. All Long Term high and low
values will be replaced by the current values, the Long Term rainfall
total will be reset to today's rainfall, and the rainfall "since" date will
be reset to the current date. You may wish to use this "master
reset" procedure on the first day of each new month.

29
TO ADJUST THE LONG-TERM RAINFALL TOTAL
If you wish to include rainfall accumulated prior to installation of your
ULTIMETER 100, you must adjust the long-term rainfall memory to
display the accumulated total rainfall, and also adjust the rainfall
"since" date to reflect the earlier beginning of your rainfall record. If
the "since" date on your weather station is already correct, then
perform only Step 3. Otherwise, perform all four steps.
Step 1: Adjust the rainfall "since" date as follows:
a) Enter the year of the "since" date, by pressing and releasing
and simultaneously. The instrument will display the
year setting (default is 2009). Press and KEEP IT
PRESSED until the year begins to change. Then press or
as required until the display shows the correct year of the
rainfall "since" date.
b) Enter the day and month of the "since" date, as follows:
press and release to display date. Press and hold for
at least three seconds. The date display will flash three times,
then enter a setting mode and the date will begin to change.
Press or as required to set the correct date. If you
press and hold or , the display will change rapidly.
Step 2: Reset the Long-Term Rain total and "Since" date as follows:
Press and release the key. Then press and release the
key eight times to display the long-term rainfall. Press and
hold for at least three seconds. The display will flash three
times, then stop. The long-term rainfall total will be reset to
today's rainfall, and the rainfall "since" date will be reset to the
date you input in step 1.
Step 3: Enter the desired Long-Term Rainfall total as follows:
1. Press and hold and simultaneously for at least
three seconds until the displayed long-term rainfall total begins
to change.
2. Then press or repeatedly until the desired rainfall
total is displayed (be sure to include today's rainfall in your long-
term total). Press to return to normal operation.
Step 4: Reset to the Current Date (enter current year, then current
day and month), by following the key sequences of Step 1.
30
VII. DISPLAYING CURRENT DATA
TO DISPLAY THE CURRENT VALUE OF WIND SPEED, WIND
CHILL, OUTDOOR TEMPERATURE, TIME, OR DATE:
Press and release the desired data key: , , ,
, or .The corresponding symbol will appear on the
screen and the current data value will be displayed. To
display current Wind Direction in Degrees, press twice
(you may press again to return to Wind Speed).
NOTE: When you press , the instrument will display the
outdoor temperature.
TO DISPLAY CURRENT WIND DIRECTION IN DEGREES°
The current wind direction in degrees (°) is displayed by
pressing the key twice (the first press displays the
current wind speed): N=0°, E=90°, S=180°, W=270°, etc.
Pressing the key again returns the display to the current
wind speed.
TO DISPLAY CURRENT INDOOR TEMPERATURE
1. Press and release to display outdoor temperature.
2. Next, press and release a second time to display
indoor temperature. The symbol will appear in the display
and the current indoor value will be shown.
Automatic Scanning
The instrument can continually scan any of the following data at 5-
second intervals:
Wind Speed Today's Rainfall
Wind Chill Time
Temperature (Indoor & Outdoor) Date
To select data to be scanned:
1. Press cb
aand keep it pressed until “SEL” (select) appears
in the display.
2. Press the data key of each function you wish to include in
the scan sequence.
3. Press cb
ato end the selection process and start the scan.
To exit scan mode, press any data key.
To resume scanning, press and release cb
a.

31
VIII. ULTIMETER 100 HIGH/LOW MEMORY SYSTEM
The ULTIMETER 100 keyboard monitors and displays current data from
five different sensors (plus calculated wind chill temperature). It also
maintains nine memory banks for high and low records. The instrument
will be most valuable to you if you understand the nine memory banks:
TODAY'S HIGHS, LOWS, AND RAINFALL
At midnight each night, the ULTIMETER 100 starts keeping track of
high and low values, and rainfall, for the new day. At any time
during the day, the instrument can tell you what the highest and
lowest values have been, thus far in the day (since midnight).
"TODAY'S" high and low values are automatically maintained, and
cannot be manually altered or reset. If you ever wish to record
highs and lows, or rainfall, starting from a specific time, you may
use the user-resettable "Long Term" high/low memory described
below.
PREVIOUS DAY'S HIGHS, LOWS, AND RAINFALL
Each midnight the instrument moves TODAY'S highs and lows and
rainfall into separate memory, now calling them PREVIOUS DAY'S
values. At any time in the current day, you can retrieve the high and
low values and rainfall for each of the previous seven days -
directly from the keyboard or remotely by phone, modem, or radio
link. PREVIOUS DAY'S values are automatically maintained, and
cannot be manually altered or reset. If you ever wish to record
highs and lows or rainfall starting from a specific time, you may use
the user-resettable "Long Term" high/low memory described below.
LONG TERM HIGHS AND LOWS
The long-term memory bank is extremely flexible. It keeps track of
highest and lowest readings, and accumulated rainfall, since the
last time you reset the stored value. You can individually reset any
high or low value in this memory whenever you wish. For example,
you may wish to keep close watch on a major storm by resetting the
LONG TERM highest wind speed memory, or the LONG TERM
rainfall total just before the storm hits, or even again during the
storm.
There is also a master reset that resets all of the LONG TERM
stored values simultaneously. If you wish to track monthly highs
and lows, just use the master reset at the beginning of each new
month.
32
IX. DISPLAYING STORED DATA
TO DISPLAY HIGHEST VALUES
To display the highest values of wind speed or temperature for today,
yesterday, and long term:
1. Press the desired data key to display the current value.
2. To display TODAY'S highest value (since midnight), press
once. The display will repeatedly cycle through today's date,
today's high value, and the time at which it occurred.
3. To display PREVIOUS DAY'S highest values (from midnight to
midnight), press again, repeatedly, to display the values for
each of the LAST SEVEN DAYS. After each press, the display will
repeatedly cycle through: the selected date, that day's high value,
and the time at which it occurred.
4. To display the LONG TERM highest value (since last RESET),
press a ninth time. The display will repeatedly cycle through:
the date on which the highest value occurred, the highest value
since last reset, and the time at which it occurred. The Long Term
high value is the highest value recorded since you last reset this
memory. The Long Term display is easily recognized by the
flashing when the date is displayed.
5. Pressing a tenth time returns the display to TODAY'S
highest value.
TO DISPLAY LOWEST VALUES
1. Press the desired data key to display the current value.
2. To display TODAY'S lowest value (since midnight), press
once. The display will repeatedly cycle through today's date,
today's low value, and the time at which it occurred.
3. To display PREVIOUS DAY'S lowest values (from midnight to
midnight), press again, repeatedly, to display the values for
each of the LAST SEVEN DAYS. After each press, the display will
repeatedly cycle through: the selected date, that day's low value,
and the time at which it occurred.
4. To display the LONG TERM lowest value (since last RESET),
press a ninth time. The display will repeatedly cycle through:
the date on which the lowest value occurred, the lowest value since
last reset, and the time at which it occurred. The Long Term low

33
value is the lowest value recorded since you last reset this memory.
The Long Term display is easily recognized by the flashing
when the date is displayed.
5. Pressing a ninth time returns the display to TODAY'S
lowest value.
TO DISPLAY RAINFALL
1. To display TODAY'S rainfall (thus far since midnight), press
. The instrument will display today's total rainfall.
2. To display PREVIOUS DAY'S rainfall (from midnight to midnight)
press , repeatedly, to display daily rainfall for each of the
LAST SEVEN DAYS. The display will alternate between the
selected date and that day's total rainfall.
3. To display the LONG-TERM ACCUMULATED rainfall (since you
last reset this value to zero), press an eighth time. The display
will alternate between the date you last reset this total and the
rainfall accumulation since that date.
4. Pressing a tenth time returns the display to TODAY'S
rainfall.
FCC STATEMENT ON CLASS B
This equipment has been tested and found to comply with the limits for a Class B digital
device, pursuant to Part 15 of the FCC rules. These limits are designed to provide
reasonable protection against harmful interference when the equipment is operated in a
residential installation. This equipment generates, uses, and can radiate radio frequency
energy and if not installed and used in accordance with the instruction manual nay cause
harmful interference to radio communications. However, there is no guarantee that
interference will not occur in a particular installation. If this equipment does cause harmful
interference to radio or television reception, which can be determined by turning the
equipment off and on, the user is encouraged to try to correct the interference by one or
more of the following measures:
•Reorient or relocate the receiving antenna.
•Increase the separation between the equipment and the receiver.
•Connect the equipment into an outlet on a circuit different from that to which the
receiver is connected.
•Consult the dealer or an experienced radio TV technician for help.
Notice: The changes or modification not expressly approved by the party responsible for
compliance could void the user's authority to operate the equipment.
34
X. RESETTING LONG TERM MEMORY VALUES
TO RESET A SINGLE LONG TERM HIGH OR LOW MEMORY
NOTE: Only Long Term memory values can be reset; you
cannot clear Today's or Previous Day's values. These are
automatically reset (updated) by the instrument.
1. First, display the stored Long Term data you wish to clear.
2. Press and hold the key for at least three seconds.
The display will flash three times, then change to a display of
the current value, the current time, and today's date.
TO RESET ALL LONG TERM HIGH, LOW, & RAIN MEMORIES
Instead of resetting each Long Term high and low memory
individually, you may simultaneously reset all Long Term
highs and lows, including the Long Term rainfall total. To do
so:
Press and hold and simultaneously for at least
three seconds. The display will flash three times, then stop.
All Long Term high and low values will be replaced by the
current values, and the Long Term rainfall total will be reset to
zero.
You may wish to use this "master reset" procedure on the first
day of each new month. All Long Term high and low values
will then be the highest and lowest values for the month to
date.
TIP: If you always use only the master reset (as opposed to
individual resets), the date shown on the Long Term rainfall
display will be the date when all highs and lows were last
reset.

35
XI. ALARMS
The ULTIMETER 100 includes the following 15 adjustable alarms:
High Wind Speed, High Outdoor Temperature, Low Outdoor
Temperature, High Indoor Temperature, Low Indoor Temperature,
Low Wind Chill Temperature, Rain Rate Alarm, and Time Alarm.
When an alarm setting is exceeded, the display flashes the alarm
setting and a high-pitched alarm will sound. The sound will stop
automatically after about 30 seconds, but the display will continue
flashing until reset.
TO SET AN ALARM (other than Flash Flood Alert)
1. Select the function for which you wish to set an alarm by
pressing ,, , or . If you are setting an
alarm for wind speed, wind chill, or time, skip to step (3).
2. This instrument has both a high and a low alarm for
temperature. Press to set a high alarm or to set a
low alarm.
3. Press and release to display the current alarm value.
4. Press and hold or until the display changes, then
press repeatedly until desired alarm setting is displayed.
THE RAIN RATE ALARM
This instrument provides a rain rate alarm, intended for use
where there is danger of local flooding or downstream flash
flooding. Flash flooding can result when heavy rainfall occurs
at higher elevation, and water rushes toward low-lying areas.
The rain rate alarm warns that heavy rainfall has occurred,
which could result in impending local flood conditions, or flash
flooding within your vicinity (or possibly downstream, outside
of your vicinity). Bear in mind that your success in predicting
flash flooding depends upon many factors, in addition to rain
rate: terrain, elevation, drainage, etc.
Before setting the rain rate alarm, be sure to select rainfall
units according to the type of rain gauge you are using.
The rain rate alarm is set in inches-of-rain or mm-of-rain per
hour. An alarm will sound of a specified minimum amount of
rain (called the threshold) falls at a rate equal to or greater
than the rain-rate setting. The default threshold value is 0.5
in, or 12.7 mm.
36
EXAMPLE: If you set an alarm for a rain rate of 2 inches per
hour, the alarm will sound if 0.5 inches of rain (the default
threshold value) falls within 15 minutes, which equals an
hourly rate of 2 inches per hour.
To adjust the Rain Rate Alarm rain rate:
1. Press and release .
2. Press . The rain, clock, and alarm symbols will
appear in the display, and the present rain rate alarm setting
will be displayed.
3. Press and hold or until a value is shown and
begins to change. The rain rate can be adjusted from 0.1
in/hr to 10 in/hr in 0.1-in increments, or from 2.5 mm/hr to
254.0 mm/hr in increments of 2.5 mm/hr.
4. Press or repeatedly until the desired rain rate
setting is shown.
To adjust the Rain Rate Alarm threshold value:
1. Press and simultaneously. The rainfall and
alarm symbols will appear in the display, and the present
threshold value will be shown.
2. Press and hold or until the threshold value
begins to change. The threshold value can be adjusted from
0.1 inch to 0.5 inch in 0.1-inch increments, or from 2.5 mm to
12.5 mm in increments of 2.5 mm.
3. Press or repeatedly until the desired threshold
value is shown.
TO MOMENTARILY STOP AN ALARM FROM SOUNDING
With the alarm setting displayed, press the key. The
alarm sound will stop temporarily. When you return to normal
operation (displaying data), the alarm will sound again when
the current value exceeds the alarm setting.
TO DISABLE AN ALARM
First, display the alarm setting. If the alarm has been
triggered, the alarm setting will already be displayed.
Then, press and hold the key for at least three seconds.
The display will flash three times, then read "OFF".

37
XII. THE ULTIMETER 100 SERIAL PORT
The ULTIMETER 100 provides a unique 7-mode serial port to facilitate
computer data logging and remote data reporting via telephone, modem,
or RF link. Each of the four modes can be accessed by pressing and
holding a combination of two keys, or by command into the serial port.
The following is a brief description, to provide an idea of the capabilities
of each mode. The serial port is located in the Junction Box (receptacle
"i/o") and also the right-side receptacle of the keyboard/display.
Complete details are available to programmers upon request or at
www.peetbros.com.
WEATHERTEXT OUTPUT MODE
In WeatherText Output Mode, the instrument puts out one human-
readable (text) Weather Report each minute. The serial text output
is viewed on the monitor of a PC using terminal software such as
HyperTerminal (located on your WIndows PC at
Start/Programs/Accessories/Communications/HyperTerminal), or
using WeatherText™Tools software from Peet Bros. The text
output may be "captured" and saved as a .txt file for later viewing or
printout. Communications settings are 2400/8/N/1 (contact Peet
Bros. Tech Support for further assistance). Each "WeatherText
Report" includes all current values, plus the highest wind speed
over the past minute with the associated wind direction, the average
wind speed over the last minute, today's and long-term rainfall,
today's highs and lows, and current time and date. Key Combo:
Press and hold and for 3 seconds to enter this mode. In
addition, each time this key combo is pressed, a comprehensive
"Complete History Report" is output (contains highs and lows for the
previous 7 days plus long-term). Following is a sample
WeatherText Report:
ULTIMETER WEATHER REPORT 01/17/05 09:32A
Wind: Cur 11.4MPH 180Deg, 1mAvg 0.0MPH, 1mPeak 16.3MPH 166Deg
Hi 19.1MPH 176Deg
WChill: Cur 75.7F, Lo 45.6F
Temp Out: Cur 75.7F, Hi 75.7F, Lo 55.6F
Temp In: Cur 76.4F, Hi 72.6F, Lo 72.3F
Hum Out: Cur 65.6%, Hi 85.9%, Lo 65.6%
Baro: Cur 29.93inHg, Hi 30.14inHg, Lo 29.93inHg, 3hr chg -0.09inHg
Dewpt: Cur 63.6F
Heatx: Cur 77.0F
Rain: Today 0.12in, Since 01/01/05: 0.34in
WeatherText™Tools software also generates an APRS data string for
ham radio transmission (ref. WeatherText™Tools “Help” for more info).
COMPLETE RECORD MODE
Recommended for use with The Weather Picture®
In Complete Record Mode, the instrument puts out a steady stream
of records, about thirty per minute. Each record includes all current
values, today's high and low values, yesterday's high and low
values, and long term high and low values, station calibration
38
numbers, and current time and date. Key Combo: Press and hold
and for 3 seconds to enter.
DATA LOGGER MODE
In Data Logger Mode, the instrument puts out a steady stream of
records, about two per second. Each record includes all current
readings including time and date. Key Combo: Press and hold
and for 3 seconds to enter this mode.
PACKET MODE
In Packet Mode, the instrument puts out one record every five
minutes. Each record includes all current values, plus the highest
wind speed over the past five minutes with the associated wind
direction, station calibration numbers, and current time and date.
Key Combo: Press and hold and for 3 seconds to enter
this mode.
COMPLETE HISTORY MODE
In Complete History Mode, the instrument puts out a steady stream
of records, about twelve per minute. Each record includes all
current values, today's high and low values, seven previous day's
high and low values, long term high and low values, station
calibration numbers, current time, date, and year. Key Combo:
Press and hold and cb
afor 3 seconds to enter this mode.
MULTIPLE OUTPUT MODE
Recommended for use with The Weather Picture®
In Multiple Output Mode, the instrument puts out a stream of
consecutive records, alternating between each of the four output
modes described above. WeatherText Mode, Complete Record
Mode, Complete History Mode, and Data Logger Mode records are
output continuously; in addition, a Packet Mode record is output
every five minutes. This mode enables multiple serial data output
applications requiring different output modes. Key Combo: Press
and hold and for 3 seconds to enter this mode.
MODEM MODE
In Modem Mode, the serial port is kept in a receive mode with no
data output. It will accept commands to send a Complete Record,
set time and date, set wind direction correction, set temperature
offsets, and reset all long term memory. Key Combo: Press and
hold and for 3 seconds to enter this mode.
NOTE TO SERIAL PORT USERS: It is essential to make the
correct Year setting (see Section VI); otherwise, date data from the
serial port may be incorrect.

39
XIII. Supplemental Wind Vane Calibration Adjustment
Your anemometer/wind vane has been factory-calibrated to
correctly indicate wind direction when installed per the instructions
on p. 17, and should not require recalibration. However, if you
wish to adjust wind direction readings after installation (to correct
a difference between display readings and actual wind direction)
without physically realigning the sensor, you may use the following
procedure.
1. Perform when you have a fairly steady breeze from
a known direction.
2. Press
and simultaneously to display the
wind vane correction constant (the keyboard
initially has a correction constant of zero).
3. Press and hold or to adjust the wind vane
correction constant. After approximately 3 seconds
the wind vane correction constant will start
changing. Increase the number if you want the
direction diamond on the display to move counter-
clockwise to match actual wind direction. Decrease
the number if you want the direction-indicating
diamond to move clockwise to match actual wind
direction.
4. Repeat Step 3 as necessary until the wind direction
is correctly displayed. Record the Wind Vane
Correction Constant below.
5. Press any function key to leave this operation and
retain the correction constant that is displayed.
NOTE: The correction constant is a number between 0 and 255.
Each digit represents approximately 1.4 angular degrees of
correction (360 ÷ 256) that is added to the uncorrected wind
direction.
Record your Wind Vane Correction Constant here_________
40
XIV. Supplemental Temperature Offset Adjustment
Your outdoor and indoor temperature sensors encorporate
precision aged thermistors, which have been factory-calibrated to
correctly indicate temperature when installed per the instructions
on p. 18, and cannot be recalibrated. However, if you wish to
adjust temperature readings after installation (to correct a
difference between display readings and actual temperature, due
to various mounting location factors) without physically relocating
the sensor, you may use the following procedure.
1. Perform when you have a desired outdoor or indoor
temperature value from a reliable standard in close
proximity.
2. Press and simultaneously to display the
previously-entered outdoor temperature offset (or
press , , and simultaneously to
display the previously-entered indoor temperature
offset). The keyboard initially has temperature
offsets of zero.
3. Press and hold and (or press and hold
, , and for indoor temp) to adjust the
temperature offset value. After approximately 3
seconds, the temperature offset value will start
changing. Press or repeatedly to adjust
the offset to equal the amount you wish to add or
subtract from the base temperature reading.
4. Record the Outdoor and Indoor Temperature Offset
values below, for future reference or re-input.
5. Press to return to displaying the outdoor
temperature and retain the offset value. Allow
about 15 seconds for the displayed reading to
reflect the offset.
NOTE: The temperature offset is number from -50°F through
50°F (-27°C and 28°C). The default on keyboard power-up is
zero. The offset must be re-input after power-down has occurred.
Record your Outdoor Temperature Offset here_________
Record your Indoor Temperature Offset here_________
Table of contents
Other Peet Bros Weather Station manuals