Yageo KEMET USEQGCK5000000 User manual

TO CO2 Gas Sensing Evaluation Kit (Analog) USEQGCK5000000
The above information is believed to be correct but does not purport to be all inclusive and must be used only as a guide.
© KEMET Electronics Corporation • KEMET Tower • One East Broward Boulevard
Fort Lauderdale, FL 33301 USA • 954-766-2800 • www.kemet.com 1
TO Pyroelectric Infrared
CO2Gas Sensing Evaluation Kit
USEQGCK5000000
User Guide
Rev. 4.3
MAR 2022

TO CO2 Gas Sensing Evaluation Kit (Analog) USEQGCK5000000
The above information is believed to be correct but does not purport to be all inclusive and must be used only as a guide.
© KEMET Electronics Corporation • KEMET Tower • One East Broward Boulevard
Fort Lauderdale, FL 33301 USA • 954-766-2800 • www.kemet.com 2
TABLE OF CONTENTS
1 INTRODUCTION ........................................................................................................... 3
2 GETTING STARTED ..................................................................................................... 3
2.1 Kit Contents............................................................................................................3
2.2 Minimum System Requirements .............................................................................3
3 INSTALLATION ............................................................................................................. 4
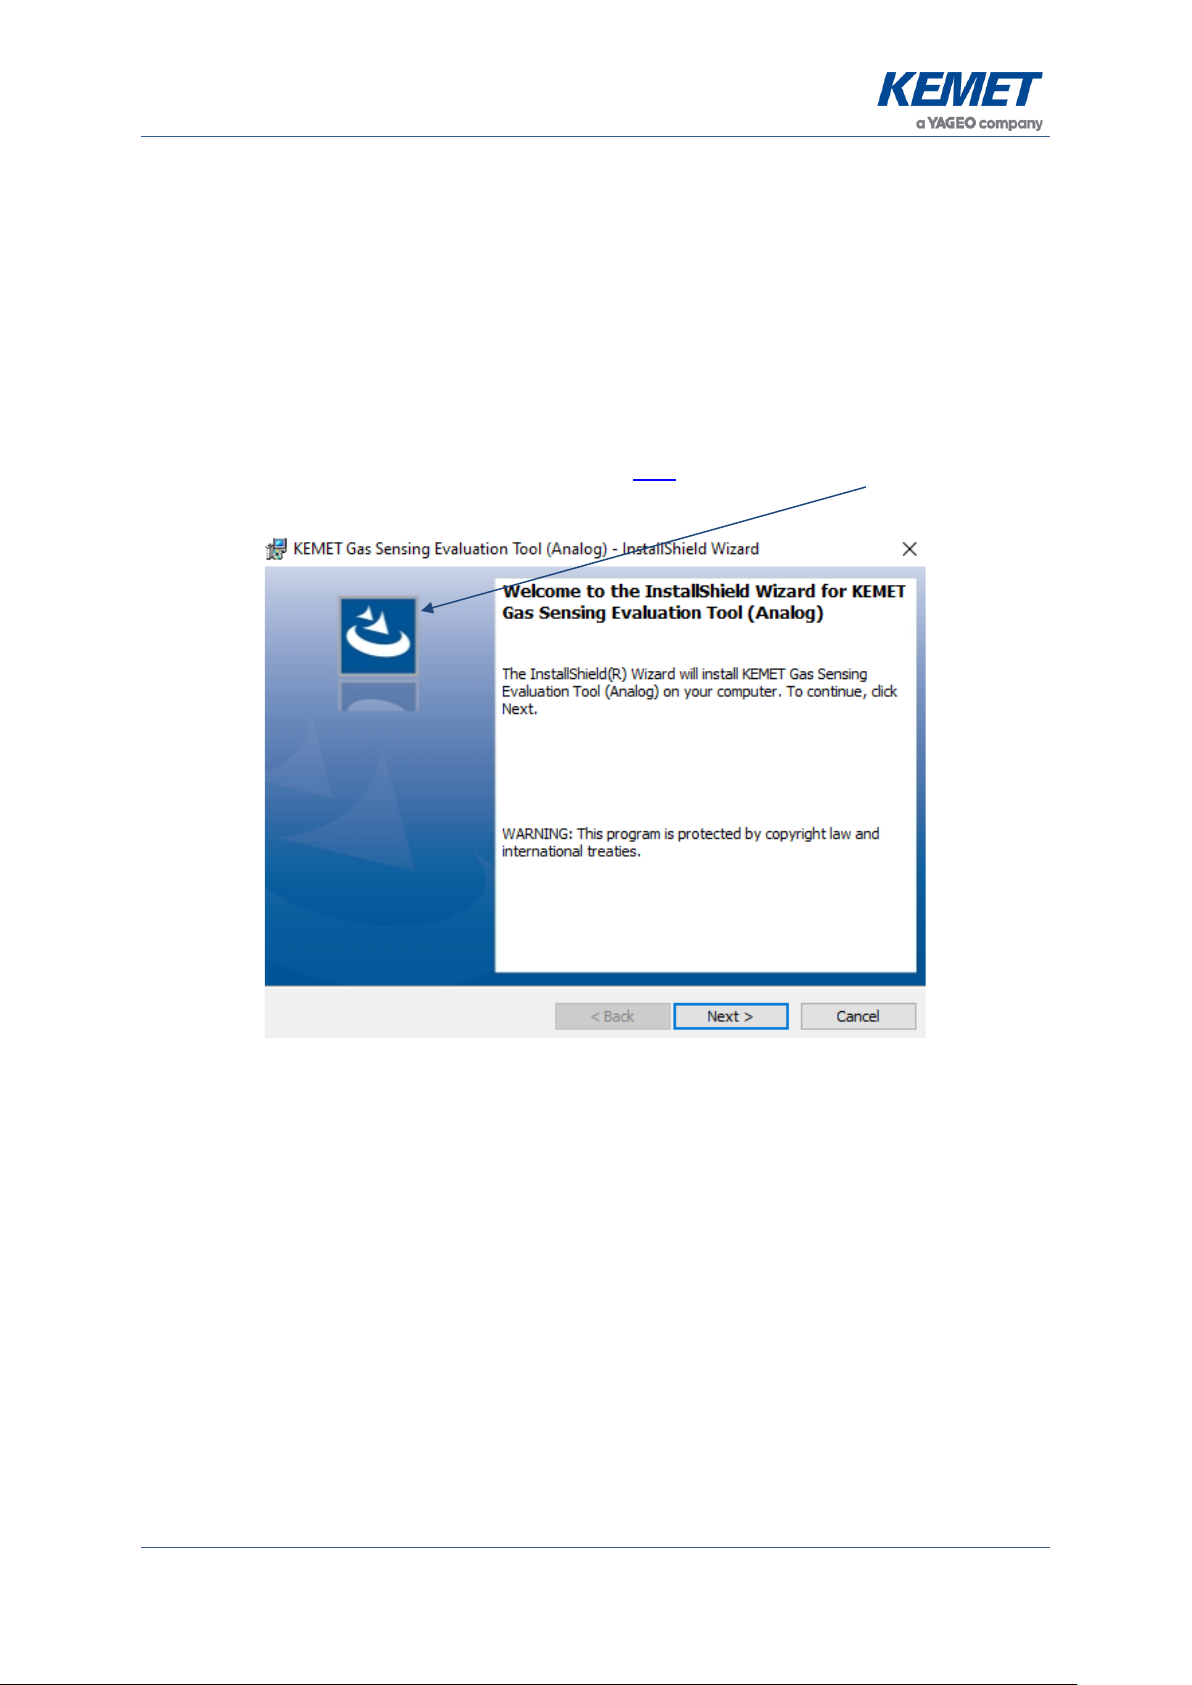
3.1 Installing the KEMET Gas Sensing Evaluation Tool Software.................................4
3.2 Connecting the TO Gas Sensing Evaluation Kit......................................................4
4 SOFTWARE USER GUIDE............................................................................................ 5
4.1 Starting the Software ..............................................................................................5
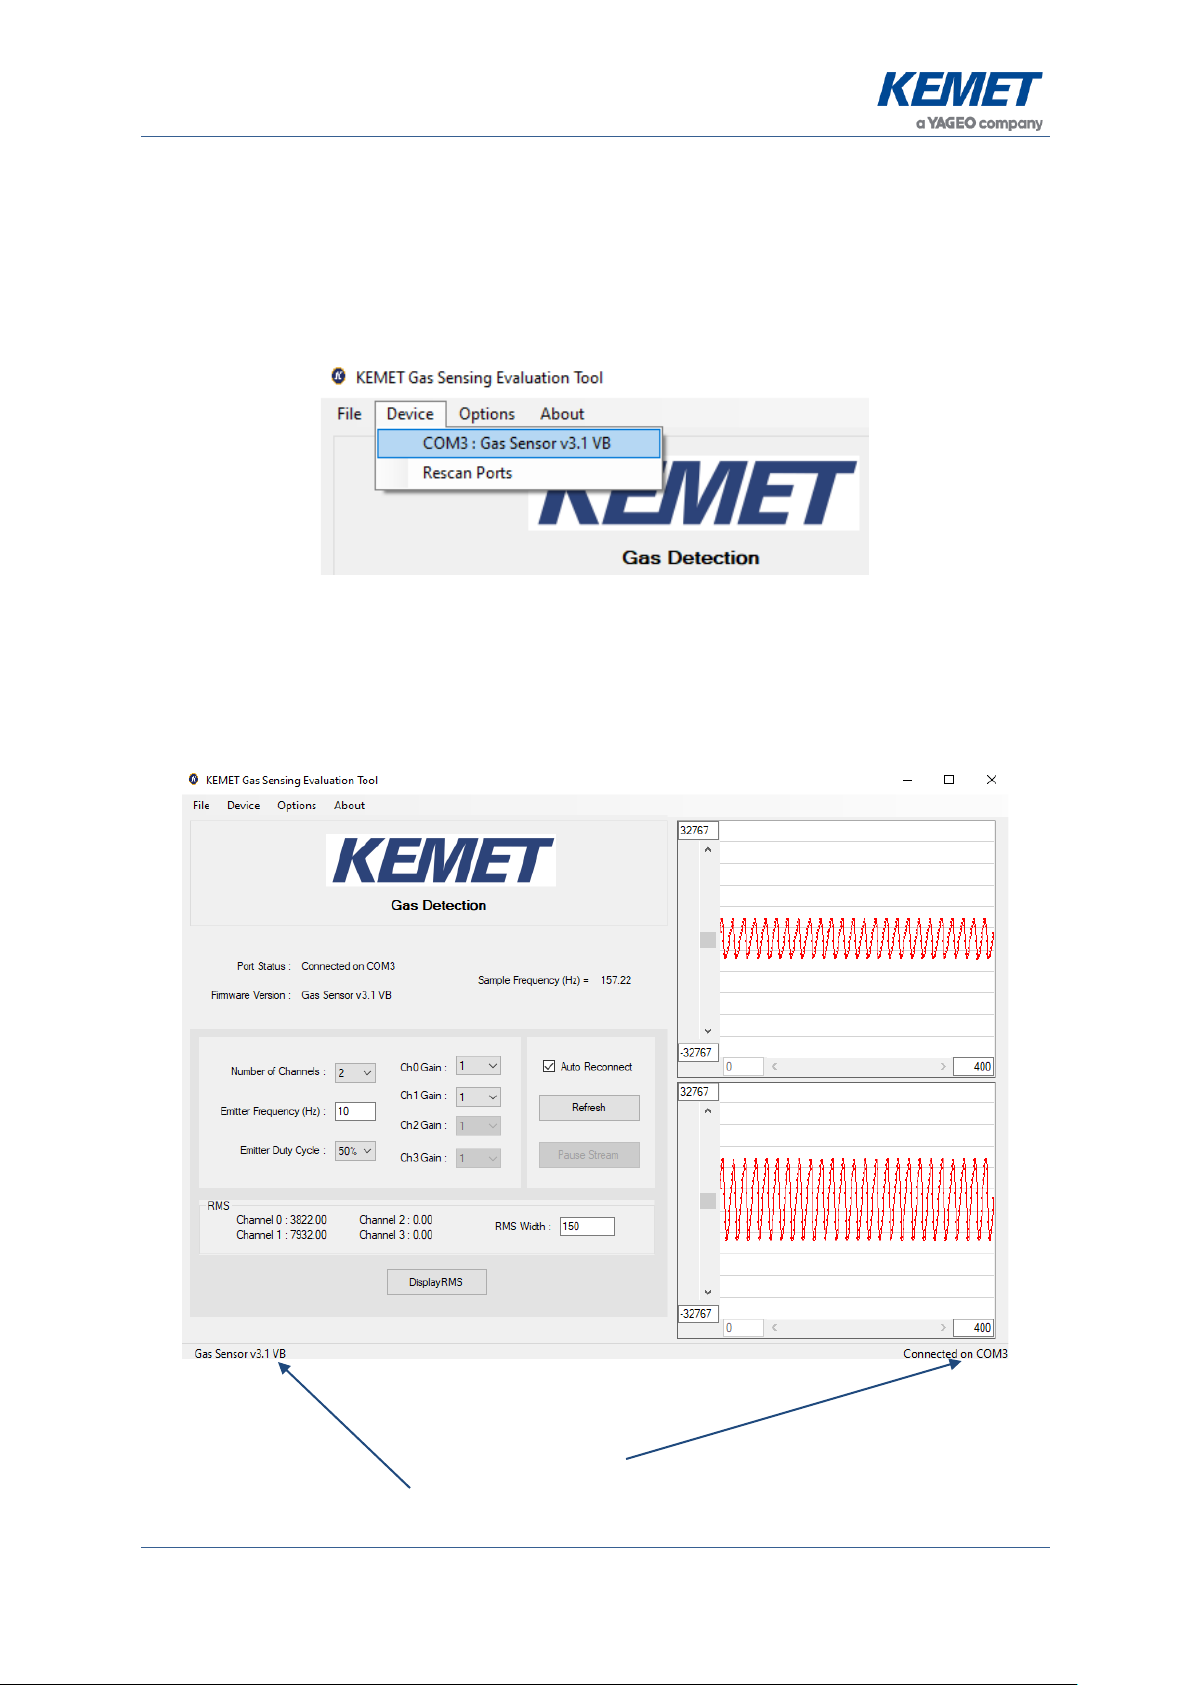
4.2 Connecting Software to the Data Capture Board ....................................................6
4.3 Data Capture Board Control....................................................................................7
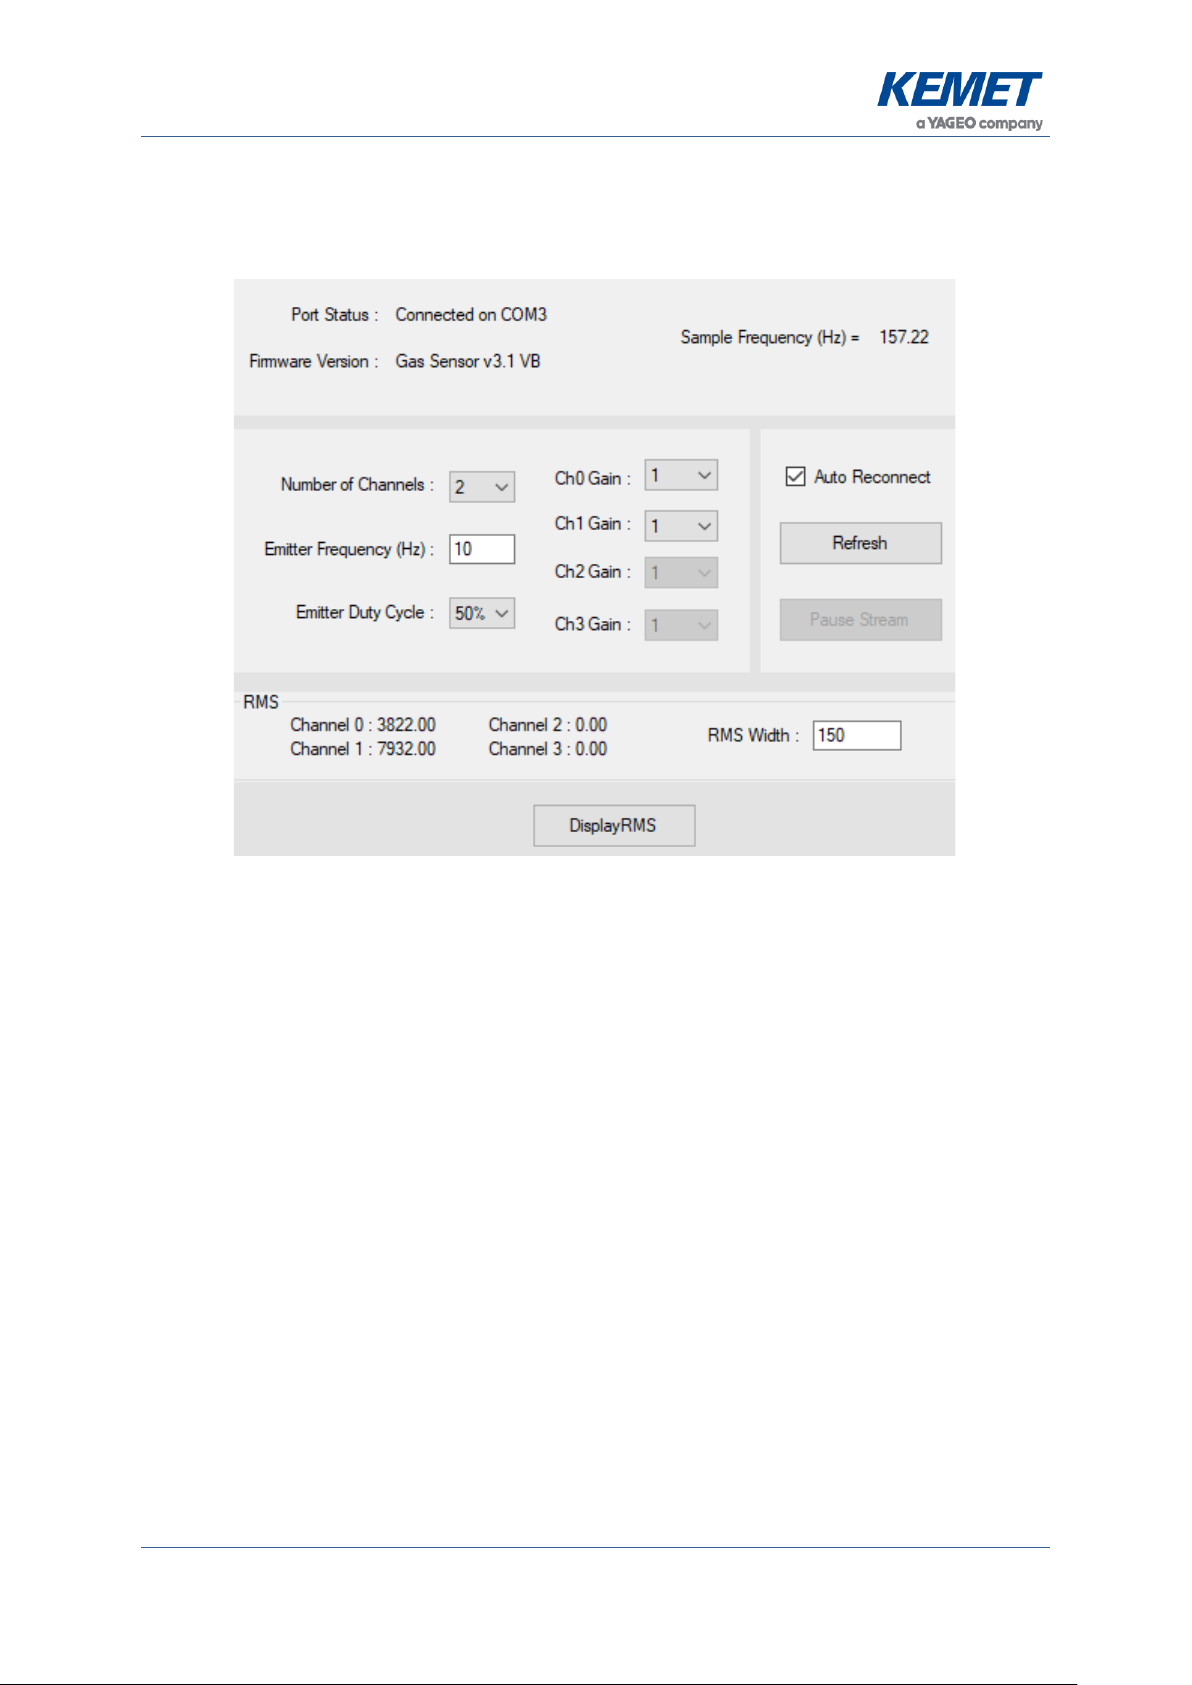
4.3.1 Data Capture Settings ................................................................................7
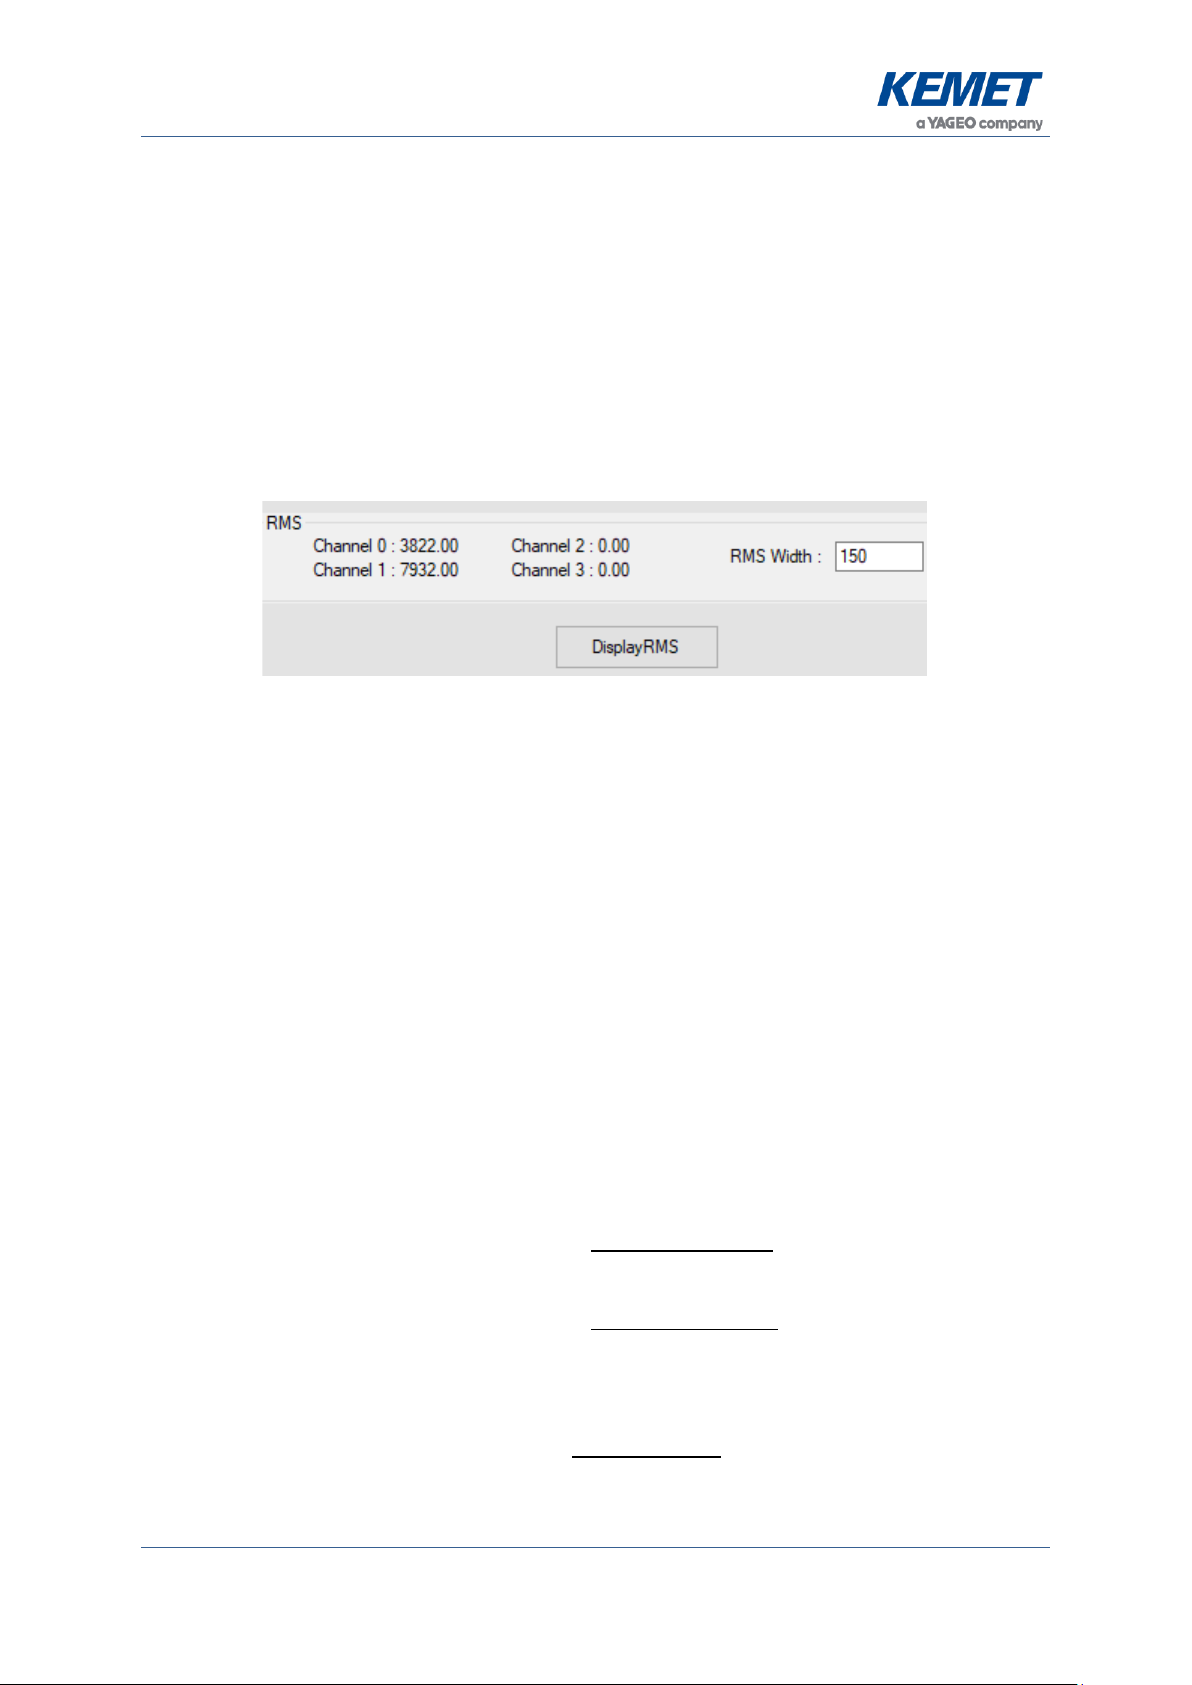
4.3.2 RMS Values................................................................................................8
4.3.3 RMS Width Value .......................................................................................8
4.4 Viewing Live Data –Oscilloscope Window..............................................................9
4.5 Saving Data to CSV (Comma Separated Value) File..................................................11
5 CONCENTRATION VIEW............................................................................................ 12
5.1 Signal Processing.................................................................................................14
6 PC TO PCB COMMUNICATIONS................................................................................ 14
6.1 Commands Description.........................................................................................15
6.2 Sampling and Signal Processing for KEMET TO Sensors.....................................15
7 EMITTER VOLTAGE SETTING................................................................................... 17
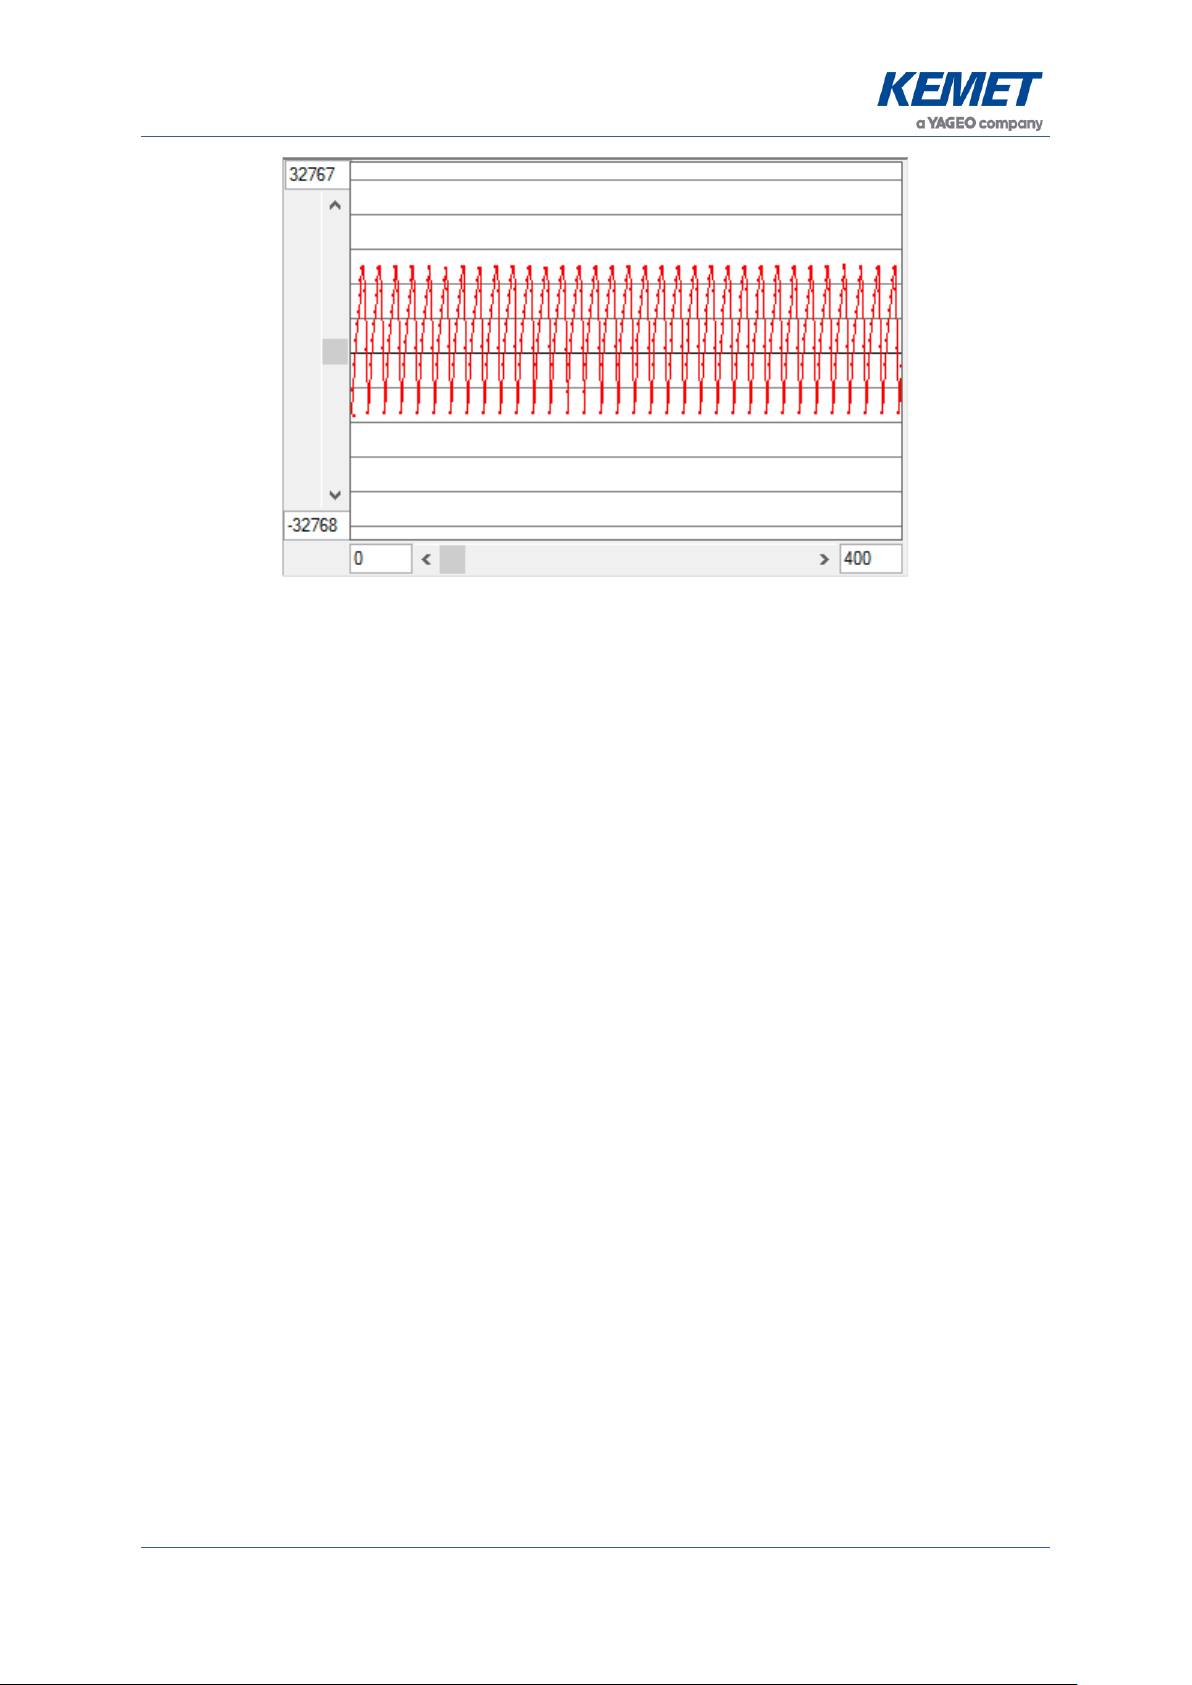
7.1 Saturation of Signal...............................................................................................17
7.2 Method..................................................................................................................18

TO CO2 Gas Sensing Evaluation Kit (Analog) USEQGCK5000000
The above information is believed to be correct but does not purport to be all inclusive and must be used only as a guide.
© KEMET Electronics Corporation • KEMET Tower • One East Broward Boulevard
Fort Lauderdale, FL 33301 USA • 954-766-2800 • www.kemet.com 3
1 INTRODUCTION
This document describes the KEMET demonstrator kit that enables simple and efficient data
visualisation and capture from KEMET TO-39 packaged sensor components. These high-
performance thin film pyroelectric sensor products are typically used in NDIR gas sensing,
process analytical measurement, IR spectroscopy and medical diagnostic applications.
The purpose of the kit is to enable the users to carry out a simple and effective demonstration
of KEMET two channelCO2 sensor, as well asto provide a flexible platform to start evaluation
and design work with all KEMET TO-39 packaged gas sensors. The software includes facilities
to capture measured data and visualise and record it on a Windows PC. The kit is based on
the Silicon Labs C8051F350 microcontroller with a high precision A-D converter and
programmable gain amplifier. It is capable of sample rates up to 333 Hz when sampling from
a single channel (allows for up to 4 multiplexed signals and ¼ the sample rate).
2 GETTING STARTED
Figure 1 –TO CO2Gas Sensing Evaluation Kit USEQGCK5000000
2.1 Kit Contents
1. KEMET PCB with C8051F350 microcontroller and ADC
2. USEQGCDAC82L00 dual channel CO2 sensor
3. Emitter driver PCB, with KEMET TO-39 IR emitter, reflector and sapphire window
4. Brass gas cell (not gas sealed, please consider safety if used with toxic gases)
5. 9 VDC power supply
6. Micro USB cable
7. KEMET Gas Sensing Evaluation Tool (Analog) software
click here for downloading the software
2.2 Minimum System Requirements
1. Microsoft® Windows PC
2. 2 GB of RAM

TO CO2 Gas Sensing Evaluation Kit (Analog) USEQGCK5000000
The above information is believed to be correct but does not purport to be all inclusive and must be used only as a guide.
© KEMET Electronics Corporation • KEMET Tower • One East Broward Boulevard
Fort Lauderdale, FL 33301 USA • 954-766-2800 • www.kemet.com 4
3. 450 MB of available hard-disk space for installation, additional free space required for
storing CSV files
4. 1,024x768 display (1,280x1,024 recommended)
5. Local administrative rights to install device drivers
6. .NET Framework 4.5
7. 1 free USB port
3 INSTALLATION
3.1 Installing the KEMET Gas Sensing Evaluation Tool Software
From the software package available to download here, select the setup.exe file that has this
icon. This will start the installation process.
Figure 2 –Installer Screen
Follow the on screen instructions and enter the information required.
As part of the installation process a check will take place to see if .NET Framework 4.5 is
present. If not, it can be installed as part of the setup routine or alternatively the setup routine
can be cancelled and the .NET framework 4.5 can be downloaded from Microsoft’s website.
The framework can take a while to install but the software requires it.
3.2 Connecting the TO Gas Sensing Evaluation Kit
1. Connect the power supply provided to the KEMET PCB.
2. Connect the USB cable to the kit and Windows PC.
a. You may see a message suggesting you are required to install a device
driver. Follow the on-screen instructions and download a driver from Windows
Update.
Your kit is now installed and ready to use.

TO CO2 Gas Sensing Evaluation Kit (Analog) USEQGCK5000000
The above information is believed to be correct but does not purport to be all inclusive and must be used only as a guide.
© KEMET Electronics Corporation • KEMET Tower • One East Broward Boulevard
Fort Lauderdale, FL 33301 USA • 954-766-2800 • www.kemet.com 5
4 SOFTWARE USER GUIDE
The KEMET Gas Sensing Evaluation Tool Data Capture software runs on Microsoft Windows
PCs and communicates with the Evaluation Kit USEQGCK5000000’s PCB, which enables
easy testing of KEMET TO packaged sensors. The software provides an interface to the
analog circuits and A-D (Analog to Digital) converter, which are provided by the Silicon Labs
C8051F350. Additional signal processing algorithms to filter and analyze sensor output for
NDIR gas sensing are provided.
4.1 Starting the Software
To start the software, select the following from the windows start button in your task bar.
This will open up the KEMET sensor data capture main screen as shown below.
Figure 3 –TO Gas Sensing Evaluation Tool Main Application Window

TO CO2 Gas Sensing Evaluation Kit (Analog) USEQGCK5000000
The above information is believed to be correct but does not purport to be all inclusive and must be used only as a guide.
© KEMET Electronics Corporation • KEMET Tower • One East Broward Boulevard
Fort Lauderdale, FL 33301 USA • 954-766-2800 • www.kemet.com 6
4.2 Connecting Software to the Data Capture Board
To connect to the data capture board make sure the board is powered and connected to the
PC through the USB cable.
From the menu bar select the Device option and then COMXX : Gas Sensor v3.1 VB as
shown below.
Figure 4 –Detector Connection
If the device does not show up, then click Rescan Ports.
Select the device. If the device does not show up, then unplug the USB cable and reconnect
then repeat the steps above.
Figure 5 –Main Application Window
If the data capture board is connected to the required com port, the status bar at the bottom
of the main display will show the message “Connected on COMXX” in the bottom right corner
of the window, and the Data Capture Board firmware version will be shown in the bottom left
corner, as shown in Figure .

TO CO2 Gas Sensing Evaluation Kit (Analog) USEQGCK5000000
The above information is believed to be correct but does not purport to be all inclusive and must be used only as a guide.
© KEMET Electronics Corporation • KEMET Tower • One East Broward Boulevard
Fort Lauderdale, FL 33301 USA • 954-766-2800 • www.kemet.com 7
4.3 Data Capture Board Control
The current settings used on the data capture board are displayed and the root mean square
(RMS) values update at a rate depending on filter width and emitter frequency.
Figure 6 –Data Capture Board Control Window
If there is any doubt about the settings displayed matching the board, there is a refresh button
which reads back all the settings and updates on the application window. There is also the
option to pause the stream of data. Note that this only stops the PC reading the stream and
does not stop the actual data capture boards data stream.
4.3.1 Data Capture Settings
It is possible to change some of the settings on the data capture board and also the filter
calculations through the interface. The settings from the drop-down lists update the board
immediately once the change takes place and the settings in the boxes update when enter is
pressed or leaving to a different control as long as the value is valid. If the value is invalid or
out of range, an error message is displayed and the text box is cleared.
The settings the user can access are described below:
Number of Channels: The board is capable of sampling inputs from up to 4 different
channels. The drop-down list allows the user to select the number of channels required. The
higher the number of channels selected, the lower the frame rate will be.
Gain: The C8051F350 chip provides a programmable gain amplifier making it possible to
select a gain for each channel independently from 1 to 128 times.

TO CO2 Gas Sensing Evaluation Kit (Analog) USEQGCK5000000
The above information is believed to be correct but does not purport to be all inclusive and must be used only as a guide.
© KEMET Electronics Corporation • KEMET Tower • One East Broward Boulevard
Fort Lauderdale, FL 33301 USA • 954-766-2800 • www.kemet.com 8
Emitter Frequency (Hz): The frequency with which the board pulses the IR emitter can be
set between 2 Hz and 30 Hz.
Emitter Duty Cycle: This can be set with two options, either 25% or 50% duty cycle.
RMS Width: The filter width of the RMS can be increased by a number of periods from 1 up
to 1,000. Anything outof this range will be flagged as out of range. The higher values will result
in slower response time.
4.3.2 RMS Values
This section displays the RMS (root mean square) output of each sensor channel calculated
to the specified filter widths.
Figure 7 –RMS Result Section
The values are updated when the calculations are complete for each set of data, with a rate
that should match the displayed response rate. The response rate is determined by the filter
width over the emitter frequency and is displayed in seconds. Inactive channels simply show
a value of 0.
4.3.3 RMS Width Value
In order to choose the best RMS width, the following parameters need to be known about the
set-up that you are using.
1. Sample frequency
2. Emitter frequency
3. Number of emitter periods to be used for RMS window
In order to ensure stability of the RMS values, the RMS window should be an integer multiple
of the number of samples taken during one emitter period.
First take the sample frequency and emitter frequency and determine the periods of each.
𝑆𝑎𝑚𝑝𝑙𝑒 𝑝𝑒𝑟𝑖𝑜𝑑 = 1
𝑆𝑎𝑚𝑝𝑙𝑒 𝑓𝑟𝑒𝑞𝑢𝑒𝑛𝑐𝑦
𝐸𝑚𝑖𝑡𝑡𝑒𝑟 𝑝𝑒𝑟𝑖𝑜𝑑 = 1
𝐸𝑚𝑖𝑡𝑡𝑒𝑟 𝑓𝑟𝑒𝑞𝑢𝑒𝑛𝑐𝑦
From this the number of samples that should be used for the RMS window is
𝑅𝑀𝑆 𝑤𝑖𝑑𝑡ℎ = 𝐸𝑚𝑖𝑡𝑡𝑒𝑟 𝑝𝑒𝑟𝑖𝑜𝑑
𝑆𝑎𝑚𝑝𝑙𝑒 𝑝𝑒𝑟𝑖𝑜𝑑 ∗ 𝑛

TO CO2 Gas Sensing Evaluation Kit (Analog) USEQGCK5000000
The above information is believed to be correct but does not purport to be all inclusive and must be used only as a guide.
© KEMET Electronics Corporation • KEMET Tower • One East Broward Boulevard
Fort Lauderdale, FL 33301 USA • 954-766-2800 • www.kemet.com 9
for some integer ‘n’. This ensures that the RMS is taking one period or a multiple of periods
effectively. Taking values of ‘n’that are not integers will produce a varying output in terms of
RMS due to sampling more or less than one complete waveform, as shown below.
Figure 8 –Standard Deviation of Raw Signal –10 Hz Emitter Pulsing and 80 Hz Sample Frequency
The above plots show an example of the KEMET Gas Sensing Evaluation Kit when running
at a sample frequency of approximately 80 Hz. The right hand side shows the effect of taking
the window width to be 8 samples –10 Hz emitter frequency gives 8 samples per emitter
period. If we change this to 7 instead then we are looking at a different part of the waveform
each time and it introduces the noise seen on the left plot which is simply an artefact of the
data processing.
4.4 Viewing Live Data –Oscilloscope Window
While the software isconnected to a data capture board, it is possible to view the data sampled
in real time. Virtual oscilloscopes are provided for each channel and can be shown or hidden
by selecting Oscilloscope Full View or Oscilloscopes Normal View respectively from
Options on the menu bar.
Figure 9 –View Options
The oscilloscope window has several features which emulate a basic oscilloscope for viewing
live sampled data. It can be adjusted to display the desired range on both the y-axis
(Amplitude) and the x-axis (Time Domain).
The number of oscilloscope windows displayed is equivalent to the number of channels
selected and will change every time the number of active channels changes.

TO CO2 Gas Sensing Evaluation Kit (Analog) USEQGCK5000000
The above information is believed to be correct but does not purport to be all inclusive and must be used only as a guide.
© KEMET Electronics Corporation • KEMET Tower • One East Broward Boulevard
Fort Lauderdale, FL 33301 USA • 954-766-2800 • www.kemet.com 10
Figure 10 –Oscilloscope Window - Normal View
The oscilloscope value display range can be adjusted by two different methods:
1. By entering the maximum and minimum values in the text box at the end of each axis.
When entering the values, the color of the box will change to signify that the value in
the box is not currently being used for the display. After setting the text value to the
desired number, press Enter and the display will update (the text box changes back to
white to signify that the value in the box is being used). Ifthe new value is not accepted
(for example, if the minimum value is greater than the maximum value, or text has
been entered instead of a number), then the previous value will automatically re-load.
2. By using the mouse.
•The scroll bars along both axes canbe used to move thedisplay position and tozoom
in or out.
-Moving the position is achieved by moving the scrollbar position.
-Scaling is changed by entering a new set of values for the upper and lower limits
of the graphing area. Click on the axis value and type the new value, pressing
enter causes the change to take effect.
•The viewing offset can also be adjusted in both x and y directions by holding down
the right mouse button when over the viewing area and dragging the mouse (up,
down, left or right).
The Properties Option, which is accessed by right clicking on the scopes graphing area,
allows the user to enable or disable the horizontal grid lines and also set the spacing in A-D
counts.

TO CO2 Gas Sensing Evaluation Kit (Analog) USEQGCK5000000
The above information is believed to be correct but does not purport to be all inclusive and must be used only as a guide.
© KEMET Electronics Corporation • KEMET Tower • One East Broward Boulevard
Fort Lauderdale, FL 33301 USA • 954-766-2800 • www.kemet.com 11
4.5 Saving Data to CSV (Comma Separated Value) File
From the file menu on the main screen it is possible to save the captured data to Comma
Separated Value files, for analysis in Matlab, Excel, etc. After selecting Save to CSV a pop-
up window Capture Data to CSV File will appear requesting information about how long the
software should save data for.
Figure 11 –CSV File Writing Settings
It is possible to choose:
•to capture data indefinitely; which will capture data until the software is instructed to
stop, or the PC runs out of disk space.
•to specify the number of samples which the PC should capture data for.
•to specify the time period over which the software will capture samples.
After selecting the duration of data capture and entering the desired file name to Save As.
After choosing a file name and selecting Ok the software will automatically create two files in
the location with the name you specified. The first will contain the raw sampled data and the
second (which will have “.rms” added to the end of the file name) will contain the RMS data
as calculated by the KEMET software.
The software will also update its display on the status bar to show that it is capturing data to a
file.
Figure 12 –Saving Data to CSV File in Process

TO CO2 Gas Sensing Evaluation Kit (Analog) USEQGCK5000000
The above information is believed to be correct but does not purport to be all inclusive and must be used only as a guide.
© KEMET Electronics Corporation • KEMET Tower • One East Broward Boulevard
Fort Lauderdale, FL 33301 USA • 954-766-2800 • www.kemet.com 12
At any time while the software is capturing data to a file it is possible to stop the data capture
by selecting Stop CSV Capture from the file menu.
5 CONCENTRATION VIEW
The ability to turn the sensor signals into a known concentration of gas is of course the
requirement of most gas detection systems. The gas concentration view of the KEMET Gas
Sensing Evaluation Tool is available by selecting it from the drop down Options menu.
Figure 13 –Options Menu
Figure 14 –Gas Concentration View
Once opened the initial output of the concentration form will be nonsensical information as the
system has not been calibrated. In order to calibrate the system please determine the
coefficients according to the Beer Lambert law.
Once the system has been calibrated then it is possible to save the coefficients of the modified
Beer Lambert law by selecting file then Save Coefficients.

TO CO2 Gas Sensing Evaluation Kit (Analog) USEQGCK5000000
The above information is believed to be correct but does not purport to be all inclusive and must be used only as a guide.
© KEMET Electronics Corporation • KEMET Tower • One East Broward Boulevard
Fort Lauderdale, FL 33301 USA • 954-766-2800 • www.kemet.com 13
Figure 15 –Save Coefficients
The next time this system is connected to the software the coefficients can be loaded from the
file using the Load Coefficients option. It is worth mentioning thatthe same set of coefficients
cannot be used for different systems. Each system must be calibrated individually as there
are system differences such as sensor responsivity and emitter characteristics that vary from
evaluation kit to evaluation kit.
The input to the modified Beer Lambert law equation is the RMS per emitter period. This is
chosen for its stability. In order to provide greater stability a larger number of emitter periods
can be averaged using the text box and apply button in the signal filtering section.
Figure 16 –Gas Concentration Options
There are 3 options for viewing gas concentration, which can be selected in the View panel
under the scope.

TO CO2 Gas Sensing Evaluation Kit (Analog) USEQGCK5000000
The above information is believed to be correct but does not purport to be all inclusive and must be used only as a guide.
© KEMET Electronics Corporation • KEMET Tower • One East Broward Boulevard
Fort Lauderdale, FL 33301 USA • 954-766-2800 • www.kemet.com 14
If the CSV options is selected from this view, there is an additional option of saving the
concentration values calculated. This must be opened and selected to save concentration
data.
Figure 17 –CSV Options from Concentration View
5.1 Signal Processing
RMS Rolling –Sampling Frequency: This calculates the RMS for a window of data every
time a new data point arrives. This is the fastest updating but most unstable processing
method.
Input Moving Average: This is simply the number of rolling averagewindows being averaged
to provide the RMS data point that is passed to the concentration calculations.
Output Moving Average Size: This changes the moving average window size on the
calculated concentration value.
6 PC TO PCB COMMUNICATIONS
•Communications with the PCB are via a CP2102 USB to UART adapter, fitted to the
KEMET PCB.
•UART settings: Baud 115200, 8 data bits, no parity, 1 stop bit, no handshaking.
•All responses from the PCB are terminated with “\n”.
•All commands sent to the PCB are single bytes.
•It’s important to wait for the PCB response after sending each command as writing
another byte too soon may overwrite the previous command resulting in an error. If no
response is received within 1 second, then the command has not reached the PCB
and should be resent.
•If the board requests a value, the value must be sent as a binary value (for example
Channel 4 must be sent as 0x04).

TO CO2 Gas Sensing Evaluation Kit (Analog) USEQGCK5000000
The above information is believed to be correct but does not purport to be all inclusive and must be used only as a guide.
© KEMET Electronics Corporation • KEMET Tower • One East Broward Boulevard
Fort Lauderdale, FL 33301 USA • 954-766-2800 • www.kemet.com 15
6.1 Commands Description
Command
Character Code
Description
Response
0
Null command
“ok”
1
Get product details
Product string
2
Set number of
channels
“Set number of channels (1, 2 or 4
accepted)”
“ok” or “Error setting not accepted”
3
Set Gain
“Send channel number (1, 2, 3 or 4
accepted)”
“Send gain setting (1, 2, 4, 8, 16, 32, 64, 128
accepted)” or “Error setting not accepted”
“ok” or “Error setting not accepted”
4
Set emitter frequency
“Send Frequency (2 to 30 accepted)”
“ok” or “Error setting not accepted”
5
Get MS1CH1
“12345”
6
Get MS1CH2
“12345” or “Channel not active”
7
Get MS1CH3
“12345” or “Channel not active”
8
Get MS1CH4
“12345” or “Channel not active”
9
Start streaming raw
data
“ok” then the kit will stream binary data
values
10
Set RMS filter width
“Send filter width (1 to 254 accepted)”
“ok” or “Error setting not accepted”
11
Set duty cycle
“Send duty cycle, 2 = 50%, 4 = 25%”
“ok” or “Error setting not accepted”
12
Get settings
“No channels = x, Gain 1 = x, Gain 2 = x,
Gain 3 = x, Gain 4 = x, RMS filter width = x,
Duty cycle = x%”
13
Reset defaults
“System reset to default”
255
Stop streaming data
“ok”
6.2 Sampling and Signal Processing for KEMET TO Sensors
KEMET’s unique thin film pyroelectric sensors have excellent response at higher modulation
frequencies than many existing competitor sensors. This higher frequency performance has
the benefit of reducing the impact of pink (1/F) noise that can plague both sensors and
electronics at the low frequencies often used in infrared applications. Good system engineers
will be aware that pink noise may be the dominant noise source when operating at below ~4
Hz. This is in stark contrast to most electronics applications where signals in excess of 1 kHz
are examined, and pink noise is less significant. For many applications, including NDIR gas
sensing and IR spectroscopy, by operating KEMET sensors at higher modulation frequencies
the pink noise can be further suppressed, improving the signal to noise ratio. KEMET sensors
will still outperform competitors’ sensors in the 1 –4 Hz operational rangein a circuit optimized
for KEMET.
KEMET ITV sensor products provide customers with a combination of class leading S/N and
unparalleled temperature stability, as well as excellent part to part uniformity. These
advantages are brought about by the combination of KEMET’s advanced MEMs based thin
1
If the MS is to be used for Beer-Lambert calculations it is necessary to take the square root of the MS value returned, as the C8051F350 doesn’t
calculate the square root, as for example, Result = sqrt ( Get MS CHx )

TO CO2 Gas Sensing Evaluation Kit (Analog) USEQGCK5000000
The above information is believed to be correct but does not purport to be all inclusive and must be used only as a guide.
© KEMET Electronics Corporation • KEMET Tower • One East Broward Boulevard
Fort Lauderdale, FL 33301 USA • 954-766-2800 • www.kemet.com 16
film device structure with a low noise transimpedance amplifier, which includes a 31 Hz first
order low pass filter.
To maximize the competitive advantage offered by this product it is recommended that
sampling and filtering regimes are modified in accordance with the following diagrams.
The figure below shows a typical waveform from KEMET TO sensors when illuminated with a
10 Hz emitter pulsed with a square wave.
There are two points to note about the signal shown above, as highlighted by the figure below
in more detail.
1. There is mid frequency noise present in the signal.
2
2. Even at 10 Hz the waveform is not completely sinusoidal, demonstrating the higher
speed performance of KEMET sensors.
The diagram below illustrates how to sample the above waveform so as to minimize noise
present in the signal.
2
This noise can easily be removed by oversampling

TO CO2 Gas Sensing Evaluation Kit (Analog) USEQGCK5000000
The above information is believed to be correct but does not purport to be all inclusive and must be used only as a guide.
© KEMET Electronics Corporation • KEMET Tower • One East Broward Boulevard
Fort Lauderdale, FL 33301 USA • 954-766-2800 • www.kemet.com 17
1. For each different NDIR design the timings for switch on (t2-t1) and switch off (t4-t3)
time will have to be measured, as they are more correlated to emitter design than
KEMET sensors.
The signal size = Sum (on samples) –Sum (off samples).
7 EMITTER VOLTAGE SETTING
As with all electronics, there are tolerances for each of the components. The gas demo is no
different and hence a calibration methodology is required to ensure optimal settings for
maximum sensor output whilst not saturating the sensor. The method is best described by
looking at the waveform on both the KEMET Software as well as using and external
oscilloscope.
7.1 Saturation of Signal
When the sensor’s output is fully saturated, the KEMET software will have a waveform similar
to the following picture.
Figure 18 –Saturated Signal

TO CO2 Gas Sensing Evaluation Kit (Analog) USEQGCK5000000
The above information is believed to be correct but does not purport to be all inclusive and must be used only as a guide.
© KEMET Electronics Corporation • KEMET Tower • One East Broward Boulevard
Fort Lauderdale, FL 33301 USA • 954-766-2800 • www.kemet.com 18
The graph can be explained by following the output of the sensor through the hardware signal
conditioning components. Using an oscilloscope to capture the output on the pin of the TO
packaged sensor shows the following the graph when the output is saturated.
Figure 19 –Output Pin
The signal saturation is shown by the flat peaks and troughs of the waveform. After the signal
has gone through a low pass and a high pass filter the signal changes to the same as shown
in the KEMET software.
Figure 2 –Input to ADC
The signal is the same as is shown in the KEMET software. The reason that the gradients at
the top and bottoms are reversed is simply that the produced waveforms are moving in
opposite directions; the oscilloscope has new data added to the right-hand side and the
KEMET software has new data added to the left-hand side.
7.2 Method
For setting up the gas demo kit, it is best to use an oscilloscope if one is available, because
the waveform will be cleaner than that produced by the KEMET software. Starting with the
emitter voltage set to the point of causing saturation of signal, slowly reduce the voltage until
no saturation is occurring. For most applications this will be fine. For using the system in

TO CO2 Gas Sensing Evaluation Kit (Analog) USEQGCK5000000
The above information is believed to be correct but does not purport to be all inclusive and must be used only as a guide.
© KEMET Electronics Corporation • KEMET Tower • One East Broward Boulevard
Fort Lauderdale, FL 33301 USA • 954-766-2800 • www.kemet.com 19
environments that have less CO2than average environmental CO2levels, it will be necessary
to reduce the voltage slightly further again to ensure that when the level of absorbing gas
drops, the additional signal strength will not cause the output to saturate.
The emitter board has a potentiometer for altering the voltage across the emitter.
1. Turn the voltage up until one of the signals has saturated, looking out for the
waveforms listed above for saturation.
2. Slowly reduce the voltage until no evidence of saturation is detected.
3. Reduce slightly further if the application requires it.
Following these three steps will ensure maximum signal strength for your application.
Please note that the maximum emitter voltage is higher than is generally required, this is due
to the different lengths of brass pipe for each gas detection application differing dramatically,
and it should never need to be set to maximum for CO2. Running at higher voltages causes
the emitter to deteriorate faster so should be avoided unless necessary due to a longer path
length.
•Turn clockwise to
increase voltage and
anti-clockwise to
decrease the
voltage.
Table of contents
Other Yageo Motherboard manuals
Popular Motherboard manuals by other brands

Microchip Technology
Microchip Technology PIC18F16Q41 Curiosity Nano Hardware user's guide

ON Semiconductor
ON Semiconductor AR1337CSSC32SMFAH3-GEVB user manual

Infineon
Infineon XMC7200 Guide

Biostar
Biostar IDEQ 220K Bios setup manual

Lutron Electronics
Lutron Electronics EcoSystem Energi Savr Node installation guide

Asus
Asus P4P800-F user manual