AirTest PT9250 User guide

AirTest PT9250 & CO2Application Guide 1 of 12
Application Guide:
Harness The Power Of Portable CO2Measurement
With The PT9250 Hand Held Monitor
Measure Ventilation – Estimate Energy Savings – Building Troubleshooting
Overview
This application guide is much more than a product manual. It is also targeted at making you
knowledgeable as to how the measurement of carbon dioxide (CO2) can help you understand
buildings better in order to save energy and solve problems. Its one thing to measure CO2,
however this book provides a study guide that will quickly give you the critical knowledge and a
competitive advantage in using CO2as a powerful, and profitable measurement parameter of
ventilation and building performance.
Table Of Contents
1. Introduction ................................................................................................................... 2
2. Quick Start Basics ........................................................................................................ 2
3. Spot Check Ventilation Rates ...................................................................................... 3
4. Using The UIP Software Interface With The PT9250 ................................................. 5
5. Data Logging With The PT9250 .................................................................................. 7
6. Calibration ..................................................................................................................... 7
7. Making Most Of The TR9250 – Some Application Examples .................................... 8

AirTest PT9250 & CO2Application Guide 2 of 12
1. Introduction To The PT9250
Hand Held CO2Sensor
Overview
The PT9250 is a versatile tool that can be used
by building owners and contractors to better
understand the operation of buildings and assess
their potential for energy savings using a CO2
based ventilation control strategy. It can also be
a useful tool for checking the operation of existing
ventilation systems and the degree to which
ventilation is being delivered to individual zones
to meet occupant needs.
What’s Inside
Inside the TR9250 is a temperature sensor and a
unique infrared sensor that optically detects and
measures the concentration of carbon dioxide in
the air. Its operation is based on the same
principal used by infrared spectrometers typically
used in medical and scientific applications. The
LCD display on this versatile tool will provide a
direct indication of both CO2and temperature
concentrations. The hand held unit also
incorporates a powerful “smart” microprocessor
used to perform the complex task of analyzing
the CO2sample.
The microprocessor allows the sensor to data log
concentrations over time, to perform a self-
calibration, and to calculate and display
cfm/person ventilation rates (which are directly
related to CO2 concentrations). The
microprocessor also allows the TR9250 to be
connected to a PC where you can customize
information provided on the display, set data
logging preferences (like sampling time interval)
and view the results of a current or past
measurement that has been data logged. You
can also download the recorded CO2and
temperature data to a program like Windows®
Excel® for more detailed graphing and charting
options.
2. Quick Start Basics
Turning On The Hand Held Sensor
Plug the charger provided with the sensor into
the bottom of the TR9250 and allow it to charge
for at least 1.5 hours.
To power up the TR9250 you will have to hold
the power button down for approximately 10
seconds while the sensor performs a self-
diagnostic check.
Once you press the power button you will see
88.88 displayed on the upper display and –88.88
on the lower display for approximately 4 seconds
and then the screen will go blank for
approximately 2 seconds. Continue holding the
button until you see the word “test” on the lower
display. At this point, the TR9250 will continue
it’s self-diagnosis until readings on the upper
display reach 5000 ppm and all the LED’s have
been illuminated. Once this sequence is
completed the display will immediately begin to
display current readings. If the display goes blank
when you release the button, the internal battery
will need to be charged before you can use the
hand held sensor.
Turning Off The Hand Held Sensor
Press and hold the power button for 10 seconds.
During that time you will see the display cycle
through two modes. One mode is “read” and the
other mode is “cal b”. These functions will be
described later in this manual and are briefly
described below. When the display goes blank
you can remove your finger from the power
button.
“read” This mode is used to change the outside
concentration used for the calculation of
ventilation rate to an actual outside measurement
rather than the assumed 400 ppm. Read mode
will be activated whenever the power button is
pressed during operation. The use of this button
is explained further in the next section.
“cal b” This mode Is used for automatic
background calibration. When left in this mode
overnight in an unoccupied area, the unit will
calibrate itself so that the lowest level observed
during the period will be 400 ppm (typical outside
levels).

AirTest PT9250 & CO2Application Guide 3 of 12
The Display
When the sensor is powered up for the first time
CO2concentrations will appear on the upper
screen. The lower screen will alternate between
a display of the temperature in ºF or ºC, and the
cubic feet per minute (cfm) per person of outside
air delivered to the space. CO2levels can be
used to determine fresh air ventilation rates in the
space.
Battery power level is also displayed in the
middle left portion of the display. Three small
bars indicate a full charge.
The LED’s underneath the display provide a
quick check of the concentration.
By using the provided PC interface software and
cable you have the ability to customize how
information is to be displayed by the digital
display and LED’s.
Upper Display: CO2Reading
Carbon dioxide concentrations are displayed in
parts per million (ppm). The PT 9250 will display
concentrations up to 9,999 ppm . Typical outside
levels are 380 to 450 ppm. Typical inside levels
can vary from 400 ppm to as high as 3,000 ppm.
Lower Display: Temperature & Ventilation
Rate
The lower display alternates between displaying
temperature and providing a calculated value of
the cfm/person ventilation rate in the space. By
using the pC program provided with the sensor
you can change both the location and the way
this information is displayed on the screen.
3. Spot Check Ventilation Rates
Background
The PT9250 not only measures CO2and
Temperature but it also calculates the outside air
ventilation rate in cfm per person based on the
difference between inside and outside CO2
levels.
So how can we determine the cfm per person
ventilation rate from CO2levels? This calculation
is based on a widely recognized engineering
principal. People will produce almost identical
amounts of CO2when at the same level of
exertion or activity (e.g. office work). So an
indoor CO2measurement indicates how much
outside air (at low CO2concentrations) is being
introduced to dilute or remove the CO2being
produced by people in the space. Regardless of
whether there is one or a hundred people in the
space, the CO2level will reflect how much
outside air is being delivered for each person.
This is because the calculation of ventilation rate
is based on the
known amount of
CO2produced by
each person and the
known quantity of
outside air that is
required to dilute
concentrations to a
particular level of
CO2. The adjacent
chart shows this
relationship between
CO2and ventilation
rate. This would
apply for a typical
office space and
outside air CO2
concentrations of
400 ppm. In effect,
this chart is built into
the PT9250.

AirTest PT9250 & CO2Application Guide 4 of 12
When a space is under-ventilated, CO2levels will
be very high (e.g. over 1500 ppm). Conversely,
concentration of CO2close to outside levels
(typically around 400 to 450 ppm) indicates very
high ventilation, or perhaps over-ventilation.
Levels of approximately 1100 ppm will indicate a
ventilation rate of 15 cfm per person, which is
typically required by most ventilation codes.
Spot Measurement Application Tips
Note CO2Is Not Harmful In Building
Environments:It is important to note that at the
levels we normally measure in buildings CO2
itself is not harmful. In an occupational health
environment, exposure to CO2levels up to 5,000
ppm over 8 hours, is considered acceptable by
OSHA. In buildings the CO2concentration is
more an indication of ventilation. If a space feels
uncomfortable, stuffy, or stale and the CO2levels
are high, it is not really the CO2having the effect.
The high CO2levels are telling you that
ventilation is insufficient, and you are likely
reacting to all the things that build up when there
is insufficient fresh air ventilation.
CO2Levels Must Be Stable For An Accurate
Spot Ventilation Measurement: A true
correlation between CO2levels and ventilation
rate can only be made by a spot measurement
when concentrations appear to have stabilized in
a space. If levels are continuing to change it may
be an inappropriate time to measure ventilation.
For low-density office spaces and retail
applications it is best to take measurements 2-3
hours after occupancy in the space has begun
(late morning or afternoon). In higher density
applications like school classrooms, theaters and
meeting rooms measurements can be made 15
to 20 minutes after the start of occupancy.
Avoid Measurements When Building
Economizer Is On: Be aware that ventilation
rates will appear very high if the building is
operating in economizer mode (using outside air
for free cooling). It is best to ensure the
economizer is temporarily disabled or not
operating when performing spot CO2
measurements.
Measurement Location Tips: Carbon dioxide
will readily disperse and equalize within a space.
Therefore measurements can be taken just about
anywhere or at any height. However one should
keep away from open doors or windows as well
as the area directly surrounding a discharge grill.
Blowing Into The Sensor: Pure exhaled breath
contains 40,000 ppm of CO2that will readily
disperse in air. Try to avoid breathing directly on
the sensor when taking a measurement. If you
do breath into the sensor, it will not hurt the
sensor but it may take a few minutes for the
sensor to readjust to normal background levels.
Since the PT9250 measures up to 10,000 ppm
you may also temporarily send the display off
scale.
Estimating The Total Ventilation Rate To A
Space: If you actually count the number of
people in the space when you take the
measurement, you can multiply this number
times the cfm-per-person ventilation rate to
determine the total amount of outside air being
delivered to the space.
Using Actual Outside CO2Levels To Calculate
Ventilation Rate: In some cases you may find
that the outside levels are slightly higher or lower
than the 400 ppm level assumed by the PT9250.
(A difference of about 50 ppm will result in an
error of about 0.5 cfm/person in the calculation.)
For a more accurate calculation of ventilation
rates you can reset the outside level used in the
PT9250 calculation based on actual conditions by
exposing the sensor to outside air. Once levels
have stabilized, press the power button for about
a second. The word “read” should flash on the
screen. Now the outside concentration you just
measured will be used for the calculation of
ventilation rate until you power off the sensor.
Once powered up again the sensor will assume
an outside level of 400 ppm until you power the
unit off.
Battery Life: Battery life of the sensor is 8 to 14
hours. It is a good idea to charge the sensor up
every night. Regular charging will not hurt the
battery inside the PT9250.
Car Charging: If desired you can also purchase
an automotive phone charger to keep the sensor
powered up between calls. Select a charger with
a 3.5 mm (od) connector that provides an output
voltage of 6 VDC with a current of 500 mA. The
plug-in is configured for positive in the center and
negative on the outer portion of the plug. Call
AirTest for further information.
Battery Charge Indicator: The current battery
charge level is indicated by the small graphic
symbol on the left side of the line dividing the
upper and lower display. Three bars indicate a
full charge.
Calibration: There are a number of easy ways
to calibrate the sensor. These are discussed in
section 6 of this document.

AirTest PT9250 & CO2Application Guide 5 of 12
4. Using The UIP Software
Interface To The PT9250
Overview
The PC software provided with the PT9250
allows you to customize the appearance and
operation of the hand held monitor. It also allows
you to view graphed CO2concentrations that
have been recorded using the on-board data
logger, and lets you export this information to
another program such as Excel® where you can
customize the appearance of the report. You can
also calibrate the sensor using this program and
a known source of CO2.
Using The UIP Program
To get started, install the UIP (User Interface
Program) program into your PC. Once the
program is installed it is a good idea to restart
your machine before using the program.
Prior to starting the program on your PC, turn the
PT9250 on and plug it into your PC using the
cable provided. (Note: If your computer does not
have a RS232 Serial Port, most computer
peripheral suppliers should be able to provide a
converter attachment that will allow the cable
provided to interface with a USB port.)
When you start the program it will immediately
search for the sensor plugged into your computer
and start to download information in the sensor.
This may take a few minutes. If you are having
problems with connecting to the sensor visit the
troubleshooting section of this document.
General Tab
Once the program has loaded data from the
sensor, the first screen you will see provides
some general information about the sensor.
Other functions of the software can be accessed
via the tabs on the program interface, and via the
menu options at the top of the program window.
The sections below will provide more information
on each of the tab selections available in the UIP.
LED Tab
This part of the program allows you to adjust the
CO2concentrations that will illuminate the
different LED’s (light emitting diode) below the
sensor display. Once you make a change press
the “send to sensor” button at the bottom of the
screen to transfer the new setting to the PT9250.
The new setting will be applied the next time the
sensor is powered on. The new settings will be
applied within a few seconds.

AirTest PT9250 & CO2Application Guide 6 of 12
Display Tab
Here you can change a number of characteristics
of the LCD display on the PT9250. By clicking in
the box you will see a menu of the display
choices that are available. You can also choose
to have the hand held display English/US units or
metric units (SI). Ventilation rate is displayed
either in cubic feet per minute (cfm) or liters per
second( l/s). Once you make a change press the
“send to sensor” button at the bottom of the
screen to transfer the new setting to the PT9250.
The new setting will be applied the next time the
sensor is powered on. The new settings will be
applied within a few seconds.
Logger Tab
This section discusses the data logging
adjustments and options available using the PC
interface. Further guidance on data logging and
its use is also provided in the next chapter. This
part of the program allows you to view logged
data, set the logger interval, and create a time
stamped text file that can easily be read by
programs like Excel®. The sensor can log up to
895 points for both temperature and CO2. The
selections available on this tab are described
further below.
Sample Interval: The sampling rate of the
sensor can be adjusted from every 6 seconds to
every 4 hours using the selection menu. Once a
new setting is selected it must be sent to the
sensor and the sensor will have to be turned off
then back on for the new setting to take effect
Note: the battery charger should also be
disconnected from the PT9250.
Graphed Results: Each time the sensor is
turned on a new logger file is created and can be
identified at the top of the graphical display. By
clicking on the file you can view the set of data
for that file. The oldest files will have the lowest
number. Once the data logger has reached its
maximum capacity it will begin logging over the
oldest data. The graph function is very basic and
automatically adjusts the scale of the graph
based on the range of measurements observed.
For more options in graphing, the logged data
can be exported to a text file and graphed in a
program like Excel®.
Update Button: When this button pressed it will
upload the latest data from the sensor and
display it on the graph. This is useful if you
would like to show readings on a real time basis
with an operating sensor connected to the PC.
This can be useful for customer presentations or
training.
Save As Text Button: This option will export the
data shown on the graphical display as a text file
that can easily be read by programs like Excel®.
When you export the file you will be asked to time
stamp the data (see below).
Time Stamping Exported Data: While the
PT9250 can record readings at a selected
interval it does not have a real time clock.
However it is possible to have the recorded data
date and time stamped when it is exported.
When you export the data you will be asked for
the date when the sensor was last turned off as
well as the time the sensor was turned off.
Based on this information all the data will be
assigned a date and time value. This has the
effect of adding two columns of information to the
data, one for the date and one for the time.

AirTest PT9250 & CO2Application Guide 7 of 12
5. Data Logging With The PT9250
Overview
The ability to record CO2and temperature data
over time and graph it is a powerful analytical tool
that can help you better understand how a
building is operated.
When assessing a building’s ventilation rates
often the first step is to do a spot measurement
as described in chapter 3. If unusually high or
low levels are detected, the next logical step is to
verify the reading by measuring concentrations
over time and graphing the results.
When assessing ventilation rates, the graphed
peak CO2concentration becomes readily
apparent for estimating ventilation rates. And if
concentrations are measured over a number of
days, consistency patterns of occupancy and
ventilation can be verified.
Application Tips For Data Logging
Note End Of Logging Period: In order to
properly time stamp data, make note of the time
you turn off the sensor after the logging session.
You will be asked for this data when exporting
the data to a text file.
Managing Data: If possible, it is recommended
that you download logged data to a text file soon
after completing a measurement. Once the data
has been exported, reset the data logger to erase
the memory. This will make it much easier to
manage files on the data logger and will ensure
that old data will not be erased if all 895 data
points are used.
Setting Logging Interval To Desired
Measurement Time Period: To ensure you do
not exceed the database memory (895 points)
and write over previously recorded data, a
sampling interval should be selected that allows
for adequate space in the data logger. Some
guidelines on maximum sampling periods are
provided below.
•1 Day – 2 minute sampling
•2 Day – 4 minute sampling
•5 Day – 10 minute sampling
•7 Day – 15 minute sampling
Battery Life & Logging: The battery life of the
PT9250 is 10 to 16 hours. As a rule you should
have the PT9250 plugged into it’s charger
whenever you are logging concentrations for
extended periods of time.
Graphing Text Data In Excel: It is very easy to
graph the exported text files in Excel.
1. Open the Excel® program.
2. Under ‘file’, select open and locate the
exported text file.
3. Highlight the cells containing the time
and reading data.
4. Select the chart wizard and it will guide
you through the creation of a graph that
can easily be changed, labeled and
inserted into other documents,
6. Calibration
Overview
There are two methods that can be used to
calibrate the sensor.
Background Calibration
Background calibration is an easy way to
calibrate the PT9250 overnight without the need
for special calibration gases. Using this process,
the sensor is left overnight in an area that will be
unoccupied for a number of hours, and as a
result the space will likely drop to background
outside levels (always around 400 ppm).
When in background calibration mode the sensor
will record the lowest CO2level measured
overnight and calibrate this point to 400 ppm.
To activate background calibration:
1. Turn the sensor on and plug it into its
charger.
2. Hold the power button down until you
see “cal b” on the display of the PT9250
and then release the button.

AirTest PT9250 & CO2Application Guide 8 of 12
3. Leave the sensor in place for at least 5
hours.
4. When the background calibration period
is complete hold the power button down
to power off the hand held unit.
5. Once powered on (restarted), the
sensor is ready to use.
The maximum correction the sensor will make in
a 5 hour period is 130 ppm, If you suspect the
sensor is significantly out of calibration you may
have to perform a number of background
calibrations.
UIP Based Calibration
By using the capabilities of the UIP software
program you can quickly (approximately 5
minutes) calibrate the sensor to a known source
of CO2. Using the UIP program you can perform
a quick background calibration, a zero calibration
and a span calibration. You can also calibrate
the temperature sensor if desired. The process
for each type of CO2calibration is very similar.
1. Expose the sensor to a known
concentration of gas either using
ambient concentrations or by flowing
calibration gas through the calibration
port on the bottom of the sensor.
2. Go to the “Sensor” heading on the
program menu bar and select
‘calibration’.
3. Choose the type of calibration you
would like to perform: Background,
Zero Cal, Span Cal or Temperature Cal.
4. A series of menus will lead you through
the calibration process for the type of
calibration you wish to perform.
Application Tips
Calibration Gas: Calibration gases, tubing and
regulators are available from AirTest.
Zero & Span Calibration: Typically, drift of the
PT9250 is on the zero adjustment of the sensor.
The sensor generally should not require span
adjustment. If performing both types of
calibration the zero calibration should be
performed first.
7. Making Most Of The TR9250 –
Some Application Examples
Overview:
This section provides a brief description of a
number of real world applications for the PT9250
hand held.
Estimating Ventilation Rate From A Data
Logged Sample:
Data logged over time samples have a great
advantage over a spot measurement.
•You can get a clear profile of ventilation
in the space over the course of a day,
week or more.
•It is possible to determine the peak
value that will determine what the
cfm/person ventilation rate is.
•You can determine if occupancy and
use patterns are consistent over an
extended period of time.
•The data logged sample provides an
excellent tool for comparing before and
after ventilation performance, for
example, after retrofit work has been
undertaken.
The chart below shows data logged temperature
and CO2concentrations in an office space that
were recorded on the PT9250, downloaded to a
text file, and then graphed using the charting
capabilities in Excel®. The charting capabilities of
this and other spreadsheet programs offer
tremendous versatility in customizing the
appearance of your reports.
To use data logged information to estimate
ventilation rate, find the areas on the graph
where CO2levels appear to level off late in the
day or afternoon. Note how concentrations
consistently level off at 650 ppm to 675 ppm for
hours at a time. This indicates that the CO2
production by occupants has reached equilibrium
with the outside ventilation air delivered to the

AirTest PT9250 & CO2Application Guide 9 of 12
space. Also note that the lowest level measured
is 400 ppm (measured over the weekend). Given
the stability of measurements at this level we can
assume that the space is unoccupied and the
levels measured are typical of outside levels.
There are two ways to measure ventilation rate.
If outside levels are at or near 400 ppm and the
activity level is close to office type activity then
the CO2/cfm-per-person conversion chart in
Section 3 of this guide can be used.
You can also calculate the cfm-per-person in the
space using the following formula:
Vop = N
Cs – Co
Where:
Vop = outdoor ventilation rate in cfm-per-
person
Cs = CO2concentration in the space
Co = outside CO2concentration
N = CO2production of individuals based
on age and activity level.
For most calculations the value for N is based on
adults undertaking office type activity (highlighted
in yellow in the chart below). Production Of CO2
at the same activity level varies less than 10%
over ages ranging from 6 to 65+ years old but
guideline values are provided in the table for
specific age groups and different activity levels.
As an example of how to use the formula above,
we will calculate the ventilation rate resulting from
a peak level of 675 ppm CO2when outside
concentrations are 400 ppm. The assumption is
that the space has adults engaged in office-type
activity. It is important to note that in the
equation, the CO2concentrations are expressed
in the decimal equivalent of parts per million.
Vop = 0.0106
0.000675 – 0.000400
= 3 8.5 cfm/person
If the number of people in the space is known
when the measurement is taken the total outside
air ventilation rate to the space can be calculated
by multiplying the occupancy times the number of
people in the space. This value in most buildings
will represent the fixed ventilation rate provided to
the space and can be used as part of an energy
analysis comparing the existing fixed ventilation
rate to a control strategy based on CO2
ventilation control.
Accessing Buildings For Energy Savings
Potential Based On CO2Control:
AirTest has just release an easy to use software
tool that allows you to compare the cost of
ventilation at a fixed ventilation rate (as
measured with CO2), with a CO2based
ventilation control strategy that modulates
ventilation rates based on occupancy in the
space. The program utilizes local climatic and
energy data to estimate the cost to precondition
outside air.
Contact AirTest at 888-855-8880 or at
get a coy of this software.
By using this predictive tool you can get an
estimate of energy savings and as a result
calculate payback and return-on-investment
resulting from a CO2upgrade on a particular
building. It is ideal to use as part of a proposal to
a building owner.
Age
Sleeping /
Resting
Sitting /
Standing
(Office)
Light Work
(Walking)
Heavy
Work
(Exercise)
1 - 5 years 0.0050 0.0060 0.0127 0.0201
6 - 11 years 0.0094 0.0112 0.0236 0.0375
12 - 65 years 0.0088 0.0106 0.0223 0.0353
65 + years 0.0079 0.0094 0.0198 0.0314
CO2Production For Various Ages & Activity Levels (cfm)

AirTest PT9250 & CO2Application Guide 10 of 12
Calibrate You And Your Customers:
The AirTest PT 9250 is an ideal tool that can be
used to calibrate you and your customers to CO2
and ventilation. Recently a contractor was
loaned a PT9250 with the cfm/person display
function. Within two weeks the building owner
walked many of his buildings, resolved three
indoor air quality complaints and decided to
retrofit two buildings that were undergoing
renovation, with CO2based ventilation control.
A written application guide like this one can be
very useful in understanding how to use and
interpret ventilation measurements with CO2.
However, hands on experience, and seeing and
sensing what various ventilation rates and
corresponding CO2concentrations are, can take
the place of a multi-hour training course.
Here are a few suggestions on how you can
calibrate yourself to CO2and ventilation.
•Experiment with how blowing in the vicinity
of the sensor will affect its reading. How
long does it take to recover?
•Find out what outside concentrations are
typically in your area. Check it out on a few
different days and locations. Does it matter if
you are close to a highway or major
intersection, near a lake, in the suburbs, or in
the middle of the city? Are outside
concentrations different above street level?
•Carry the PT9250 around with you for a day.
Measure at home, at the office, in meetings,
in your car or in an airplane. Note the CO2
and ventilation rate and see if you can sense
areas that have more fresh air than others. If
you note the time you are in various areas,
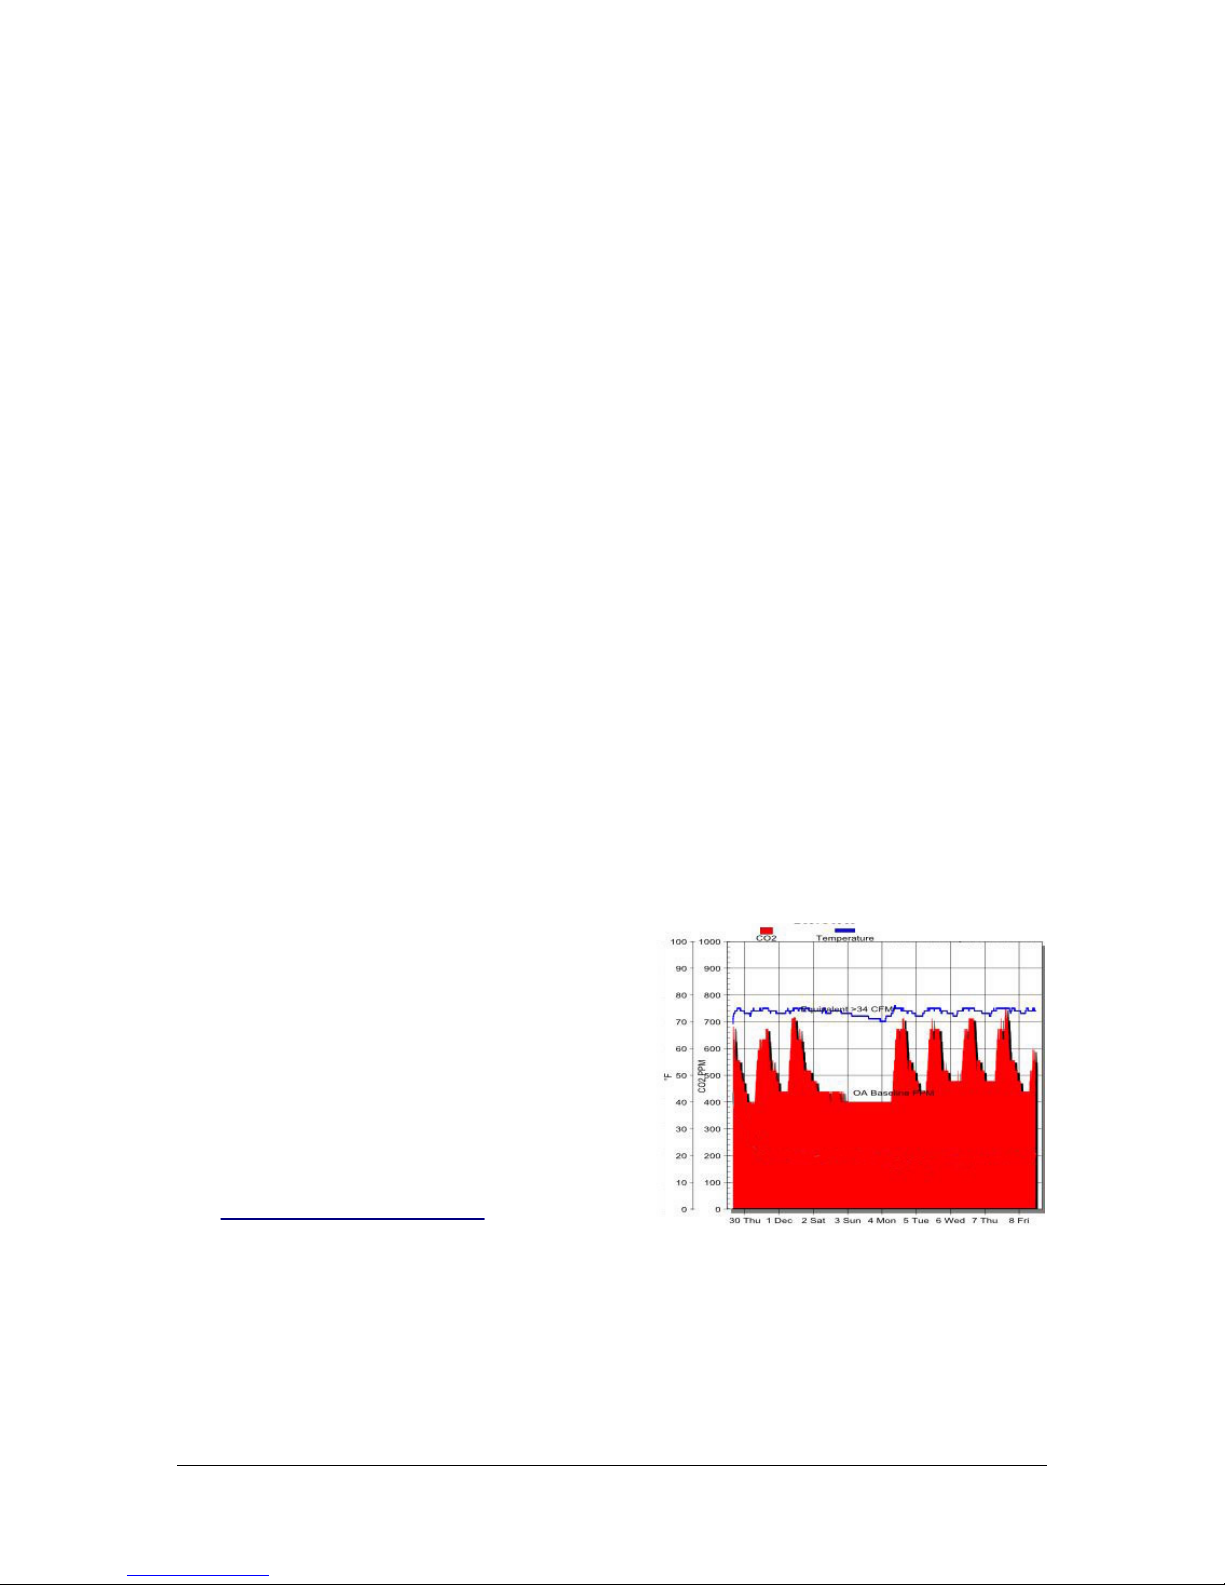
you can download the data logged
information for the day and see what the CO2
levels where throughout the day.
•When entering a space note how CO2levels
rise and eventually stabilize in a space.
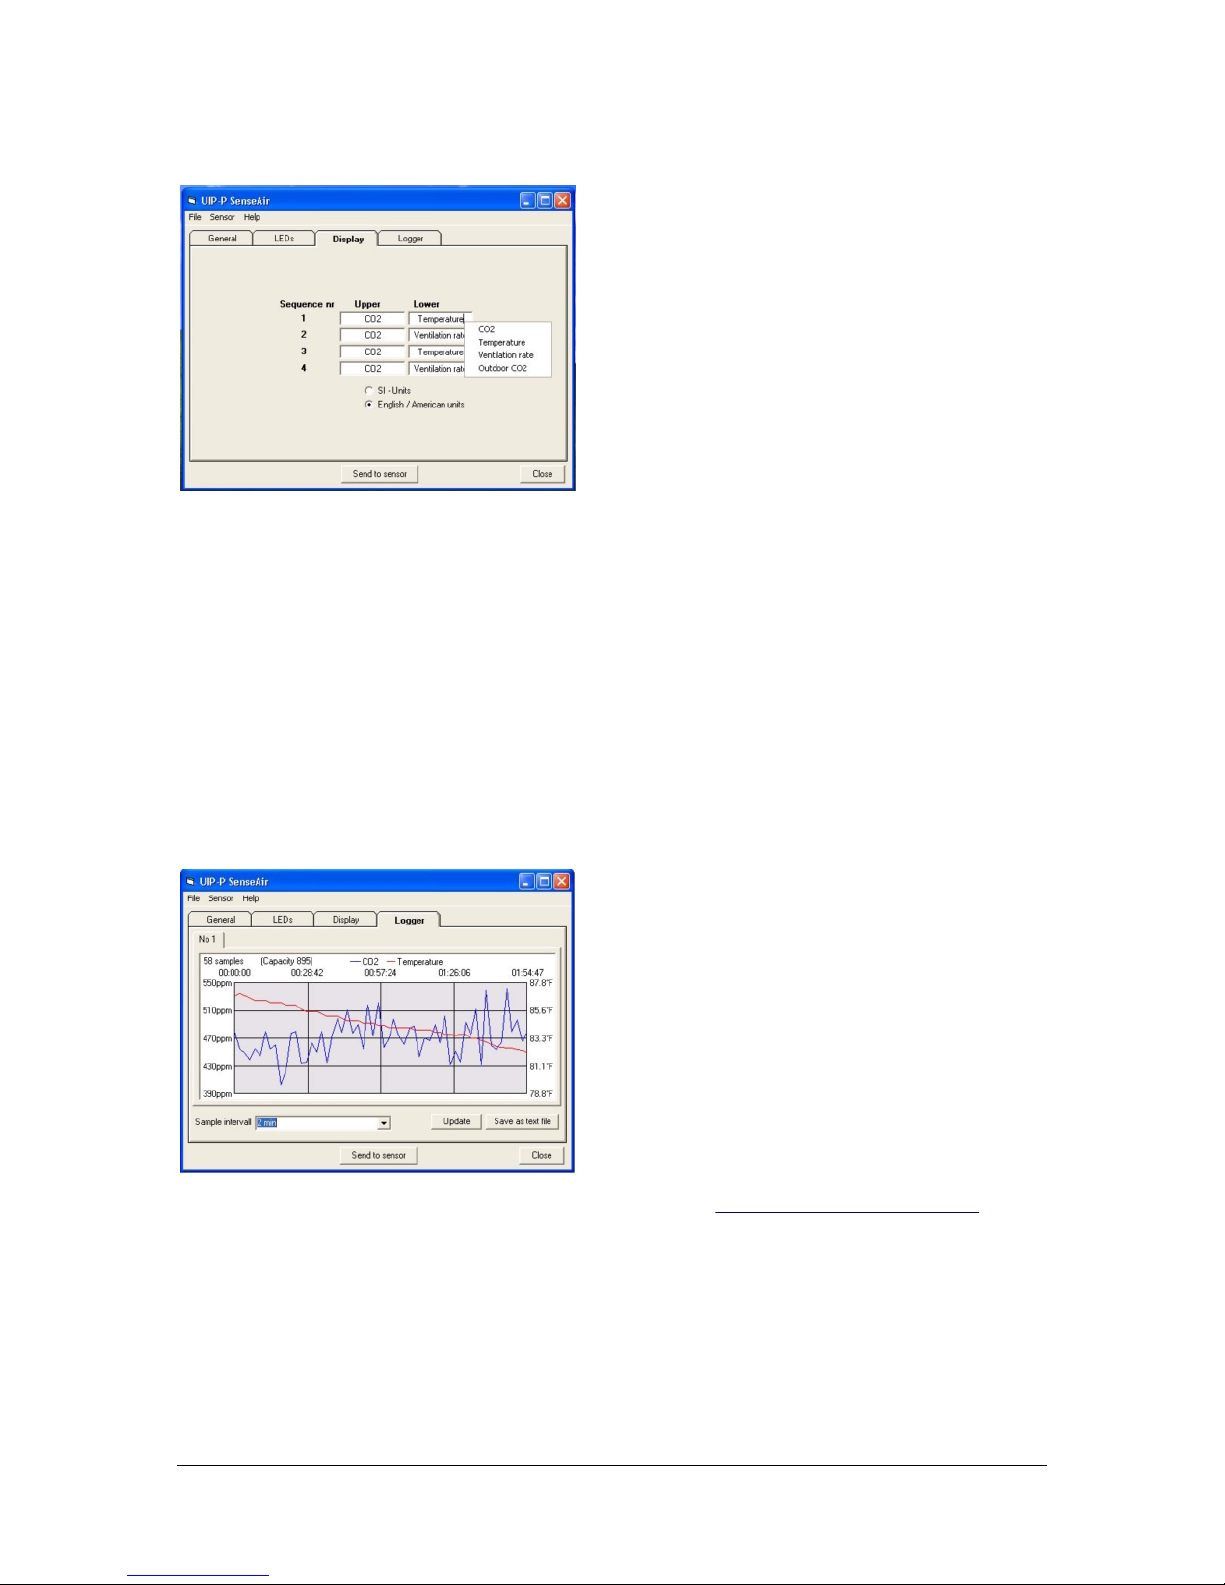
•Attach the PT9250 to your desk PC using
the software provided, and periodically press
update to view the history of CO2in the
space. You can also use this as a tool for
training others.
•Hold the PT9250 near the exhaust of a car
or truck. How much CO2is produced?
•Open a couple of carbonated drinks in a
closed room and see what happens.
•If CO2levels are high in the space, see how
quickly levels change when you open a
window or a door.
Dealing With IAQ Complaints:
Many symptoms related to indoor air quality
(IAQ) complaints can also be associated with
other physical ailments, stress, or emotional
issues related to the individual. If you are
involved in investigating a suspect IAQ problem
you can use the PT9250 to determine if
ventilation is a factor in the complaint or concern.
Most buildings by code must be provided with 15
to 20 cfm/person of outside air to ensure
adequate air quality. You can use the PT9250 to
benchmark your building to ensure you meet
these or other code required levels.
One school maintenance person keeps a number
of PT9250 sensors on hand to loan to teachers if
they have a concern with the ventilation rate in
their classroom. If by measuring over a few days
the teacher finds reduced ventilation rates, the
maintenance people can adjust air delivery to the
space. More often than not, the maintenance
person has found the ventilation is sufficient and
that use of the PT9250 convinces the teacher
that lack of fresh air is not the problem.
Baseline Monitoring As A Business:
Many building owners are now looking to third
parties to inspect and monitor their buildings to
ensure they are providing a good environment for
their tenants.
A number of contracting and consulting firms are
using the PT9250 to benchmark various areas of
a building several times per year. The data-
logging feature is ideal for providing a clearly
documented report on building operating status
as it relates to ventilation.
This process can provide peace of mind to
building owners and occupants and can also be
used to quickly identify potential problems with air
intakes or the mechanical systems within a
building.
I Smell Combustion Fumes:
While people produce CO2, it also is one of the
major components of combustion fumes (8 to
11% by volume). As a point of comparison, a
medium sized, residential high-efficiency furnace
produces as much CO2as about 160 people. If
CO2levels in a space seem excessively high
(e.g. over 4,000 ppm) unwanted combustion
fumes may be present. Here are some examples
of how elevated CO2concentrations can be used
as a diagnostic for combustion fumes:
•Check areas around building air intakes to
see if idling vehicles are venting into the
building (especially an issue with schools).

AirTest PT9250 & CO2Application Guide 11 of 12
•Check air intakes on rooftops to ensure flue
exhausts from kitchen or furnace vents are
not being drawn into air intakes.
•Use CO2to check for spillage of combustion
flues at water heaters or furnaces.
•Check the effectiveness of commercial
ventilation systems in removing combustion-
related CO2.
Odor Control In Garages:
In parking garages, bus garage and fire halls
carbon monoxide (CO) or nitrogen dioxide (NO2)
is often used to control ventilation. However due
to the effectiveness of catalytic converters much
less CO is now produced by cars and trucks. In
some cases combustion fumes may build up to
the point where there is no CO or NO2danger,
however odors associated with combustion are
noticeable and unpleasant. This is also a
common problem with diesel vehicles that
produce little CO but numerous other particulates
and smelly contaminants.
In many cases, odor perception of combustion
fumes will correspond to a CO2level. You can
use the PT9250 to determine the level of odor
perception in a facility. A permanently installed
CO2monitor in the space can then use this
threshold CO2level to activate fans to control
odors related to vehicle combustion.
Building Commissioning:
Building Commissioning is becoming common
practice in many areas of the country. The
PT9250 has a number of applications to building
commissioning:
•By calibrating the PT9250 to outside air or a
known source, calibration of CO2sensors
for ventilation control can be quickly
checked.
•If the space is occupied during the
commissioning period, ventilation levels in
each zone can be checked and compared
with design requirements.
Building Trouble Shooting:
Unusually high or low CO2levels in an occupied
space may indicate the malfunctioning of
mechanical equipment serving the space. For
example:
•A difference in measurements of CO2
between a space and a ceiling return plenum
may reflect excessive supply air duct
leakage into the plenum.
•Calculation of percentage of outside air in an
air handler can be performed using a
process identical to the differential
temperature method, except substituting CO2
levels measured.
•Determine if ventilation systems are
delivering adequate fresh air to a particular
zone based on its current occupancy.
•Improperly adjusted, or broken fresh air
dampers can often be identified if unusually
high or low levels occur within a space
during occupied periods.
•Periodic day-long data-logging of a major
occupied space or floor can give a good
indication of occupancy hours. This
information can be used to reset timer
schedules on equipment.
Planning For A CO2Retrofit:
Ok, so you have measured CO2in the space and
used the AirTest Energy Analysis Program to
identify a significant potential for energy savings.
This section briefly describes what typically is
involved in a CO2retrofit.
Location Of Sensors: Sensors should be
located in each major occupied space. Duct
mounting of sensors is not recommended for the
same reasons that temperature control does not
use in-duct sensing.
Control Algorithm: Typically CO2
concentrations are used to proportionately
modulate fresh air to the space. There are three
components to a control strategy:
1) Minimum Ventilation Rate: This is a low
level of ventilation provided to the space
during all occupied hours. Since CO2is
primarily related to people, this minimum rate
provides ventilation for non-occupant related
contaminants such as off gassing from
furniture and carpets. As a rule of thumb this
rate should be 30% of the Design ventilation
rate (Design rate = Design Occupancy X
Target cfm/person rate).
2) Start Of Control: Modulation of the air
delivery to the space should begin 100 ppm
to 150 ppm above outside concentrations
(e.g. 500-550 ppm).
3) Upper Control Point: The algorithm should
be designed so that the Design Ventilation
Rate (defined in 1) above), is provided when
the CO2concentration equal to the target
cfm/person ventilation rate is reached. For

AirTest PT9250 & CO2Application Guide 12 of 12
15 cfm/person this is approximately 1100
ppm and for 20 cfm/person the level is 930
ppm.
Multiple Zones Served By One Air Handler:
This could occur when a number of spaces are
served by a single rooftop or where fresh air to a
floor is controlled separately for each floor. In
this case control modulation of fresh air should
be based on the highest level measured in all of
the spaces served by the air handler.
AirTest also has products that will allow you to
control a VAV box based on CO2and
temperature.
Other Equipment: In a typical CO2retrofit you
may also want to include use of Variable Speed
Drives to modulate air delivery. Ideally the
system should be integrated with the existing
building control system. Most major control
manufacturers have CO2control routines
available thatwill run with their systems.
Further Application Reference: AirTest has
numerous articles and application notes available
on CO2control systems and their installation. To
download a one-page resource guide to articles
on CO2type this link into your browser or click on
the link if this is viewed on your computer.
http://www.airtest.ca/docs/article/co2reference.pdf
© 2003 AirTest Technologies Inc.
For more information On AirTest Products:
Call: 888-855-8880
Visit: http://www.AirTestTechnologies.com
Email: [email protected]
Table of contents