Ammonit WICOM-32 User manual

measuring wind power
WICOM - 32
Data Logger / Datenlogger - Series 32
METEO - 32X
METEO - 32
www.ammonit.com

Ammonit GmbH / 2005 - 2009 1
Warranty
All our products are carefully examined before delivery. If any problems
should arise we will do all we can to ensure that measurements can be
resumed in the shortest possible time. In the event of inappropriate use, or
mechanical or electrical overloading we provide no warranty. We accept no
liability for any form of consequential damage.
The right to make alterations is reserved.
Ammonit Gesellschaft für Messtechnik mbH
Wrangelstraße 100
10997 Berlin
Germany
www.ammonit.de
Manual Data Logger English
Edition 1.4.0.
Order No. WICOM-32: P2500.3
METEO-32: P2510.3
METEO-32X: P2520.3
February 2005

Ammonit Data Logger Manual
2 Ammonit GmbH / 2005 - 2009
Dear Customer,
The Data Logger from Ammonit is a piece of professional equipment with
which you can record the meteorological details of a location, and all the data
necessary for estimating the wind energy potential of a site. The logger can be
used flexibly and is suited for a wide range of applications. The implemented
standards of measurement evaluation and data security meet the
requirements of professional specialists. But the ease of use means that even
beginners can handle the Data Logger successfully.
Read the manual carefully before installation, and please remember that time
spent now setting up the logger properly might save you from losing important
data!
We hope you find this manual clear and easy to understand. If you have any
comments or suggestions please do not hesitate to let us know.
You can contact us at:
Tel.: +49 (0)30 600 31 88-0
Fax +49 (0)30 600 31 88-10
E-mail info@ammonit.com
Website: www.ammonit.com
We wish you success in your work!

Contents
Ammonit GmbH / 2005 - 2009 3
Contents
1.
Installation 5
1.1.
Overview 5
1.2.
Starting up 8
1.3.
Display & button functions 9
2.
Sensors 15
2.1.
Anemometer 15
2.2.
Wind vane 16
2.3.
Hygro/Thermo 16
2.4.
Air pressure 17
2.5.
Pyranometer 18
2.6.
Precipitation sensor 18
2.7.
Recording other inputs 19
2.8.
Ultrasonic anemometer 19
2.9.
External sensor power supply 20
2.10.
The Xtend-inputs 20
2.11.
Internal measurements 21
2.12.
External signal converters 21
2.13.
Logger cascading 22
3.
Data registration 23
3.1.
Measurement series 23
3.1.1.
Scan intervals 23
3.1.2.
Log interval 23
3.1.3.
Pre-evaluation in the log interval 24
3.1.4.
Storage organisation or time series 24
3.1.5.
Data format of measurement series 25
3.2.
Wind statistics 26
3.2.1.
Frequency distribution of the wind speed 27

Ammonit Data Logger Manual
4 Ammonit GmbH / 2005 - 2009
3.2.2.
Frequency distribution of wind direction 28
3.2.3.
Data format on the display 29
3.2.4.
Data format in PC 30
3.3.
Slow Motion Recorder (SMR) 32
4.
Data Logger and PC 35
4.1.
Software CALLaOLOG02 35
5.
Warnings 45
6.
Remote monitoring with GSM 47
7.
Energy supply 51
7.1.
Battery supply 51
7.2.
Connecting to an external power supply 52
7.3.
Solar power 53
7.4.
Energy requirements of your system 54
7.5.
Digital output 55
8.
RS485 Functions 57
8.1.
Online access to data 57
8.2.
WindTracker 58
9.
Maintenance and service 59
10.
Annex 61

Installation
Ammonit GmbH / 2005 - 2009 5
1. Installation
1.1. Overview
The Data Logger is a universal tool for the detailed registration of meteorological
data.
The different types of logger "series 32" differ only in the number of input
channels, i.e. the three connection sockets of the WICOM-32 are identical to
those of the METEO-32 and METEO-32X. So it is very comfortable to use larger
loggers in smaller measurement configurations, or alternatively to start using a
smaller logger in extended measurement systems.

Ammonit Data Logger Manual
6 Ammonit GmbH / 2005 - 2009
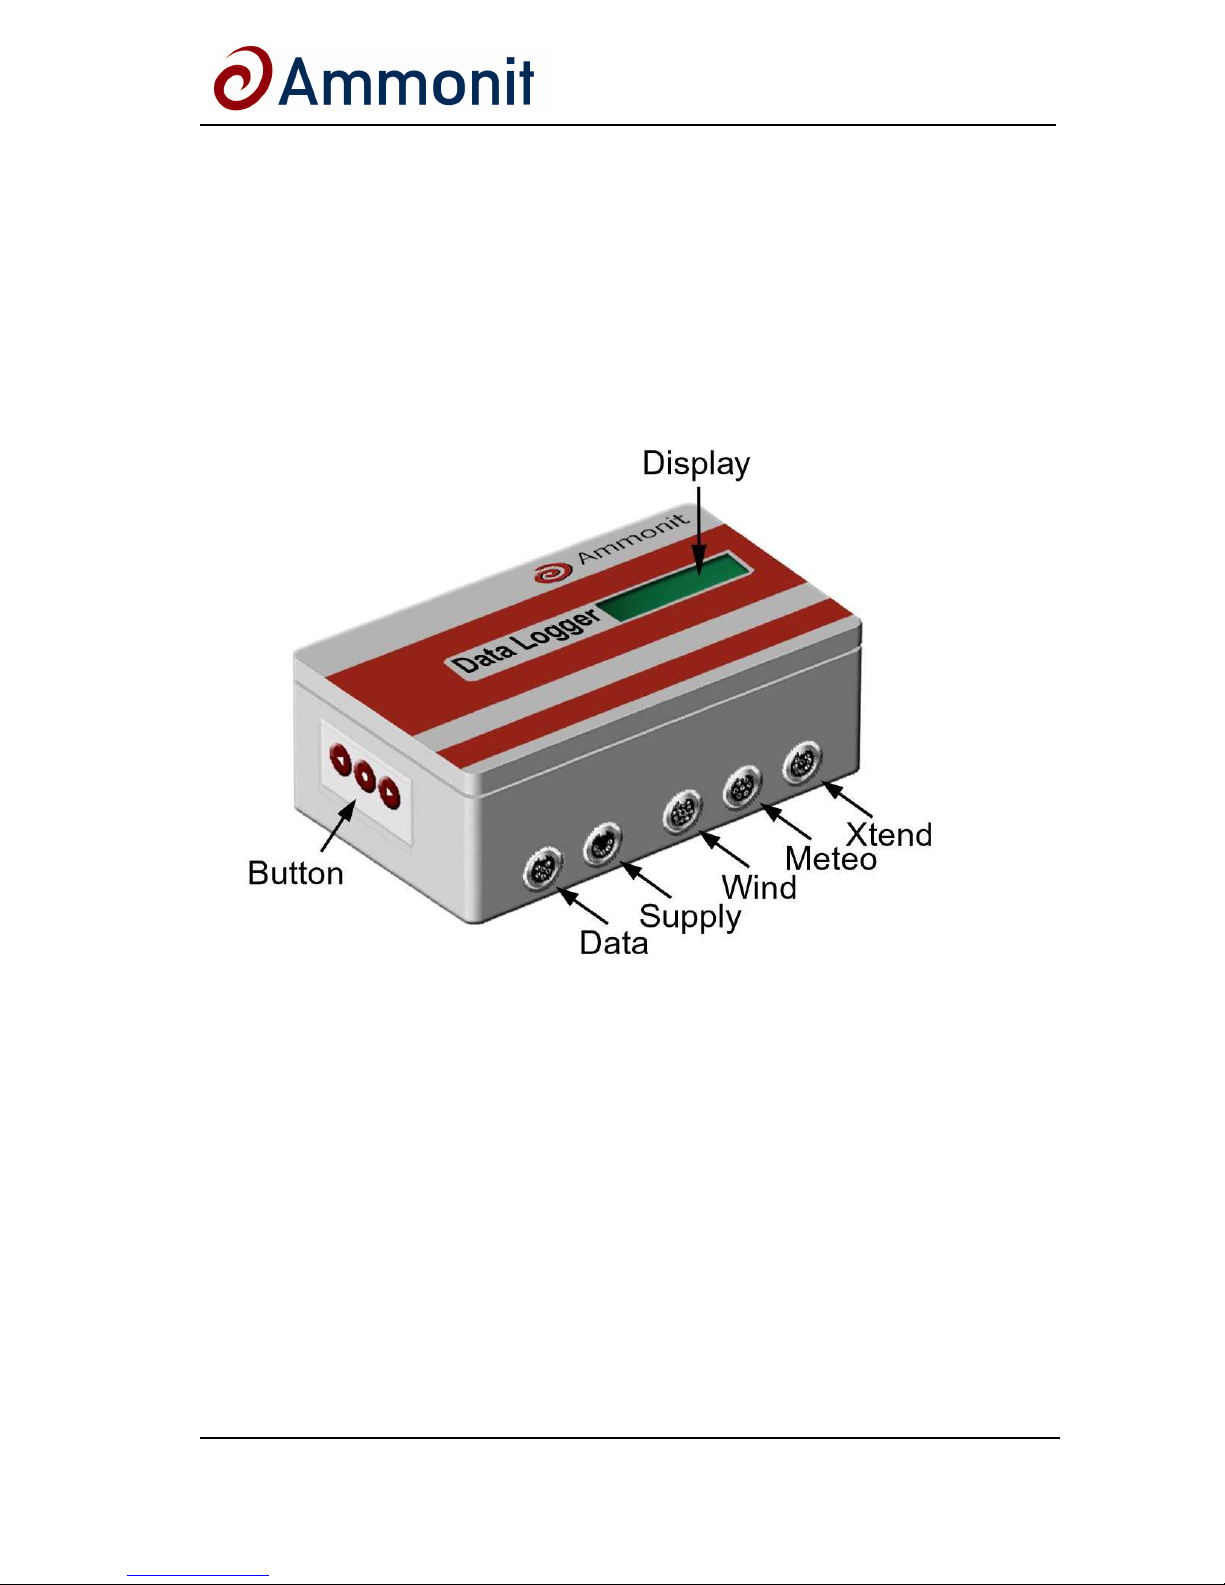
All Data Loggers have the following characteristics:
•Recording of measurements at programmable intervals
•Generation of wind statistics for energy predictions
•Recording wind data in slow motion over a short period with Slow
Motion Recorder (SMR)
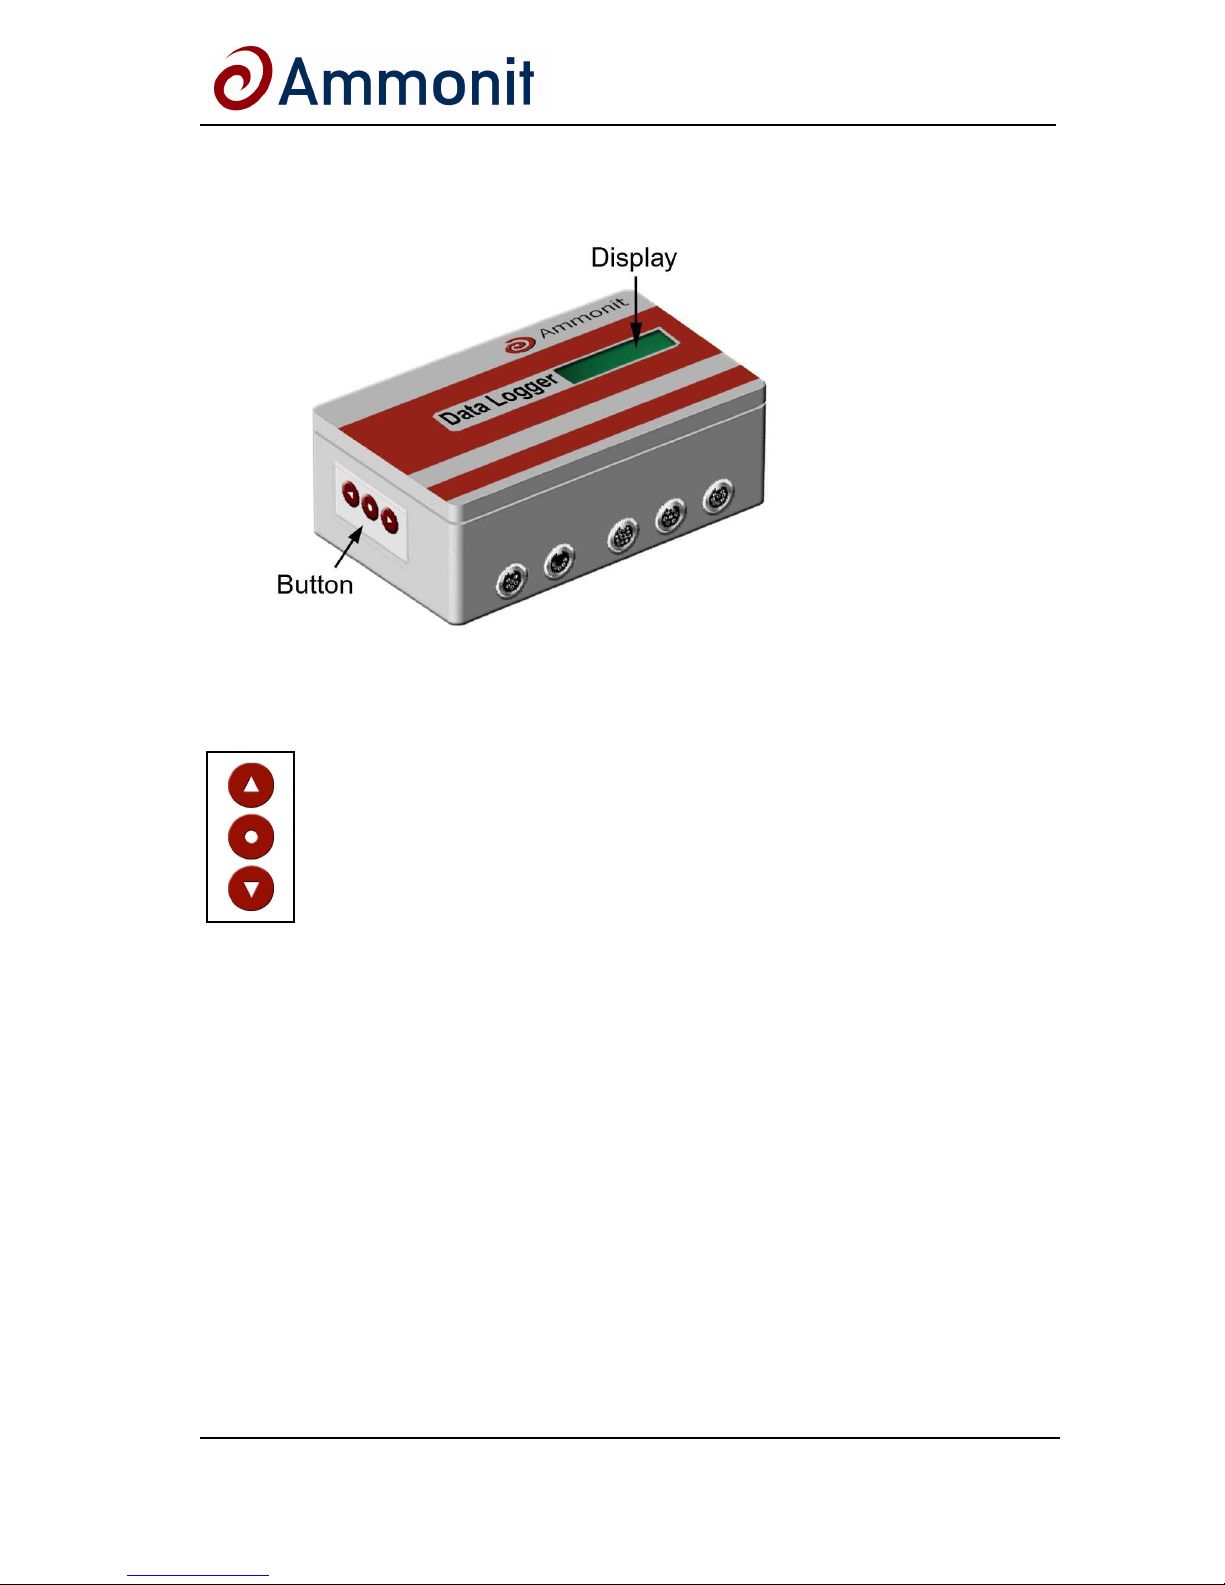
•3 buttons and a 2-line display for ease of use
•An operating range from –40°to +85°C
•Low-Low-power electronics and stand-by mode for energy
conservation
•Precision real-time clock < 25 ppm over the entire temperature range
(max. deviation approx. 1 minute / month)
•Powered by standard 9V-block batteries (lithium type optional)
•Socket for external 10-26 V DC supply
•Separate supply for wind sensors, with overload cut-out
•GSM-option for data transfer and e-mail / text messages
•Self-control of supply sources and internal temperature
•Plausibility testing of measurements
•Transmission of warnings (GSM option)
•Non-transient data storage / 1000 KB (approx. 500 000 values)
•Updating of user software via serial interface and GSM
•RS232-interface for rapid data transfer at 38400 baud
•Data compression by up to 30%
•RS485-interface for options, e.g. connection of ultrasound
anemometers
•User friendly Software with schematic layout for multi-logger
management

Installation
Ammonit GmbH / 2005 - 2009 7
Socket 5:
Xtend
8- pin
4 x 12-bit-ADC
2 x 16-bit-counter
2x Status
Socket 4:
Meteo
7- pin
1 x rel. humidity,
1 x air temperature,
1 x air pressure,
1 x global irradiation,
1 x precipitation,
sensor supply
Socket 3:
Wind
12- pin
3 x Wind strength
2 x Wind direction,
Sensor supply
Socket 2:
Supply
5- pin
External supply,
Switching output
RS485-interface
Socket 1: Data
6-pin
RS232-Data port
5-channel logger: WICOM-32
10-channel logger: METEO-32
18-channel logger: METEO-32X

Ammonit Data Logger Manual
8 Ammonit GmbH / 2005 - 2009
1.2. Starting up
After you have unpacked the logger, you should first familiarise yourself with the
basic functions. To do this you must connect it to a power supply.
Either inset the batteries, or
connect to an external e.g. 12 V DC supply.
You will find detailed information about the energy supply in Chapter "Energy
supply".
The display then comes on and as the system starts it shows:
A
Am
mm
mo
on
ni
it
t
B
Be
er
rl
li
in
n
C
Co
ol
ld
d
S
St
ta
ar
rt
t.
..
..
.
The Data Logger now begins a "Cold start", i.e. the pre-set parameters are
checked and loaded. The display then shows the type of logger:
e.g.
S
Sy
ys
st
te
em
m
M
Mo
on
ni
it
to
or
r
*
*
M
ME
ET
TE
EO
O-
-3
32
2
V
V1
1.
.9
9
and the measurement operations begin.
Ex works, the Data Logger has the following default settings:
•Central European Time (CET) / Central European Daylight Savings
Time (CETDST)
•All available input channels are activated (mean values)
•Measurement interval = 1 second
•Storage interval = 10 minutes

Installation
Ammonit GmbH / 2005 - 2009 9
Up
Select
Down
1.3. Display & button functions
The Data Logger has a 2-line display and three buttons on the left-hand side.
The buttons can be used to display various information and
to carry out test functions, making it easier to check the
system during installation and maintenance. On-site you
only need to check the system is operational and start
measurement simply by pushing a button. There is no need
to expose sensitive equipment (notebook, PDA) to the
weather.
In order to save power, the display only comes on when necessary.
Display on: Press any button
Display off: Press and hold the
button for about 2 seconds (Select)
The display switches off automatically 30 minutes after the last button was
pushed.

Ammonit Data Logger Manual
10 Ammonit GmbH / 2005 - 2009
The displays are grouped according to topics. You can move through the
sequence of topics by briefly pressing down the Select Button
as often as
required.
Topic Contents and functions
System
Monitor
Reports on the current status of the logger
(e.g. time, external power supply etc.) and
the display of the measurement values of all
activated input channels
Warnings
Display of warnings and error reports
GSM
Modem
Manual logging on to a GSM network and
display of connection status etc.
Digital
Control
Display and manual control of the digital
switching output
Statistics
Output of the wind data statistics, as
required for wind energy predictions
Reset
Resets all data records and restarts
measurements
When you have reached "Reset", pressing the
-button again returns you to
the first topic "System Monitor".
When you have selected a topic, then you can press the
and
-arrow
buttons (Down and Up) to see the individual displays or to reach special
functions. The top line of the display will always show the chosen topic, and the
data you need will be displayed in the bottom line.
S
Sy
ys
st
te
em
m
M
Mo
on
ni
it
to
or
r
*
*
A
An
ne
em
mo
o1
1:
:
5
5.
.8
8
m
m/
/s
s

Installation
Ammonit GmbH / 2005 - 2009 11
System Monitor
This is where the current values are displayed: this is particularly useful during
the installation and when checking the system.
A new measurement is shown by the brief appearance of a star (*
*) in the first
line of the display. Note that only activated Input Channels will be displayed, and
the measurements will be updated at the selected intervals:
Display
Down
Up
Logger type & version
Date & time
Supply voltage
No. of stored warnings
Measurement Channel 1
Measurement Channel 2
...
Measurement Channel n

Ammonit Data Logger Manual
12 Ammonit GmbH / 2005 - 2009
Warnings
Here you can see the stored warnings. For example, these might show if an
anemometer has not given an impulse for some time, or if a defective wind-vane
has been identified.
Warnings are only displayed once, and will be deleted if the cause has been put
right. If the fault occurs again then the error report will be repeated.
Display
Down
Up
Number
Warning 1
Warning 2
Etc.
GSM Modem
The Data Logger can be equipped with a GSM System, so that data can be
downloaded and remote checks carried out. Normally the GSM System will be
activated at a chosen time. There are useful help functions which allow use
control the operation of the modem manually during installation.
Display
Down
Up
Modem not registered
Activation phase
(Modem On, Send
PIN…, Search Net...
etc.)
Interrupt
activation
Modem on line
(Network-Name
-/-
) Switch off
modem

Installation
Ammonit GmbH / 2005 - 2009 13
Digital Control
The socket for the external power supply includes a pin for a switching output
which can be controlled remotely by PC-software or GSM/SMS. The control
signal can be for example to activate a sensor heating or a modem. Here this
signal can be switched on or off manually.
Display
Down
Up
OFF (Pin is open)
ON (Pin is GND)
Statistics
The wind statistics required for energy applications can be read off the display
and noted. In the first line you will see in parentheses what the second line
displays, for example (run) refers to the statistics currently being set up.
Display
Down
Up
Logger no. & start date
No. of evaluations
Mean - Anemometer 1
Max. - Anemometer 1
Frequency 0..1 m/s
Frequency 1..2 m/s
Etc.
See description of
statistical data

Ammonit Data Logger Manual
14 Ammonit GmbH / 2005 - 2009
Reset
The Reset function starts the logger again and deletes all the existing data. It is
normally only needed after the installation or relocation of the Data Logger to
restart the system. Re-setting involves pressing the buttons in a specific
sequence in order to prevent unintended or unauthorised deletion of data.
Display
Down
Up
reset?
Reset?
REset?
etc. (until the display
shows RESET)
RESET!
Look out! 1. Press
down and
hold!
3. Release
button!
2. Press down
in addition!
R E S E T !
or "u missed it", if it
failed
The configuration parameters are not deleted or changed using the "RESET"
function. For information about these changes see the chapter on
"Maintenance".

Sensors
Ammonit GmbH / 2005 - 2009 15
2. Sensors
The connections to the sockets of the individual logger types are 100%
compatible. The WICOM-32 can register three wind speeds and two wind
directions, whereas the METEO-32 also has additional sockets for humidity,
temperature, air pressure, global irradiation and precipitation and the METEO-
32X has additional inputs which are not pre-defined (ADC, Counter, Status).
Details of the wiring to the sockets is provided in the Annex.
2.1. Anemometer
To measure wind speed attach an anemometer with impulse output. The
characteristic of the anemometer is given in the form of a linear equation with a
gradient and an intercept at 0 m/s:
v = a ·I + b
v = Wind speed
a = Gradient of characteristic
I = Pulse rate
b = Intercept of characteristic
The parameters are entered with the "CALLaLOG" software: the gradient is in
0.1mm/pulse rate and the intercept in cm/s.
The Data Logger counts the pulses of the anemometer signal and calculates the
wind speed (in m/s) to one decimal place. The individual measurement values
therefore represent exact means for each completed measurement interval.
The display shows the wind speed in [m/s]
S
Sy
ys
st
te
em
m
M
Mo
on
ni
it
to
or
r
*
*
A
An
ne
em
mo
o1
1:
:
5
5.
.8
8
m
m/
/s
s
All wind speed values are stored in dm/s, so that they must be divided by 10
before being used (this can be done automatically by the "CALLaLOG" program
during data transfer).

Ammonit Data Logger Manual
16 Ammonit GmbH / 2005 - 2009
2.2. Wind vane
To register the wind direction attach a serial opto-electronic sensor or a wind
vane with a potentiometer, which should have a total resistance of 2000 Ω-
10 k Ω. The potentiometer is addressed ratiometrically, to make allowance for
temperature and cable influences on the measurements. Results are
independent of fluctuating supply voltages and the resistance of the
potentiometers. The resolution of a 2000Ω-vane is 1°with a precision of ±1°
over the entire temperature range. Calibration is not necessary, but may help to
correct for any offset of the wind vane introduced during the installation.
d = U + O
d = Wind direction
U = Measured value
O = Offset (Angular deviation to North)
The measurement values are presented in 1°-steps from 1°... 360°, measured
clockwise:
V
Va
an
ne
e1
1
:
:
3
34
42
2°
°
Any implausible measurement values are documented as "777".
The directional data is stored in 1 degree steps. Mean values are calculated,
and of course the mean of "1°" and "359°" is record ed as "North (360°)" and not
"180°"!
2.3. Hygro/Thermo
These inputs are only available for the "METEO" versions.
Either a simple temperature sensor (e.g. the "TPC", P6471) or a combined
hygro / temperature sensor (e.g. the "KPC", P6831) can be connected directly to
the "Hygro/Thermo" socket.
The temperature sensor contains a resistance thermometer, and the
measurement is converted by the sensor into a voltage proportional to the
temperature. For the correct evaluation of the measurement signal enter the
gradient and the intercept of the sensor characteristic as parameters.
T = a ·U - b
T = Temperature
a = Gradient
U = Measured voltage
b = Intercept
The gradient is in °C/V. The temperature reading in °C for 0 V output voltage is
entered as the Intercept value.

Sensors
Ammonit GmbH / 2005 - 2009 17
The display shows the value in °C:
T
Te
em
mp
p.
.1
1:
:
1
18
8.
.4
4°
°C
C
Temperature data is stored in tenths of a Kelvin. [0°C = 273,15 Kelvin]
The humidity sensor consists of a capacitor sensor element with an integrated
converter circuit.
For the calculation enter the gradient in
Volt
humidityrel.%
.
F = a ·U
F = Relative humidity
a = Gradient
U = Measured voltage
The display shows the relative humidity as a percentage:
H
Hy
yg
gr
ro
o
:
:
4
45
5
%
%
The relative humidity values are stored in % .
2.4. Air pressure
These inputs are only available for the "METEO" versions.
A barometric sensor can be attached with an active analog output, such as the
Vaisala "PTB100A" or the "AB60" from Ammonit. The output signal is
proportional to the air pressure. You have to enter the start of the measurement
range [in hPa] and the gradient of the sensor characteristic in [hPa/V] as
parameters.
P = a ·U + b
P = Air pressure
a = Gradient of characteristic
U = Measured voltage
b = Intercept of characteristic
The display shows the air pressure in hPa:
B
Ba
ar
ro
o:
:
1
10
01
17
7
h
hP
Pa
a
The data is stored in hPa.

Ammonit Data Logger Manual
18 Ammonit GmbH / 2005 - 2009
2.5. Pyranometer
These inputs are only available for the "METEO" versions.
Pyranometer, e.g. from the "CM" series of Kipp & Zonen, will be connected via
pre-amplifier which aligned the µV signal to the data logger (0 - 1.2V). The
output signal is proportional to the global radiation.
For the calibration you must enter the gradient of the characteristic in
[ W/m²/V ] as parameters.
R = a ·U
R = Global radiation
a = Gradient
U = Measured voltage
The display shows the global radiation in W / m²
P
Py
yr
ra
an
no
o:
:
9
92
26
6
W
W/
/m
m2
2
The global radiation values are stored in W / m².
2.6. Precipitation sensor
These inputs are only available for the "METEO" versions.
Registering precipitation requires an impulse input, for example from a "Rain
Gauge" from R.M.Young (P6720/1).
For the calibration you must enter the gradient of the characteristic in [µm /
impulse].
N = a ·I
N = Amount of precipitation
a = Gradient of characteristic
I = No. of impulses registered
The display shows the precipitation during the last measurement interval
[0.1 mm]:
R
Ra
ai
in
n:
:
4
4.
.8
8
m
mm
m
Data is stored in [0.1 mm/minute], so that before evaluation the numbers must
be divided by 10.

Sensors
Ammonit GmbH / 2005 - 2009 19
2.7. Recording other inputs
The Data Logger converts the input signals of the sensors into predefined
measured variables. The impulses of an anemometer are converted for example
into m/s based on the entered calibration values. If you set the calibration factor
Slope = 0, thereby the internal conversion is switched off and the measurement
categories are indicated as master data. (Signal inputs in Hz with resolution of
0,1 Hz, Analog inputs in mV)
Master data of measurement categories
Input Measurement range Resolution
Anemometer 1...3 0 ... 1000 Hz 0.1 Hz
Rel. humidity 0 ... 1200 mV 0.1mV
Air temperature 0 ... 1200 mV 0.1mV
Air pressure 0 ... 5000 mV 0.5 mV
Rain 0 ... 1000 Hz 0.1 Hz
2.8. Ultrasonic anemometer
All Ammonit Data loggers can be used in combination with meteorological
ultrasound sensors from Gill Instruments for wind measurements. These high-
resolution, one to three dimensional sensors (WindSonic, WindObserver, or
WindMaster) are connected via the RS485 interface (2-wire cable) and activated
via their own channel in the "Channels“ window of the CALLaLOG02 software.
Sonic Hor.: Horizontal wind speed in cm/s
Sonic Dir.: Wind direction in degrees
Sonic Ver.: Vertical wind speed in cm/s (nur Master)
Note that the vertical wind speed is stored with an offset of "1000". Three-digit
values indicate downward air flows.
Before connecting up the sensors these should be configured appropriately. The
necessary settings are shown in the connection plan. Further information about
the sensors can be found in the anemometer manuals.
This manual suits for next models
2
Table of contents
Popular Other manuals by other brands

MTM HYDRO
MTM HYDRO Professional Foam Lance 14.0263 user manual

lifeCharge
lifeCharge JuicyPack 16,800 mAh user guide

SentrySafe
SentrySafe SFW123ES owner's manual

Boostaroo
Boostaroo R234 supplementary guide

Interpet
Interpet Insight LED Instruction manual and set up guide

Steam-e
Steam-e Gum Remover operating instructions