Fakopp ArborSonic3D User manual

Manual for the
ArborSonic3D
acoustic tomograph
2019.

1
ArborSonic 3D
User's Manual
v6
January 2, 2019

2
Table of Contents
Table of Contents ................................................................................................................................................................ 2
Introduction.......................................................................................................................................................................... 3
Manufacturer information .............................................................................................................................................. 3
Principle of operation ....................................................................................................................................................... 3
Hardware –System parts ................................................................................................................................................ 4
Hardware –Setup............................................................................................................................................................... 5
Hardware –Handling the Piezo Sensors................................................................................................................... 6
Maintenance..................................................................................................................................................................... 6
Fixing................................................................................................................................................................................... 6
Measurement................................................................................................................................................................... 6
Removal ............................................................................................................................................................................. 6
Hardware –Amplifier boxes .......................................................................................................................................... 7
Hardware –Battery Box................................................................................................................................................... 7
Hardware –Bluetooth and serial connection.......................................................................................................... 8
Establishing Bluetooth connection to the Battery Box................................................................................... 8
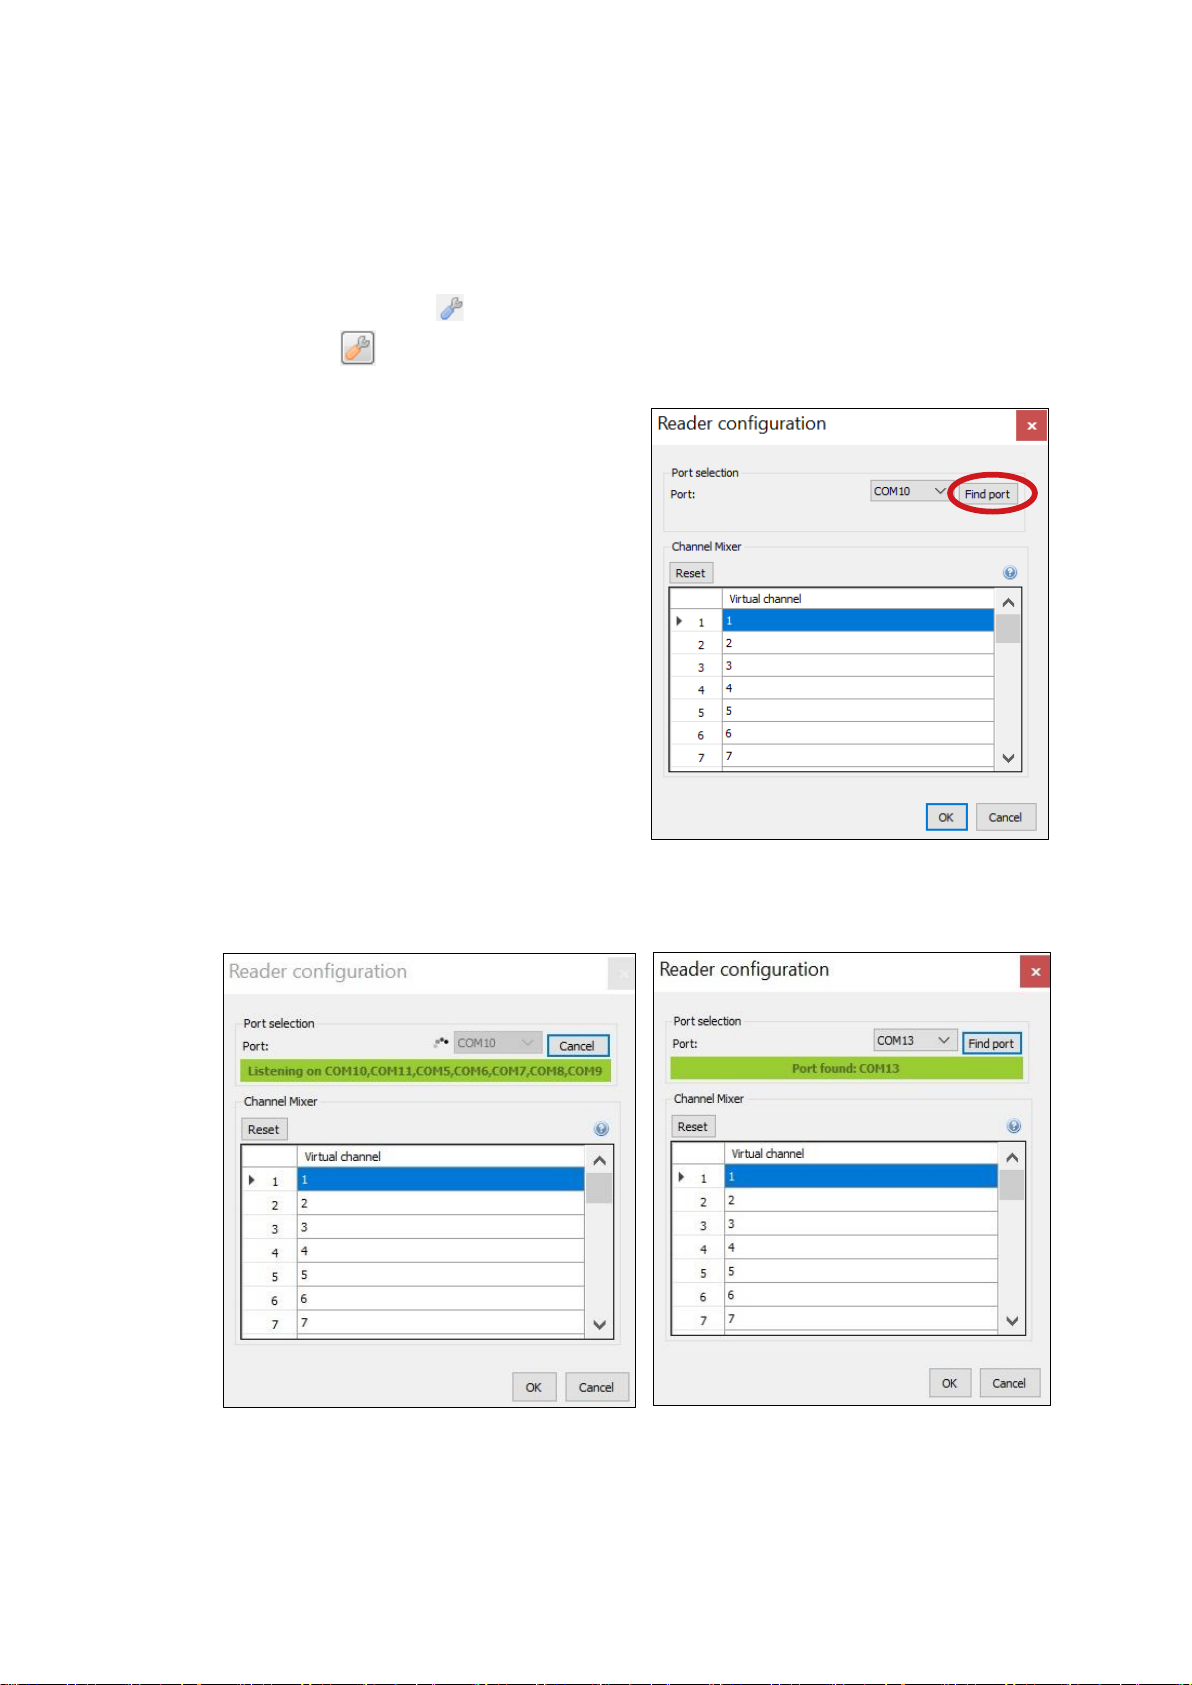
Selecting COM port........................................................................................................................................................ 9
Software –Basics ..............................................................................................................................................................11
Software –Application Settings..................................................................................................................................12
Software –Tree Properties...........................................................................................................................................13
Software –Sensor Geometry –Basics ......................................................................................................................15
Software –Sensor Geometry –Circular, Elliptical, Rectangular and Irregular .......................................16
Circular.............................................................................................................................................................................16
Elliptical ...........................................................................................................................................................................17
Rectangular.....................................................................................................................................................................17
Irregular...........................................................................................................................................................................18
Software –Sensor Geometry –Compass.................................................................................................................18
Description .....................................................................................................................................................................18
Usage.................................................................................................................................................................................18
Software –Time Data......................................................................................................................................................19
Software –Tomograms –Single-layer mode.........................................................................................................20
Software –Tomograms –Multi-layer mode ..........................................................................................................21
Software –Biomechanics...............................................................................................................................................22
Software –Image Container .........................................................................................................................................24
Software –Generating reports....................................................................................................................................25
Report generator –earlier version.......................................................................................................................25
Testing and troubleshooting........................................................................................................................................26
Testing before going to the field............................................................................................................................26
Most common troubles and solutions.................................................................................................................27
Advice and safety regulations......................................................................................................................................30
Maintenance........................................................................................................................................................................31
Guarantee.............................................................................................................................................................................31

3
Introduction
Welcome as a new ArborSonic 3D owner. ArborSonic 3D is designed to detect hidden holes
and decay in trees by non-destructive acoustic testing.
Manufacturer information
ArborSonic3D is manufactured by:
Company: Fakopp Enterprise Bt.
EU tax number: HU22207573
Address: Fenyo 26.
City: Agfalva
ZIP: 9423
Country: Hungary
Web: http://www.fakopp.com
Phone: +36 99 330 099
Principle of operation
•Several Sensors are placed around the trunk, which are coupled to the tree by steel
nails.
•Each Sensor is tapped by a hammer.
•The unit measures the travel-time of the sound wave generated by the hammer tap
between each sensor.
•If there is a hole, then the sound waves have to pass around the hole and therefore
it requires longer time to reach the opposite sensors.

4
Hardware –System parts
Piezo Sensors
Amplifier Boxes (black)
Battery Box (gray) containing the Bluetooth transmitter
Link Cables
Caliper (optional)
Sensor Remover
Tape measure
Steel and rubber hammers
Case

5
Hardware –Setup
•Drive the Sensors into the trunk, perpendicular to the direction of the growth in a
counter-clockwise order as seen above.
•Connect the Sensors to the Amplifier boxes.
•Connect the Amplifiers in a line. The bottom connector goes to the side connector
of the next box.
•Connect the Battery Box to an Amplifier on any end of the line.
•Establish cable or Bluetooth connection to the PC

6
Hardware –Handling the Piezo Sensors
Maintenance
•Always keep the nails, sensor head and the hammer clean, because dirt influences
the coupling and time reading.
•The numbers on the sensors are just decoration, you can change them freely,
however the numbers on the amplifier boxes are important.
Fixing
•Use the rubber hammer to fix the sensors
•The sensors need to go through the bark into the wood
•Good coupling between the nail and the wood is essential. The coupling is good if
the sensor head can’t be rotated with 3 stretched fingers. If the sensors can rotate
additional hammering is needed to couple the sensors well.
•The sensors need to be in intact wood material, not in decayed material.
•The software requires the penetration depth (PD parameter on the Sensor
Geometry tab) of the sensors. This parameter is very important in case of small
diameter trees.
•The sensor nails need to point to the center of the trunk; however, this is also not
very critical.
•The sensors need to be placed in the same plane. However, this plane doesn’t
necessarily have to be horizontal. The plane should be perpendicular to the growth
direction. In case of tilting trees, the plane will be tilted as well.
Measurement
•Use the steel hammer for generating the readouts by tapping on the sensor heads.
•Remove the tape measure before tapping because it may cause an acoustic short-
circuit.
•Always tap on the center of the sensor head in the nail direction. If you accidentally
tapped the side of the sensor, remove the data and tap again.
•Tap with uniform strength. Apply more power for large trees. Tapping power is not
very critical, but similar power is recommended. Tap with loose wrist.
•Never tap on the cable connection part of the sensor.
Removal
•First disconnect the sensor cable from the amplifier box. Then disconnect the
cables. For removing the sensors use the sensor remover tool if possible.
•When removing by hand, first rotate the sensors and then pull. Always pull in nail
direction.
•Never pull the cable.
•Never use any support to remove the sensors because it may break or bend the
nails.

7
Hardware –Amplifier boxes
•When building up, first fix the sensors,
then the amplifier boxes and finally the
link cables
•Make sure to apply correct connector
orientation when connecting the link
cables. Don't force them.
•Amplifier numbering is essential. Don’t cross the cables
because it will mess up the whole measurement.
•Connect the bottom connector of an amplifier box to the
side connector of the next amplifier box.
•Never move the sensors with attached amplifiers because
it may damage the cable connectors.
•When taking apart, first remove the cables, then the
amplifiers and finally the sensors
Hardware –Battery Box
•Contains the 9V battery and the Bluetooth transmitter.
•Keep the Battery Box turned off while connecting the
Amplifier Boxes.
•The Battery Box can be connected to any amplifier box.
•Make sure to apply correct polarity when changing
battery.
•Any regular or rechargeable 9V battery can be used.
•The LED blinks for 5 seconds after turning on. This is the time required for the Bluetooth
module to warm up.
•If the battery is low, the LED blinks continuously.
•The battery should be well charged.
•It is recommended to turn on the battery box only for the measurement (and keep it turned
off during the rest of the time).
•The battery should be in the proper position.
- +

8
Hardware –Bluetooth and serial connection
•The Battery Box of the device is also responsible for collecting and transmitting data to the
PC (or to an Android smartphone). There are two basic ways to establish connection with
PC: over a Serial-USB cable or over the built-in Bluetooth module (for the smartphone only
Bluetooth connection is possible).
•There are two steps in setting up the connection. The first is to install the USB cable or the
Bluetooth device in Windows. In either way a COM port is assigned to the connection with
a specific number. The second step is to set this number in the software. The software
provides support for both steps.
•The part below deals with setting up the connection over Bluetooth and does not apply if
you choose to use a Serial-USB cable. Please keep in mind that the maximum Bluetooth
range is 30 feet / 10 meters. If you need extended range, longer cable can be used between
the Amplifier Box and the Battery Box.
•For cable connection you may need to install a driver for the serial port itself (the installer
is attached on CD and on pen drive). Then check the ports in the device manager to find out
the proper number of the COM port. This will be used by the device and should be told to
the software. (Note that the number of the COM port depends on the used USB port. If you
connect the cable to another USB port, the COM port’s number will change.)
Establishing Bluetooth connection to the Battery Box
•If the automatic method does not work for any reason, the device needs to be installed
manually in the Control Panel or on the Tray. The final goal of the installation is to set up
and find the COM port number of the device and later set it in the software. (If you are using
an external USB Bluetooth Module, it is recommended to always connect it to the same USB
port.)
•Turn on the Battery Box, start adding a New Bluetooth device in the Control Panel or on
the Tray's Bluetooth Devices function. The device name is ArborSonic 3D.
•The PIN code of the device is 1234.
•The device should be installed by Windows and one or two COM ports should be detected.
Remember the number of the installed COM port. (You can check the Device Manager for
the used COM ports before and after installing the ArborSonic3D device as well, to see
which the new COM ports are belonging to the ArborSonic3D.)
•Start the software.

9
Selecting COM port
•The second step is to select the correct COM port in the software. This applies regardless
of using the device over Bluetooth or Serial-USB cable. Connect the battery box and turn it
on.
•Start the software, click to go to the Application Options and choose the Reader Device
tab. Click the icon to open the Reader configuration window.
•Wait until all the available COM ports are listed, this can take up to a minute.
•If you remember the COM port when your
Bluetooth or Serial-USB cable device was
installed, just select it and close the panel by
clicking OK.
•Otherwise, if you don’t know the number of
the COM port, there is a useful support to find
it out. Turn on the Battery Box and connect at
least one amplifier box with at least two
sensors. You can do this in the office with any
piece of wood, no real tree is needed.
•Click the Find Port button. This will open all
the available COM ports and start listening to
any data that can be received. Tap on any
(connected) sensor to generate some data.
•If any data is received, the software selects
the COM port where it was received, and you get a notification. At this point everything is
set up for the connection. Now you can click OK to close this panel.

10
•Other possibility is to use the Port Diagnostics on the same panel (on the Reader device tab
of the Application Options). Click to this button.
oIt opens the SerialPort
diagnostics window. The
program automatically looks
for the used COM ports. (It can
take a few minutes.)
oGenerate data by tapping the
connected sensors.
oThe COM ports are listed on
the top and if any data could be
received it is shown in the
window. The raw data can be
saved if it is needed.
oBy clicking Close the window
will close. If the COM set in the program is not same which sent the last data, the
SerialPort diagnostics the program will ask if the COM port can be changed. Push
Yes if the last received data was from the ArborSonic device.
oThe information sent by ArborSonic starts with IN (referring to incoming data),
followed by two numbers which refers to the Amplifier Box which sent the data (00
is for the Amplifier Box with 1st and 2nd sensors, 01 is for the Amplifier Box with 3rd
and 4th sensors, 02 is for the Amplifier Box with the 5th and 6th sensors and so on).
The following 2 four-digit numbers are the time data detected by the proper
sensors.
For example a line can be IN 03 0205 0311 which means the Amplifier Box with the
7th and 8th sensors sent the data 205µs from the 7th sensor and 311µs from the 8th
sensor.
•To check if everything is fine, restart the program, create a dummy layer with some dummy
geometry parameters (the simplest is to choose a circle), and go to the Time Data page.
(You may have to push „Start”.) If the connection is set up successfully, a green “Reading
device (COM_)” message should appear. Start tapping the sensors and you should see rows
of numbers arriving in the table below.

11
Software –Basics
•The latest version of the software can be downloaded at http://www.fakopp.com.
•The software can be installed to any PC with Windows 7 or higher.
•The software includes the following:
oSelecting parameters of the tree (species, ...)
oRegistering the geometry of the sensors
oCollecting the time data from ArborSonic 3D over Bluetooth or via USB cable
oComputing the internal cross-sectional tomogram
oPerforming safety factor calculations
oGenerating a report file for customers
oSaving and opening previous projects
•The steps of a measurement are:
1. Choosing the measurement Layer on the trunk.
2. Starting the software and selecting the tree species.
3. Placing the sensors (to the proper positions calculated by the software when using
circle, elliptic or rectangular geometry) and registering the sensor geometry
manually or with the Bluetooth Caliper (in case of irregular geometry).
4. Collecting time data by tapping on each sensor.
5. If measurements at several layers are required, choose the next layer and repeat
the previous two steps.
6. Evaluating the cross-sectional maps, tomograms.
7. Performing stability computations.
8. Saving and exporting data to the report file which can be printed later.

12
Software –Application Settings
•To access the application settings, click .
This panel is divided into several tabs for
changing different settings of the software.
•On the User Connection tab, you can leave
your contact details which will only be used
in case of software problems, so we can get
in touch with you and help with the solution.
In case of a software problem an error report
is sent to us in email. You can select whether
this email should be sent automatically or
not and whether it should contain your
contact information and the current project.
•On the User Interface tab, you can select the
software language and the measurement
system which can be Metric or American
Standard.
•The Reader Device tab can be used to set up
and configure the Bluetooth settings with the
ArborSonic 3D device. The button Start
starts an automatic detection which can be
used if a new device should be installed. The
process is different according to the
operation system and the used computer.
The ArborSonic3D device should be
connected and a signal is needed.
•The “Reader Configuration” button
opens the same window as the same button on the Time Data page of the software. This
window is responsible for selecting the COM port which is explained in the “Selecting COM
port” section. The channel mixer tool lets you assign different numbering for the physical
channel numbers as printed on the Amplifier Boxes. This is useful if you lose one of the
boxes, let’s say 5-6, but still want to perform measurements with 8 sensors using boxes 1-
2, 3-4, 7-8, 9-10. (Detailed in chapter Testing and Troubleshooting.)
•Port diagnostics is a tool that is useful for monitoring the raw data received from the
device. Actually, it is a simple telnet application. It opens all the ports and listens to any
data that is received. Using the Save button the data can be saved to an external file.
•On the Bluetooth Caliper page, you can select the COM port of the Bluetooth Caliper.
•On the Updater page you can disable or enable automatic software updates over the
internet. By default, this feature is turned on, so you will receive updates automatically
when starting the software.
•On the Advanced tab Zero limit is the number under which a measured time value is
considered as zero. The default and recommended setting is 0 which in fact turns this
function off.

13
•Auto filter limit is the difference limit in time which if reached results the measured time
row to be filtered out. The default setting is 20.
•Min. good row count is the number of required good time measurements from each sensor.
The default setting is 3.
•Minimal and maximal T0 are internal time correction limit parameters which are out of the
scope of this manual. The default settings are 20 and 35. You have to change these values if
you are using long (e.g. 12 cm / 4.7 inches) nails. In this case T0 min should be 45 while T0
max should be set to 60.
•Velocity scale controls the scale (height) of the 3D map in the z axis.
•Rel Time Error Threshold controls the level above which the values in the time matrix on
the Time Data panel are shown as red, if the relative error exceeds this limit. The default is
5%.
•Minimal Line Velocity is an internal minimum value for any measured line velocity, default
is 500 meter/sec.
•Software rendering should be used if you experience problems with the tomogram images.
The program must be restarted if this setting is changed.
Software –Tree Properties
•The first page contains the general properties of the tree. Tree species must be selected
before you can move to the next page! The species can be selected from the top list. This is

14
a quick list which contains maximum 20 of the recently used species. To select a species
which is not in this list, click the button. A
new window pops up where you can navigate
in the taxonomical list of tree species. This list
contains above 3000 species. To speed up the
search process, you don’t need to click through
the whole list to find a species, but you can
simply start typing the English or Latin name
of the species. To jump to the next candidate,
click or hit the enter button. After
selecting the desired species, click OK to close
this window.
•The rest of this page contains various fields for
describing different properties of the tree. The
software comes with a default tree property
template, but it is possible to create custom templates which may be used to register
different properties. All this will go into the report that is generated by the software, so a
well-designed template can save you a lot of time. Of course, changing this template is
optional and you can start working with the default template.
•Click the button to open the tree properties menu. Select Open for opening another
template, New for creating a new one, Edit to modify an existing one or Remove to delete.
The default template that comes with the software can’t be deleted.
•When selecting New or Edit, the template editor
window pops up. The left side of this window
shows the preview of the template while the right
side can be used to add, remove and modify distinct
fields in the template.
•By clicking the button a new field can be added
to the template. The type of the new field and its
position relative to the current selection must be
selected. After clicking OK the properties of this
field can be set. For example, each field type has a Name property which is the display name
of this field.
•The buttons can be used to change the
relative position of the selected field and the
button can be used to remove it. The
buttons can be used to save the modifications to the
template or to save it under a new name. After this
the template is ready to be opened for use.

15
Software –Sensor Geometry –Basics
•The software can handle measurements at several (different) heights. These are the so-
called Layers. The sensors can be placed at one Layer at a time and need to be moved
between the Layers after collecting the Time Data. Please disconnect the cables when
moving between Layers, otherwise the connectors may be damaged.
•Use the button to add a new layer and user the button to remove one.
•“Add layer” can also handle files from previous program version with “Add f2d files as
layer…”
•It is also possible to copy an entire layer.
•The name of each layer can be changed in the Layer name field.
•The height of a layer from the ground should be defined in the Height field.
•The length units (cm or inch) can be changed in Application Settings / User interface (the
program does not keep the numbers but converts them).
•There are four geometry schemes: Circular, Ellipse, Irregular and Rectangular. These can
be selected in the Scheme field. Please use the proper geometry. (For example, do not use
circular geometry if the trunk is concave.)
•Circular, Ellipse and Rectangular geometries can be converted to Irregular scheme. This
can be useful if the trunk is almost circular or elliptic with only one outgrowth or dent.
•The number of sensors used for the measurement can be set in the Sensor count field.
Usually it will be the same number for each layer, but it is possible to use more or less
sensors for a layer.

16
•PD is a parameter required for all three schemes. It is the penetration depth of the nail tip
from the bark surface. It is not a very critical parameter, especially in case of large trees.
But it is important in case of smaller trees.
•BT is another parameter required for all schemes and denotes the Bark Thickness. This
parameter is not very critical in case of normal sized trees, but it should be set carefully for
small trees.
•For measurements physical penetration depth should always be more than the bark
thickness, the nail should go through the bark.
•In Circular, Ellipse and Rectangular the software tells you where to put the sensors.
•In Irregular first you place the sensors and then you tell the software where they are.
•Different layers can have different schemes.
•Sensors need to be placed in a counter-clockwise order when seen from above. Therefore,
previous sensors need to be on the left side while next sensors on the right side.
Software –Sensor Geometry –Circular, Elliptical, Rectangular and
Irregular
Circular
•Use this scheme if the trunk is circular.
•Place sensor no. 1 anywhere and use it as a support to hold
the tape around the trunk. (The north direction is included in
the program. The layer can be rotated by the red/green dot
on the top of the compass (the arrow in corner) indicating
north direction. It can become important if the sensors are
not at the same directions in the different layers. Detailed in
chapter Software –Sensor Geometry –Compass.)
•Measure the circumference with the tape and type it into C.
•Place the other sensors around the trunk at the positions
displayed:
•Provide the estimated penetration depth of the sensor nail tip from the bark surface as the
PD parameter. (The nails’ lengths are usually 6 cm.)
•Provide the estimated bark thickness as the BT parameter.
•By pressing the “Convert to irregular” button, the scheme will be converted to Irregular
(see below) which might be useful when the tree is almost circular, but the positions of one
or two sensors need to be adjusted.

17
Elliptical
•Use this scheme if the trunk is elliptical.
•Place sensor no. 1 at the end of the larger diameter and use it as a support to hold the tape
around the trunk.
•Measure the circumference with the tape and type it in parameter C.
•Measure the larger diameter with a caliper and type it in D1. Measure the smaller diameter
and type it in D2.
•Place the other sensors around the trunk at the positions displayed:
•Direction, PD and BT can be adjusted the same as detailed above for circular geometry.
•By pressing the “Convert to irregular” button, the scheme will be converted to Irregular
(see below) which might be useful when the tree is almost elliptical, but the positions of
one or two sensors need to be adjusted.
Rectangular
•Use this scheme if you are investigating rectangular wood.
•A is the width of the rectangle and B is its depth.
•ASC and BSC are the number of sensors on the A and B side. 2*(ASC+BSC) must equal the
total number of sensors, otherwise you get a sensor count mismatch.
•LeftPad, RightPad, TopPad, BottomPad are the spacings between the corner and the first
sensor from the given direction. These must be smaller than A or B.
•By pressing the “Convert to irregular” button, the scheme will be converted to Irregular
(see below) which might be useful when the shape is almost rectangular, but the positions
of one or two sensors need to be adjusted.
•Direction, PD and BT can be adjusted the same as detailed above for circular geometry.

18
Irregular
•Use this scheme if the trunk shape is irregular.
•Place the sensors around the trunk in counter-clockwise order.
•Make sure that the sensors are in one plane. The tape measure can be used for this.
•After placing the sensors use the caliper to measure distances between sensor pairs. For
example, distance between sensor no. 1 and no. 2 needs to be entered in the field .
•The Bluetooth caliper can be used to transmit the data automatically. Just start the caliper
and measure the appropriate distances.
•Direction, PD and BT can be adjusted the same as detailed above for circular geometry.
•The other shapes can be converted into irregular. Change the distances of the sensor(s)
which is not fitting the previously used shape.
Software –Sensor Geometry –Compass
Description
•The compass is the graphic in the lower right corner.
•Using the compass is optional.
•It can be used to specify a direction of interest, relative to north. (E.g. it
can be used to specify the positions of the trees, of the sensors.)
•It rotates all views of the selected layer (except the multilayer view).
(Therefore it can be used it to rotate the layer according to your viewing angle of the tree.)
•The specified angle is saved, when you save your project.
Usage
•The angle needs to be set separately for each layer.
•The angle is represented by a dot on the circle. The exact value is
displayed at the bottom, in degrees.
•The angle can only be changed on the Sensor Geometry page. This is
indicated by its red color.
•When on the Sensor Geometry page, hover your mouse over the dot, and press down the
left mouse button while you move it to its new place. While this is done, the color of the dot
will be green.
•On all other pages the dot will be colored black, to indicate that it cannot be edited.
•On Sensor Geometry tab the default position of the first sensor on the top (facing to north).
You may measure different layers with the sensors facing to different directions and rotate
them to proper positions. You can check the relative positions of the layer in the multi-layer
mode.

19
Software –Time Data
•Time data are the shock-wave travel-times measured by ArborSonic 3D between the
sensors in microseconds.
•After placing the sensors
and register-ing the
geometry, go to the
tab. If the
connection is already
configured and the
Battery Box is turned on,
the
message appears which
shows that the connection
was opened successfully.
(“Reading device” means
only that the COM port is
found and could be
opened. This is necessary. Yet there are cases when having this sign is not enough for
starting the measurement, the COM port might need to be changed.)
•On the right side of the green area a battery icon can be seen if there is
communication with the Battery Box. The voltage can be checked as well. Please note that
measurements done while the voltage is lower than 8 V can be incorrect.
•Otherwise you will need to configure the connection. This process is described in the
“Hardware – Bluetooth and serial connection” section earlier.
•Make sure to select the correct Layer on the left side, i.e. where the sensors are actually
placed. Change this selection when sensors are moved to the next Layer.
•Tap each sensor at least 3 times. (5 taps are recommended.)
•The measured time data appear in the table.
•One line of this table contains the measured travel-times from the tapped sensor to all the
other sensors. Therefore, the value belonging to the tapped sensor is always 0.
•The numbers near the column labels show the number of correct taps from each sensor. If
the number if below 3, the color is red which means, that additional taps are required
from that sensor. Otherwise the number is green .
•The small dots in the columns show the correctness of the time row. If the row is correct, a
green dot is shown. It is not a problem if not every row is correct, because the software
uses the correct rows only.
•Please make sure to tap always on the center of the sensor head with approximately
uniform strength. If the side of the sensor is tapped or the strength is too low, the measured
time data row is incorrect. The software has a built-in filter for these data, however it is
better to remove them manually by the „Remove bad rows” or „Remove selected rows”
button.
•If there is enough time data from every sensor, the section contains the
averaged times between the sensor pairs. Most of this data is just for monitoring.
Table of contents
Other Fakopp Measuring Instrument manuals