Indu-Sol PROFview XL User manual
Diagnostic- and Service Tools
» PROFIBUS DP
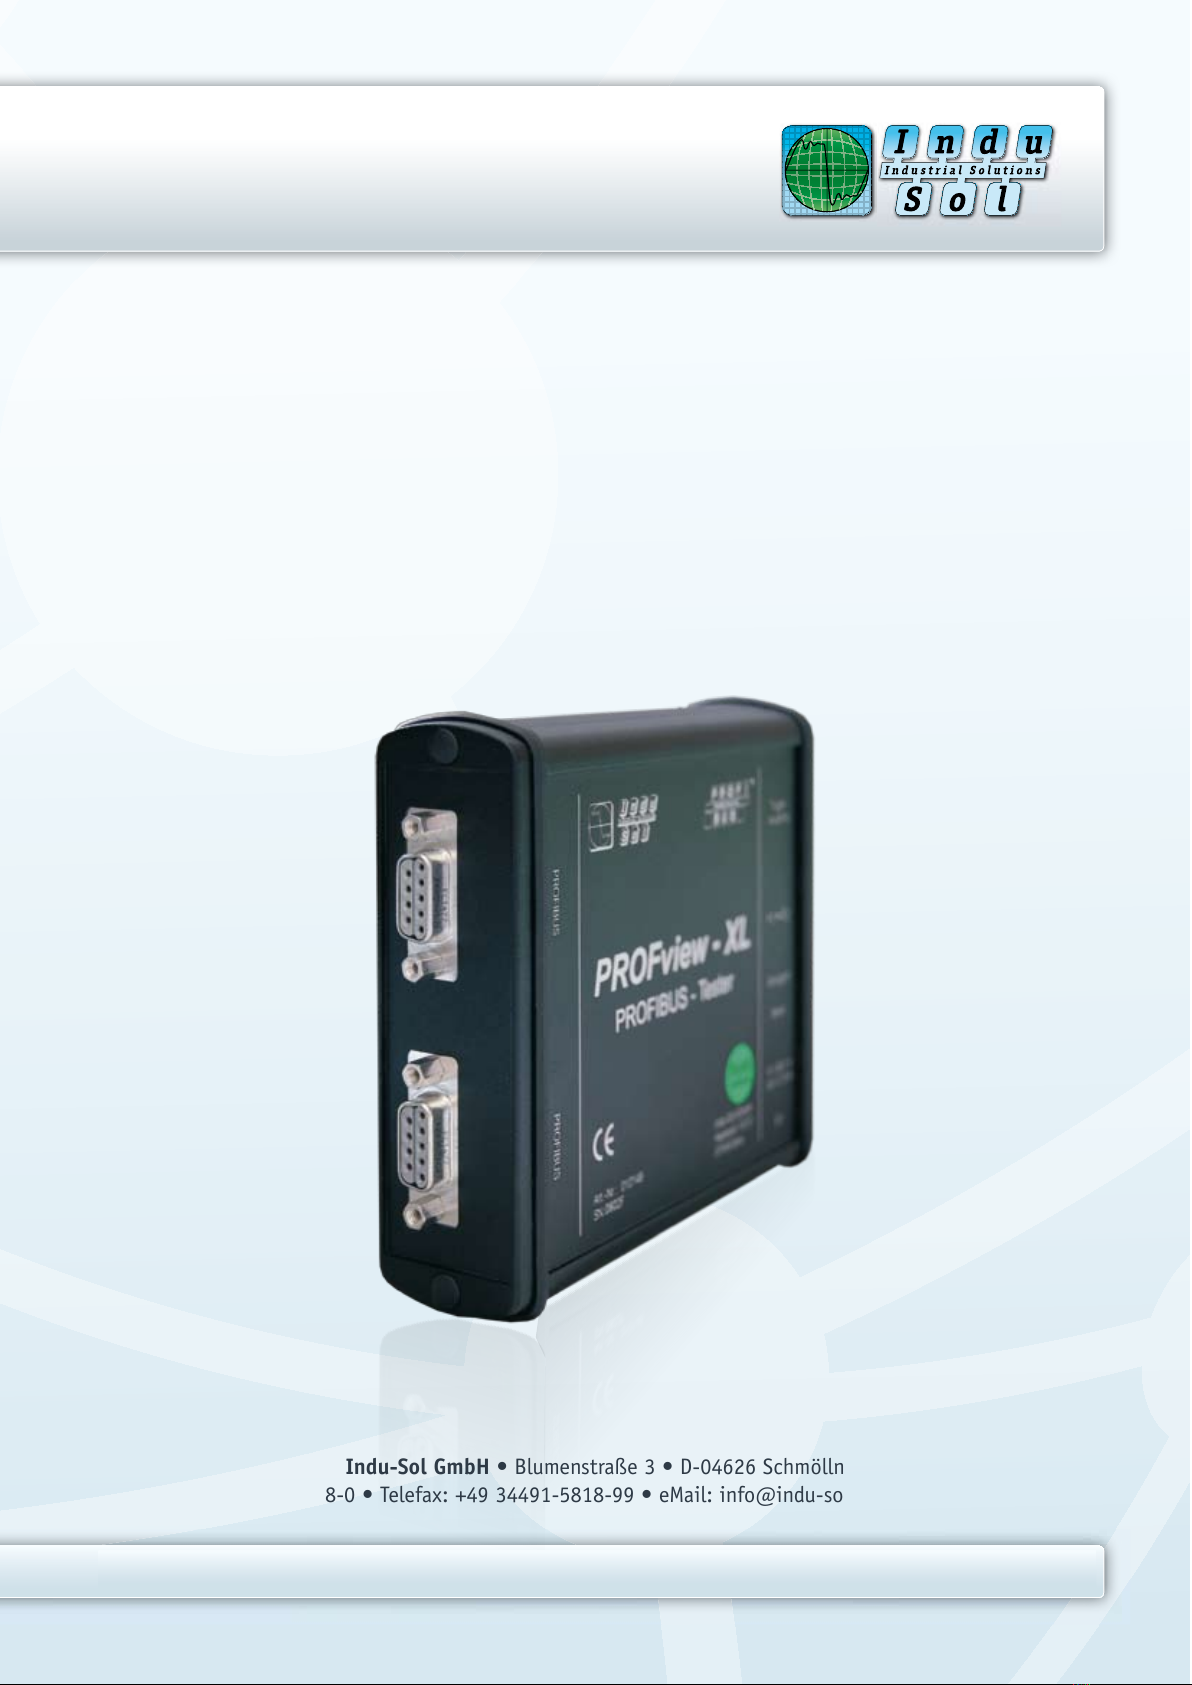
PROFview XL®
PROFIBUS-Tester
USER MANUAL
Indu-Sol GmbH • Blumenstraße 3 • D-04626 Schmölln
Telefon: +49 34491-5818-0 • Telefax: +49 34491-5818-99 • eMail: info@indu-sol.com • www.indu-sol.com
Your partner and specialist for Fieldbus, Industrial Ethernet and PROFINET


User Manual
Indu-Sol GmbH Telefon: +49 34491 5818-0
Blumenstraße 3 Telefax: +49 34491 5818-99
Deutschland Web: www.indu-sol.com

User Manual PROFview XL
Indu-Sol GmbH
Subject to change without prior notice.
Our policy is one of continuous improvement, and consequently the equipment may vary from the description
and specification in this publication. The specifications, illustrations and descriptions provided in this docu-
mentation are not binding in detail.
No part of this publication may be reproduced in any form, or by any means, without the prior written permis-
sion of Indu-Sol GmbH.
All rights according to the copyright law expressly reserved to Indu-Sol GmbH.
Note:
To use the PROFview XL and to understand this Manual, general knowledge of the PROFIBUS field bus sys-
tem and of the RS485 transmission technology is required.
II PROFview XL

User Manual PROFview XL Table of Contents
Table of Contents
1 Introduction.....................................................................................................................................................1
2 Start-up............................................................................................................................................................3
2.1 Receiving inspection and testing..............................................................................................................3
2.2 Acclimatizing the device ..........................................................................................................................3
2.3 Connecting the device..............................................................................................................................3
2.3.1 Design..............................................................................................................................................3
2.3.2 Mains connection.............................................................................................................................4
2.3.3 PROFIBUS connection....................................................................................................................4
2.3.4 Connecting the PROFIBUS Tester to a storage oscilloscope.........................................................4
2.3.5 Connecting the device to the PC......................................................................................................4
2.4 Prevention of accidents............................................................................................................................4
3 Description of Functions and Measuring Principle....................................................................................5
3.1 The most important measuring functions.................................................................................................5
3.2 Measuring the physical bus characteristics..............................................................................................5
3.2.1 General quality level (incl. glitch, edge and level errors)..................................................................5
3.2.2 Disturbance-free voltage range........................................................................................................6
3.2.3 Edge steepness...............................................................................................................................7
3.2.4 Signal waveform (oscilloscope display)...........................................................................................7
3.2.5 Measuring cycles and measuring time.............................................................................................7
3.2.6 Triggering to a station address.........................................................................................................8
3.3 Online monitoring functions......................................................................................................................8
3.3.1 Bus status........................................................................................................................................8
3.3.2 Bus cycle time .................................................................................................................................8
3.3.3 Illegal frames....................................................................................................................................9
3.4 Help functions...........................................................................................................................................9
3.4.1 Master simulator...............................................................................................................................9
3.4.2 Station scan....................................................................................................................................10
3.4.3 Detection of duplicated addressing................................................................................................10
3.4.4 Topology scan................................................................................................................................10
3.5 Working with measuring points..............................................................................................................11
4 The PROFview XL Application Software....................................................................................................12
4.1 System requirements.............................................................................................................................12
4.2 Installing the software.............................................................................................................................12
4.3 General notes on operation....................................................................................................................13
4.3.1 Help................................................................................................................................................13
4.3.2 Data saving....................................................................................................................................13
4.4 Program structure..................................................................................................................................13
4.4.1 Menu bar........................................................................................................................................14
4.4.2 Toolbar...........................................................................................................................................14
4.4.3 Message bar..................................................................................................................................15
4.4.3.1 Bus status..............................................................................................................................15
PROFview XL III

Table of Contents User Manual PROFview XL
4.4.3.2 Illegal frames..........................................................................................................................16
4.4.3.3 Bus cycle time........................................................................................................................16
4.4.3.4 Master simulator....................................................................................................................17
4.4.4 Status bar.......................................................................................................................................17
4.5 "Configure segment" view......................................................................................................................17
4.5.1 Segment.........................................................................................................................................17
4.5.1.1 Baud rate scan.......................................................................................................................18
4.5.1.2 Station scan (and detection of duplicated addressing)..........................................................18
4.5.1.3 Topology scan........................................................................................................................18
4.5.2 Recording the online monitoring....................................................................................................19
4.5.3 Evaluation.......................................................................................................................................19
4.5.4 Station list.......................................................................................................................................19
4.5.5 List of measuring points.................................................................................................................20
4.5.6 Topology display............................................................................................................................21
4.6 "Quality Levels All Stations" view...........................................................................................................21
4.6.1 How to use.....................................................................................................................................21
4.6.2 Setting and measuring...................................................................................................................21
4.6.3 Evaluation.......................................................................................................................................22
4.7 "Measure Stations" view.........................................................................................................................22
4.7.1 How to use.....................................................................................................................................22
4.7.2 Setting and measuring...................................................................................................................23
4.7.3 Evaluation.......................................................................................................................................25
4.8 "Quality Levels Logger" view..................................................................................................................25
4.8.1 How to use.....................................................................................................................................25
4.8.2 Setting and measuring...................................................................................................................25
4.8.3 Evaluation.......................................................................................................................................27
4.9 "Statistics of measuring points"..............................................................................................................27
4.10 Printing a test record............................................................................................................................27
4.11 Exporting measurement data...............................................................................................................28
4.11.1 CSV file........................................................................................................................................28
4.11.2 Graphics.......................................................................................................................................29
4.12 Settings.................................................................................................................................................29
4.12.1 General settings...........................................................................................................................29
4.12.2 Tester contact data......................................................................................................................29
4.13 DMF information...................................................................................................................................30
4.14 The "PROFIBUS Tester Scan" program..............................................................................................30
5 Technical Specifications.............................................................................................................................31
6 Scope of Supply...........................................................................................................................................33
7 Maintenance and Customer Service..........................................................................................................34
7.1 Maintenance...........................................................................................................................................34
7.2 Customer service...................................................................................................................................34
7.2.1 Shipping.........................................................................................................................................34
7.2.2 Support...........................................................................................................................................34
IV PROFview XL

User Manual PROFview XL Table of Contents
7.2.3 Warranty and limitation of liability...................................................................................................34
8 Ordering Information...................................................................................................................................35
9 Problem Recovery........................................................................................................................................36
9.1 Problems with the PROFview XL device setup......................................................................................36
9.2 Problems when measuring.....................................................................................................................36
10 Notes............................................................................................................................................................38
PROFview XL V

List of Tables User Manual PROFview XL
List of Tables
Table 1: Description of the measuring cycles ................................................................................................... 7
Table 2: Device types with their styling in the station list ................................................................................. 20
Table 3: Technical specifications .................................................................................................................... 31
Table 4: Technical specifications (cont'd) ....................................................................................................... 32
Table 5: Ordering information .......................................................................................................................... 35
VI PROFview XL

User Manual PROFview XL List of Figures
List of Figures
Fig. 1: Connections of the PBT ......................................................................................................................... 3
Fig. 2: Measuring principle for disturbance-free voltage range and signal level ............................................... 6
Fig. 3: Structure of the PBT application software ............................................................................................ 13
Fig. 4: Toolbar ................................................................................................................................................. 14
Fig. 5: Elements of the message bar .............................................................................................................. 15
Fig. 6: Status bar ............................................................................................................................................. 17
Fig. 7: Elements of the "Configure segment" view .......................................................................................... 18
Fig. 8: "Quality Levels All Stations" view ......................................................................................................... 22
Fig. 9: "Measure Stations" view ....................................................................................................................... 24
Fig. 10: "Quality Levels Logger" view .............................................................................................................. 26
Fig. 11: Test record settings ............................................................................................................................ 28
Fig. 12: DMF information ................................................................................................................................. 30
Fig. 13: "PROFIBUS Tester Scan" .................................................................................................................. 30
PROFview XL VII

Terms, Definitions and Abbreviations Used in This Manual User Manual PROFview XL
Terms, Definitions and Abbreviations Used in this Manual
Baud rate Data transfer rate (1 baud = 1 bit/s)
Differential voltage is the voltage between the RS485 signal lines A (pin 8) and B (pin 3)
UD= UB- UA
Disturbance-free voltage
range The term 'disturbance-free voltage range' is used to denote a voltage range of the differential voltage
for a selected station over the whole frame, whose limits are not violated - not even momentarily - over
the evaluation period.
DMF Device master file; description of the technical data of a PROFIBUS device
DSO Digital storage oscilloscope
Evaluation period 10/16th of the bit width around the bit center (RS485 transceiver-sample point), within which the distur-
bance-free voltage range is measured
Firmware Software for a microprocessor
FPGA Field Programmable Gate Array – programmable logic array for real-time functions
Idle Bus condition or transmission break between two successive frames
ID number Device code of a PROFIBUS device used for assignment to the device master file (DMF).
Illegal frames Frames which do not conform to IEC 61158-3 (with protocol errors)
Master Active bus station (usually the PLC) coordinating the access to the bus
Relevant frame The term 'relevant frame' is used if a frame contains the source address of the bus station to be mea-
sured (or the short acknowledgment following a request frame issued to this station)
Segment PROFIBUS section terminated on both line ends using a powered resistor combination. A repeater
which is either inserted between line ends or else connected to one line end also constitutes a seg-
ment termination.
Slave Bus station which as a rule only sends to the bus upon request by the master (e.g. digital I/O)
Token Frame (SD4) which is exchanged between the active stations (masters) to control the access to the
PROFIBUS
VIII PROFview XL
User Manual PROFview XL 1 Introduction
1 Introduction
Thank you for purchasing PROFview XL (PBT)! You have ac-
quired a tool which will support you in the start-up, monitoring
and servicing/maintenance of your PROFIBUS plant.
Thanks to its wide range of applications, its high data transfer
rates and above all its high tolerance against interference in
the field of plant automation, PROFIBUS has become well es-
tablished over the last few years. Nonetheless, particularly
when starting up new plants, though also during operation, a
wide diversity of problems may occur, quickly resulting in un-
desirable and often expensive failures. Errors in the application software of the plant are often assumed to be
the causes. Experience, however, has shown that the most of the problems occurring are attributable to the
use of inappropriate cable types, improper installation of the bus cables or disturbed driver functions at indi-
vidual PROFIBUS stations. Typical error causes for a disturbed communication on the PROFIBUS are e.g.:
missing, unpowered or surplus bus terminations
overlong bus lines and/or dead-end branches, wrong cable types
predamaged/defective bus drivers
excessive transfer resistances due to aging/corrosion
cable routing in environments subject to strong interference
Frames with a bad signal quality can only by detected via an analysis of the physical bus characteristics, per-
mitting errors and their causes to be detected specifically. Early and regular checks, beginning already at
start-up, help locate fault sources before they lead to failures. Such checks increase the signal quality, the
bus works reliably and is more resistant in terms of EMC.
PROFview XL 1

1 Introduction User Manual PROFview XL
The PROFview XL will help you efficiently in checking your PROFIBUS system and in finding faults and their
causes. To this end, it provides the following scope of functions:
passive bus coupling during operation
automatic detection of the baud rate used
automatic determination of all stations in the plant (LiveList)
bus-station and measuring-point-related display of the signal conditions:
general quality level (incl. glitch, edge and level errors)
disturbance-free voltage range and edges
oscilloscope display (at least one rising edge)
long-term monitoring (logger) for all stations
continuous display and recording of the current, minimum and maximum bus cycle time
real-time monitoring of the whole data traffic and checking for frame errors
integrated master simulator for checking plants even without master (start-up phase)
determination of the order and distances (line lengths) of the individual stations
real-time-capable hardware trigger output for station-related analysis via DSO
The PBT possesses a USB port for connection to a PC or notebook. The clearly structured PC software pro-
vides for straightforward operation of the device, the performing and evaluation of measurements, and sup-
port in locating error causes. Thanks to the integrated update option, you are already today well prepared for
future extensions.
2PROFview XL

User Manual PROFview XL 2 Start-up
2 Start-up
2.1 Receiving inspection and testing
Carefully unpack the device immediately after receipt and check the consignment. If transport damage is sus-
pected, inform the delivery agent within 72 hours and keep the packaging for inspection. The device must
only be transported in its original or equivalent packaging.
Check the completeness of the consignment against Chapter 6 "Scope of Supply".
2.2 Acclimatizing the device
Before turning on the device, make sure that it has reached the same temperature as the room. This should
take at most 60 minutes.
2.3 Connecting the device
2.3.1 Design
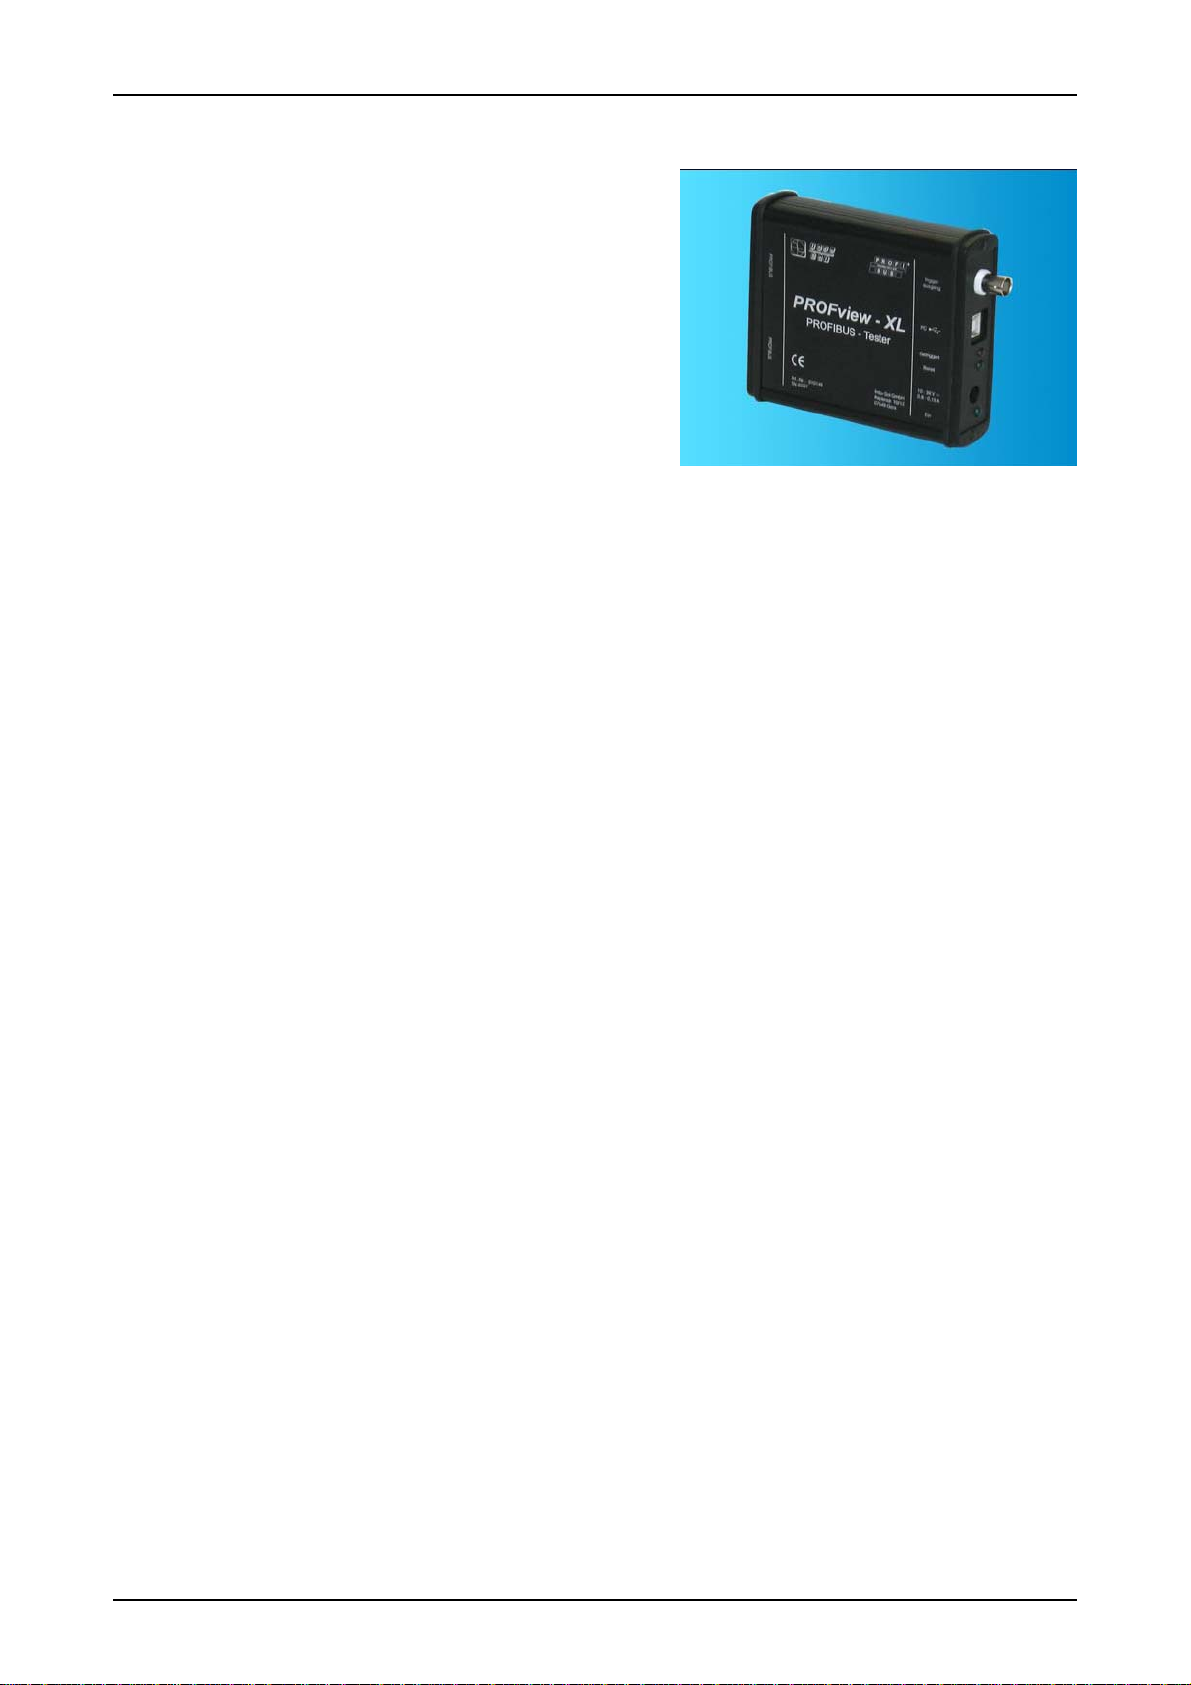
Fig. 1 shows all connections of the PBT. The power supply is provided by the supplied plug-in power adapter
(24 V) via an extra-low voltage socket (to DIN 45323). The inner contact is the plus pole. The "Power On"
LED lights when the correct operating voltage is provided.
The two SUB-D 9 sockets serve for connection to the PROFIBUS plant and for the sampling of the signal
lines A and B (via the adapter board) for evaluation using a digital storage oscilloscope (DSO). The BNC
socket can be connected to the DSO to use the station-related trigger signal.
The connection to the PC or notebook is provided using a USB cable. During operation, the "Ready" LED in-
dicates that the data transfer is running on the connected PROFIBUS. A trigger pulse at the BNC socket is
signaled by the "Trigger" LED.
PROFview XL 3
Fig. 1: Connections of the PBT

2 Start-up User Manual PROFview XL
2.3.2 Mains connection
The desktop power adapter included in the scope of supply possesses a wide-range input for connection to
mains voltages from 100 V to 240 V 50/60 Hz; the output is a d.c. voltage of 24 V. The cable of the desktop
power adapter is inserted into the PROFview XL using the external voltage connector to DIN 45323. Once the
mains power cable is inserted into the desk power adapter and the mains power plug into the mains socket-
outlet, the PBT is ready for operation. This is indicated by the "Power On" LED on the device.
2.3.3 PROFIBUS connection
Various adapter cables for connecting the PROFview XL to a PROFIBUS plant are included in the scope of
supply. These enable the device to be connected both via SUB-D 9 or M12 connector.
2.3.4 Connecting the PROFIBUS Tester to a storage oscilloscope
To display the signal quality of individual PROFIBUS stations on a DSO, the PBT generates a station-related
trigger pulse. Thus, it is merely necessary to connect the BNC socket of the device to the external trigger in-
put of the oscilloscope.
The adapter board included in the scope of supply can be connected to the second SUB-D 9 socket, for sim-
ple sampling of the signals from the data lines A and B and the shield potential with the oscilloscope probes.
To sample the data transfer signal, a differential probe is recommended (signal line A against signal line B). If
two simple probes are used (A against shield and B against shield), the storage oscilloscope must provide
mathematics functions to be able to generate the difference (B minus A).
2.3.5 Connecting the device to the PC
The PBT is connected to a PC or notebook via the "hot-plug-&-play-capable USB port. Before you connect
the device to a PC or notebook, it is recommended to install the supplied software, as it includes the neces-
sary USB driver (see Section 4.2 "Installing the software").
2.4 Prevention of accidents
When operating this test device, it is imperative to observe the general accident prevention regulations for the
use of measuring instruments. The device must only be used in dry rooms.
4PROFview XL

User Manual PROFview XL 3 Description of Functions and Measuring Principle
3 Description of Functions and Measuring Principle
3.1 The most important measuring functions
The PBT can measure and display the signal conditions of every PROFIBUS station. Any problems with this
station or with the bus cabling can be inferred from the results of the signal quality. The PBT displays the fol-
lowing physical properties separately for each PROFIBUS station:
general quality level (incl. glitch, edge and level error counters)
disturbance-free voltage range (minimum, interference-free differential voltage)
edge steepness
section of the signal waveform (oscilloscope display)
In addition to the physical measurements, the PBT provides online monitoring functions, i.e. the entire bus
traffic is monitored and checked continuously. This also includes the bus cycle time and a counter for illegal
frames.
One of the most important innovations offered by the PBT is the master simulator allowing measuring and
checking already during the phase of installation, even if the master station (e.g. PLC) is not yet available.
The distances (line lengths) to the individual PROFIBUS stations, as well as automatic sorting of the station
and measuring point lists according to the distances, can be derived from the topology determination.
The individual measuring functions are described in detail in the following subsections.
3.2 Measuring the physical bus characteristics
PROFIBUS uses a differential signal, i.e. the actual data signal is transferred via two lines inverted to each
other (A and B). The difference between the two generates the signal digitized by each PROFIBUS transceiv-
er. Any faults occurring there can endanger the correct detection of the bit stream. The PBT provides an eval-
uation of the differential signal in the form of a general quality level, the disturbance-free voltage range and
the edge steepness, as well as by way of the oscilloscope display.
Contrary to the quality level, which provides a general evaluation of the signal quality for the bus, the determi-
nation of the disturbance-free voltage range and of the edges, as well as the oscilloscope display, are useful
aids for targeted fault finding.
3.2.1 General quality level (incl. glitch, edge and level errors)
The quality of the signal transmission is characterized by the level of the differential voltage (between
A and B), the edge steepness, overshoots and undershoots, as well as level dips (as caused by reflections).
All these features are summarized in the quality level value. A reference voltage is changed iteratively by the
PBT such that max. 20 glitch, edge and level errors can occur per 1,000 bits.
Subsequently, the PBT activates error counters for glitch, edge and level errors. These error counters display
the accumulated number of bit errors per 1,000 bits. The following definitions apply:
PROFview XL 5

3 Description of Functions and Measuring Principle User Manual PROFview XL
Glitch error:
Bits for which the voltage has been fallen below the reference voltage for at least 1/8th of the bit time and has
then recovered
Edge errors:
Bits for which the edge rise or fall time is more than 3/8th of the bit time
Level errors:
Bits for which the value of the reference voltage is not reached
Sporadically occurring faults at the frames to be measured are indicated via the error counters for glitch,
edge and level. Any permanent faults, however, will reduce the quality level.
Note:
The value of the quality level is equivalent to the "minimum signal level" of the PROFview.
3.2.2 Disturbance-free voltage range
The term 'disturbance-free voltage range' is used to denote the interference-free range of the differential volt-
age, which is determined over a certain part of each bit of the frames for the station to be measured (relevant
frames). This part is called evaluation period.
Each bit is sampled 16 times. The disturbance-free voltage range is evaluated over 10/16th of the bit width
(62.5 % of the evaluation period). At both the beginning and end of each bit, 3/16th of the bit width are ex-
cluded from the determination of the disturbance-free voltage range (see Fig. 2). Signal overshoot and sett-
ling processes are excluded from the interference voltage measurement, as long as they lie outside the eval-
uation period. A voltage drop of less than 1/16th of the bit time during the evaluation period cannot be detect-
ed reliably and thus also has no influence on the determination of the disturbance-free voltage range.
6PROFview XL
Fig. 2: Measuring principle for disturbance-free voltage range and signal level

User Manual PROFview XL 3 Description of Functions and Measuring Principle
3.2.3 Edge steepness
To fully evaluate the transmission properties of the bus cabling and of the individual PROFIBUS stations, the
edges must also be studied, in addition to the disturbance-free voltage range; shallow edges can also prevent
the correct decoding of the transmission signal.
The PBT determines the edge steepness separately for rising and falling edges. To this end, two thresholds
are set at 10 % and 90 % of the signal level determined (differential voltage determined at the bit center, see
Fig. 2). The time required for the differential signal to change between these voltage threshold values is mea-
sured both for falling and rising edges. The rise and fall times are determined with a resolution of 1/16th of
the baud rate used and displayed as a value between 0/16th and 16/16th. This value always specifies the
slowest rising and falling edge of the relevant frames. A measured value of 0/16th means that the level
change takes place in less than 1/16th of the bit width.
3.2.4 Signal waveform (oscilloscope display)
To evaluate signal transitions and to measure reflections, the PBT records a characteristic section of the sig-
nal waveform of a relevant frame and displays it on the oscilloscope of the PROFview XL application soft-
ware. Based on the signal waveform, various cable problems, such as dead-end branches (transient signal
dips), significantly different cable types (long reflections/level dips), short circuits, etc. can be revealed.
The triggering point for recording lies at 50 % of the recording depth and is always to be found on the first ris-
ing edge of a relevant frame. Irrespective of the selected baud rate, the signals are always recorded at a
sampling rate of 192 MSample/s and cover a time range of 12.5 µs with 2,400 points (time resolution: ap-
prox. 5.2 ns).
The oscilloscope display facilitates the evaluation of signal dips/reflections. Based on the height of the dip, it
is possible to infer the changes in the characteristic wave resistance of the cable. The length and the position
of the reflections indicate the distance to the point of interference. Two cursors have been implemented in the
oscilloscope display of the PROFview XL application software for simple measurement of the reflection
lengths and thus distances. The signal runtime is converted into a distance specification automatically. A
mean runtime constant of 4.35 ns/m is used for calculation with PROFIBUS cables.
3.2.5 Measuring cycles and measuring time
The above characteristic measured values for the signal quality are determined by the PBT for each
PROFIBUS station in so-called measuring cycles (see Table 1).
Measured Value Measuring Cycle
Quality level (incl. glitch,
edge and level errors)
Eight iterations with at least 1,000 bits of the station to be measured
(relevant frames)
Disturbance-free voltage
range, edge steepness and
signal waveform
Ten iterations with at least one frame of the station to be measured
relevant frame)
Table 1: Description of the measuring cycles
PROFview XL 7

3 Description of Functions and Measuring Principle User Manual PROFview XL
Especially with low baud rates, PROFIBUS plants with many or unconfigured stations, or large amounts of
data to be transferred, a measuring cycle can last longer. If it is not possible to determine all data during the
measuring time, the measurement will end with a timeout. In this case, the timeout value can be increased
via the PC program (menu "Tools" →"Settings").
3.2.6 Triggering to a station address
During a measuring cycle, the PBT must detect frames of the PROFIBUS station to be measured and evalu-
ate its physical bus signal. The assignment of the signal sent to a station is provided via the source address
(SA) contained in each PROFIBUS frame1. Once this address has been detected in the measurement "One
station" and if this address is identical to the station to be measured, a trigger pulse is generated at the trigger
output of the PBT (BNC socket). This can be used in conjunction with an oscilloscope to display and check
the bus signal for any station.
3.3 Online monitoring functions
3.3.1 Bus status
The bus status provides a quick overview of the status of your PROFIBUS plant. A cyclic measurement over
one second indicates whether or not data traffic (level change) is present and whether or not the PBT is con-
nected correctly to the bus. The so-called idle level of the bus is measured and displayed on an idle plant
(without data traffic). Conclusions as to any errors in the bus cabling can be drawn from the value of this dif-
ferential voltage. Such errors can be, for example, swapped lines, as well as missing, surplus or unpowered
terminators.
3.3.2 Bus cycle time
PROFIBUS functions on the basis of the master-slave communication hierarchy with token passing. A
PROFIBUS master controls the access to the bus and polls its configured PROFIBUS stations (slaves). Once
the master has executed its communication tasks, it passes the token (frame) to the next master (or back to
itself - in plants with only one master). The bus cycle time (token rotation time of a master) specifies how long
the token "travels" for a complete bus cycle. More precisely, the time measurement starts with passing on of
the token by a master and ends after a bus cycle when the token is again passed on by the same master.
The objective when configuring any PROFIBUS plant is to keep the bus cycle time and thus the refresh inter-
val of the process data as short as possible. Not only configuration problems, but also diagnostic and alarm
messages, as well as poor transmission properties resulting in sporadic frame repetitions can extend the bus
cycle time. Problems of this kind can be avoided by measuring the cycle time at regular intervals and saving
the recorded minimum and maximum times.
1 ...except in a short acknowledgment frame; there, the destination address of the immediately previous frame is stored and as-
signed.
8PROFview XL

User Manual PROFview XL 3 Description of Functions and Measuring Principle
For this measurement to function correctly, it is merely necessary to set the baud rate of the PROFIBUS seg-
ment via the PBT application software and to connect the PBT to the plant. Subsequently, the device will de-
termine the address of a master automatically2and starts measuring the bus cycle time. Each time the token
is passed on, the time measurement is stopped and restarted at the same time. The resolution of the time
measurement is approx. 100 µs. The longest bus cycle time which can be detected is one second.
3.3.3 Illegal frames
The counter for illegal frames is - like the bus cycle time - a real-time monitoring function. The background to
this measurement is to be able to perform a protocol check of all frames transferred on the bus3. If a logic er-
ror is found in a frame, this counter is incremented by one.
As a rule, the counter of this display should always show "0". If, on the other hand, errors occur occasionally
or even frequently, this is due less to non-conforming PROFIBUS circuits of the PROFIBUS stations, but
rather to problems with the physical bus characteristics and the resulting transmission errors. But station ad-
dresses assigned twice (duplicate addressing) can also cause errors of this kind.
The illegal frame counter of the PBT counts max. 50,000 illegal frames. A frame is detected as illegal if at
least one of the following protocol errors has occurred:
unknown start delimiter (no SD1, SD2, SD3, SD4 or short acknowledgment)
incorrect checksum (FCS)
start, parity or stop-bit error
invalid end delimiter
invalid repeated SD2 (in SD2 frames only)
invalid length information (LE unequal to LEr; in SD2 frames only)
The error detection will only function correctly if the correct baud rate has been set for the PROFIBUS seg-
ments via the PBT application software. If this is not the case, the frame detection will not function correctly.
Consequently, any data transfer on the bus will increment the illegal frame counter.
Note:
Repeated or diagnostic frames according to the definition above are not registered by the illegal frame
counter.
3.4 Help functions
3.4.1 Master simulator
The PBT can now also perform measurements on PROFIBUS plants which are still in the phase of construc-
tion or start-up, even if the actual master station is not yet ready for operation. This function can be especially
useful if at first the correct realization of the bus cabling and of the installation of the individual stations is to
be checked.
2 If you have connected the PBT to a PROFIBUS plant with several master stations, the PBT will use the master address first detect-
ed on the bus for measuring the bus cycle time.
3 The PBT detects a frame as illegal if it does not comply with the protocol definition to IEC 61158-3. These illegal frames need not
necessarily result in frame repetitions by the master station, since the main causes of such errors are to be found predominantly in
the physical bus characteristics (e.g. signal reflections). Therefore, the signal waveform and the value of the illegal frame counter
can differ from measuring point to measuring point.
PROFview XL 9

3 Description of Functions and Measuring Principle User Manual PROFview XL
The master simulator can be operated at all baud rates and can determine all PROFIBUS stations of the
plant - and poll their ID numbers. These can be used to provide the assignment to the device master file
(DMF) of the manufacturer and to display the most important information. While the master simulator is run-
ning, the physical bus properties (quality level, disturbance-free voltage range and edge steepness) can be
measured and thus the signal quality of the entire PROFIBUS installation can be checked. Any stations which
are not functioning and any duplicated address assignments can thus also be located. The master simulator
continuously checks the whole possible address range (0 through 126) and will also find stations which are
only connected to the PROFIBUS later.
The master simulator must be operated exclusively on idle PROFIBUS plants, i.e. no other master station
must be operating. To disconnect the master station (if present and ready for operation) from the bus for use
of the PBT master simulator, the PBT accessories include a so-called bus disconnector. This is simply insert-
ed between the master station and its SUB-D 9 bus connector. When doing so, however, it should be ob-
served that the connector of the master station should not simply be removed; otherwise, a defect in the ca-
ble will result4and the terminator will not be powered at this point.
The frames of the PBT master simulator are not visible to the PBT. The address of the PBT changes dynami-
cally between the PROFIBUS addresses still free to ensure that the whole address range is available for the
stations during the start-up.
3.4.2 Station scan
This function automatically determines all stations connected to a PROFIBUS plant and ready for communi-
cation. This so-called live list will include all addresses of devices from which at least one valid frame has
been received. The completion of this measurement is the prerequisite both for measuring the physical bus
characteristics and for determining the topology. The station scan can be performed both on a running and
on an idle plant (in this case, with the PBT master simulator). When using the PBT master simulator, the ID
numbers (device codes) of the PROFIBUS stations are also determined, providing an assignment to the devi-
ce master files.
3.4.3 Detection of duplicated addressing
The PBT can detect PROFIBUS addresses assigned twice or more. This is done by detecting bus collisions.
This check for double addressing is performed during the station scan.
3.4.4 Topology scan
The topology scan function can determine the lengths of the lines between the individual PROFIBUS stations
and thus their topological order. This measurement must only be performed on an idle PROFIBUS plant, i.e.
without active master station (to this end, disconnect the master from the bus, as described in Section
3.4.1 "Master simulator") and with activated master simulator. The distance to the PROFIBUS master sta-
tions can therefore not be determined automatically.
4 In accordance with IEC 61158-2, each PROFIBUS connector should contain four inductivities in the signal lines A and B to com-
pensate the connection capacity of a PROFIBUS station. A PROFIBUS connector which is not connected will not have this capaci-
ty, and its inductivities will lead to undesired signal reflections.
10 PROFview XL
Table of contents
Other Indu-Sol Test Equipment manuals


