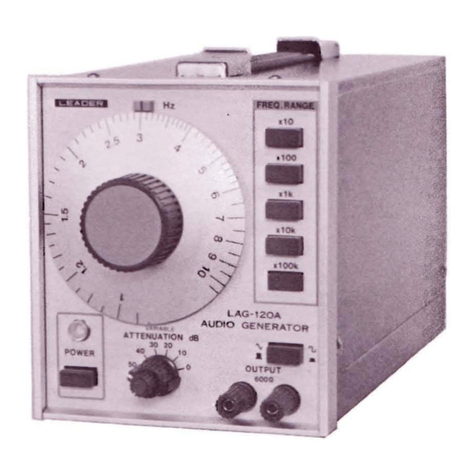
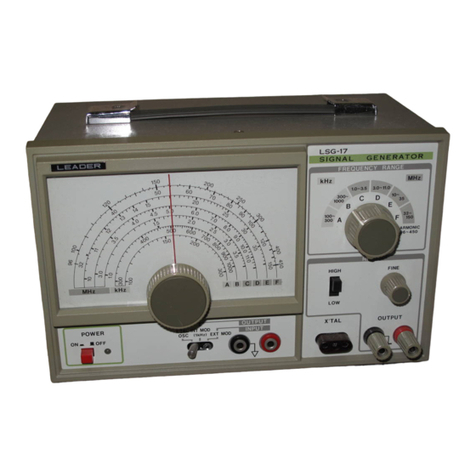
Leader Electronics Corp. LAG-125 User manual

LAG-125
LOW DISTORTION
AUDIO GENERATOR
INSTRUCTION MANUAL

CONTENTS
SECTION page
1GENERAL DESCRIPTION
1.1 Uses 2
1.2 SpeciHcations 2
1.3 Control Functions ^
1.3.1 Front Panel ^
1.3.2 Rear Panel ^
2OPERATION
2.1 Preliminary Notes 5
2.2 Output Connections ^
2.3 Interconnections g
2.4 Sine Wave Output g
2.4.1 Input/Output Characteristics g
2.4.2 Output Meter Roadings ^
2.4.3 Frequency Response 7
2.4.4 Harmonic Distortion Measurements g
2.5 Square Wave Output ^
2.6 Burst Output Signals jq
2.6.1 General jq
2.6.2 Loudspeaker Testing
2.6.3 Amplifier Testing 22
2.7 Use of the SYNC Connection 23
2.8 Notes on Output Connections 24
3MAINTENANCE
3.1 Fuse Replacement 24
3.2 Exposing the Chassis •24
3.3 AC Input Connections 25
3.4 Location of Adjusters 26
FUNCTIONAL BLOCK DIAGRAM
SCHEMATICS
(1)

1. GENERAL DESCRIPTION
1.1 Uses
The LAG-125 is particularly designed for measurements and tests of audio and supersonic
equipment and circuits. The three different types of output signals will find many applications in
testing high fidelity amplifiers, filter networks, and loudspeakers.
FEATURES
*Wide frequency range, lOHz to IMHz, with flat output response.
*Low distortion sine wave output.
*Clean-cut square waves for transient response testing and triggering pulse generators.
*Burst type signals for loudspeaker testing.
*Calibrated attenuator, and voltmeter for accurate output control.
*Pushbutton frequency ranging.
*Frequency synchronization possible from external source.
*Tilt-up stand for easy operation.
1.2 Specifications
Frequency Range
Frequency Accuracy
Output Functions
Sine Wave
Square Wave
Burst Signal
lOHz -IMHz in 5decade ranges.
Within 3% of dial marking.
Output voltage:
Distortion:
Output voltage:
Overshoot:
Sag;
Rise Time:
Output Voltage:
Gating:
Leakage:
3Vrms into 600J2.
0.03% :500Hz -20kHz
0.1% :lOOHz-lOOkHz
0.5% :50Hz- 500kHz
1% :lOHz -IMHz
3Vp-p into 600J2.
2% at maximum output.
5% at lOHz.
0.15/is (0.45jUs at floating output.)
1.5Vp-p into 600^2.
4cycles at 4and 12 cycle intervals; 8cycles at
8cycle interval.
Within 2% during off interval at 20kHz.
Frequency Synchronization
Control
Output Data
Output Impedance
Response
Approx. ±0.5% per volt rms.
600n ±3%; unbalanced and floating.
Flat within ±0.3dB into 600f2 at unbalanced output; to lOOkHz
at floating output.

Output Control
Output Meter
Power Supply
Size and Weight
Accessory, furnished
Total range: -50 to +10dBm (2.45mV -3.1Vrms) with lOdB
step attenuator and fine adjuster.
Voltage range: 0-1and 0-3Vrms.
Decibel range: -10 to +2dB (OdB =0.775V)
Accuracy within ±5% f.s.
100, 115 or 230V, as specified, 50/60Hz; approx. 12VA.
165(H) X205(W) X250(D) mm
61/2(H) X8(W) X97/8(D) IN
approx. 5.5kg.
12.1 LBS.
Output cord, w/plugs and clips 1ea.
1.3 Control Functions
1.3.1 FRONT PANEL, FIG. 1-1.
Fig. 1-1 Front panel.
(1) Frequency dial: Calibrated in Hz, 1to 10; actual output frequency depends on the setting
of the range selector.
(2) Fine frequency adjuster.
(3) FREQUENCY RANGE selector: Set the range multiplier for dial markings.
(4) FUNCTION switch: Selects the type of output signals, sine wave, square wave, and burst
[see (14)]
(3)

(5) 600r2 SHUNT switch: Connects a600n load resistor across the output.
(6) OUTPUT terminals: Black at left is for chassis ground; black at middle is the low
potential side of the output; red is the high potential side of the output.
(7) Shorting link: Connected across the black terminals at the unbalanced output condition
(not used when floating output is required).
(8) OUTPUT LEVEL switch: Adjusts the output in lOdB steps.
(9) VARIABLE control: For fine adjustment of the output between the lOdB steps.
(10) POWER switch: Push-push type for turning on the AC power.
(11) Pilot lamp: Indicates when the power is on.
(12) Output meter: Calibrated in rms volts with two scales, and dBm (OdB =0.775V).
(13) Mechanical zero adjuster for the meter.
1.3.2 REAR PANEL. FIG. 1-2.
®(@ ®
Fig. 1-2 Rear panel functions.
(14)
BURST signal selector: Set the mode of the burst output signals.
(1 5) SYNC terminals: For connection to an external frequency synchrnizing source.
(16) FUSE holder: For the AC line fuse.
(17) AC input cord.
(18) Label.
(19) AC cord hooks.
(4)

2. OPERATION
2.1 Preliminary Notes
1. When the output is connected to a circuit in which DC voltage is present, always connect a
blocking capacitor in series with the “hot” lead. This is to prevent damge to the output
circuit. The capacitor should have low reactance at the test frequency and suitable voltage
rating.
2. Use short leads for connections. The cord supplied will introduce aloss of less than 0.2dB at
IMHz. Along shielded cable will degrade the high frequency characteristics.
3. When the “floating” output connection is used, the frequency response of ±0.3dB is
applicable only up to lOOkHz. Further, the square wave rise time will be increased to 0.45iUs
maximum.
2.2 Output Connections
1. Unbalanced :
Connect the shorting link across the two black terminals. Insert the cord lead plugs -black
to black and red to red respectively.
The black lead should be used on the ground side on the chassis of the test circuit.
2. Floating:
Remove the shorting link on the black terminals.
Use the middle black terminal and red terminal for the output. If required, connect alead
between the left black terminal and ground side of the chassis.
2.3 Interconnections
The basic interconnections are shown in Fig. 2-1.
Fig. 2-1 Basic interconnections.
The specified load resistance, R, is connected across the output of the test circuit. It should be
non-inductive and have awattage rating at least twice the expected maximum power output.
In measuring the input/output voltages, an electronic voltmeter is required. The Leader
LMV-87A is recommended for the purpose.
(5)

An oscilloscope is required when measuring with use of square waves or burst signals. The
Leader LBO-301, or LBO-502, is most suited.
2.4 Sine Wave Output
In most amplifier measurements, sine wave signals are used. In this section, typical uses will be
described.
2.4.1 INPUT/OUTPUT CHARACTERISTIC
Control settings:
POWER switch at on.
FUNCTION at sine wave.
FREQ RANGE at xlk and dial at “1” for IkHz.
OUTPUT LEVEL, initially at 40 and fine adjuster set fully counterclockwise.
600n SHUNT switch at released position.
The input voltage to the amplifier is gradually increased by advancing the VARIABLE control
and lowering the attenuation with the switch towards OdB. The amplifier output will increase as
the input voltage is raised.
When the amplifier is overloaded, there will be no apparent increase in the output and
waveform distortion will be observed, i.e., flattening of one or both peaks of the trace.
By noting the input and output voltages, these values are plotted on log-log paper. In this
manner, the input voltage range of the amplifier can be easily determined.
When the ration Eout/E in is calculated, the voltage gain is given as follows:
Eout
VOLTAGE GAIN in dB =20 log £in
Reference should be made to adecibel table for the dB figures.
The results for voltage gain in dB can be plotted on semi-log paper, using the X-axis for Ej^^
and Y-axis for dB.
The power output is calculated from the relation -
Eout ^(volts)
POWER OUTPUT. Po in WATTS ^‘
R(ohms)
2.4.2 OUTPUT METER READINGS
The output meter is calibrated to indicate the dB level, or voltage, only at the sine wave
function into a60012 load.
The range depends on the setting of the OUTPUT LEVEL switch. Other data are shown in the
table below.
(6)

OUTPUT METER RANGES
OUTPUT LEVEL
SETTING VARIABLE
dB RANGE VARIABLE VOLTAGE
RANGE METER
SCALE
+10 0to +12 0.775 —3.1 Vrms 0-3
0-10 to +2 0.245 -1.0 0-1
-10 -20 to -8 0.0775 -0.31 0-3
-20 -30 to -18 0.0245 -0.10 0-1
-30 -40 to -28 0.00775 -0.031 0-3
(7.75mV —31mV)
-40 -50 to -38 0.00245 -0.010 0-1
(2.45mV -lOmV)
NOTES: a. At the +10dB setting, the pointer will go off scale when the load is
greater than 600J2.
b. For corrections when the load is different than 600f2, refer to Section 2.8.
2.4.3 FREQUENCY RESPONSE
The frequency response of an amplifier is determined by applying aconstant voltage to the
amplifier. This voltage is chosen so that the amplifier is operated below the overload point.
Set the reference frequency at IkHz, or 400Hz, and set the output controls for asuitable
output from the amplifier.
Note the input and output voltages.
Set the measuring frequencies with the FREQ RANGE switch and dial to lOHz, or higher if
required.
Since the generator output is practically constant at all frequencies, the input voltage will not
require any adjustment. However for the highest accuracy, the input at each frequency can be
adjusted to the predetermined value.
The output readings can be simplified by noting the output level in dB at the reference
frequency (1kHz or 400Hz). Then at each frequency the dB indication is noted and used in
plotting the response curve. (NOTE: Disregard the OdBm -0.775V, etc. in this case. The dB
readings can be read directly since the voltmeter is connected across aconstant impedance.)
The dB readings are added or subtracted from the IkHz reference level.
Example: Let “dB” at IkHz --2dB. Assume that the measured values are as in (A) in the
following data.
FREQ (Hz) 20 60 200 600 IK 2K 6K 20K
(A) dB
measured -6 -5 -2 -2 -2 -2 -1 -6
(B) dB -4 -3 0000+1 -4
(7)

The dB figures for (B) are used in plotting on semilog graph paper with the X-axis for fre-
quency and Y-axis for the relative response in dB.
4.4 HARMONIC DISTORTION MEASUREMENTS
The low output distortion characteristics of the LAG-125 make it possible to measure the
distortion in audio amplifiers.
For the measurements, aharmonic distortion meter, such as the LEADER LDM-170 and a
sensitive scope are required. The interconnections are shown in Fig. 2-2.
DISTORTION METER SCOPE LBO-502
Fig. 2-2 Harmonic distortion measurement.
Connectionst SCOPE output of the distortion meter to the horizontal scope input.
Test amplifier output to the distortion meter and also to vertical scope input.
With these connections, the scope will display the lissajous patterns for monitoring the
amplifier output. It will be possible to discriminate between the waveform distortion and the
noise components. Some examples of the display are shown in Fig. 2-3.
Co o<o
>2nd HARMONIC >3rd HARMONIC
HIGHER HARMONICS
Fig. 2-3 Lissajous patterns.
(8)

For accuracy in measurements, especially at low values, it is necessary at the test frequencies
and output levels to measure and note the distortion in the LAG-125 signal. This step is required
since the distortion meter indicates the total distortion, i.e., amplifier and oscillator outputs.
The distortion is then measured on the meter and noted. The actual amplifier distortion is
calculated from the relation -
(1)
where -Amplifier distortion in %
Dm -Distortion meter indication in %
DqSC ~Oscillator distortion in %
In simplified form, (1) may be expressed by -
The factor, K, for (2) is listed for convenience in the following table.
FACTOR “K” for (2)
^osd^M KDoSC^D,^ K
0.90 0.436 0.60 0.80
.85 .526 .50 .866
.80 .60 .40 .916
.75 .661 .30 .954
.70 .714 .20 .978
.65 .758 .10 .995
In general, when the oscillator distortion is less than 1/5 of the amplifier distortion, the meter
indication can be used without correction.
2.5 Square Wave Output
Square wave signals are useful in the rough determination of response characteristics of
amplifiers at the high and low frequency ends, and also response to signals with fast rise time.
The interconnections are identical with those for sine wave operation with the following
exceptions:
FUNCTION switch at square wave.
Use of agood scope, i.e., with fast rise time.
The chart given below shows the waveforms at the amplifier output under different
conditions.
NOTES: Output voltage settings are initially made with the OUTPUT LEVEL
(9)

adjustments (switch and meter indication) and the FUNCTION switch set at the
sine wave position.
The indicated value will be equal to the peak-to-peak output voltage.
The FUNCTION switch is then set at the square wave position. Disregard the
panel meter reading.
If in doubt, check the p-p output voltage with acalibrated scope.
Waveshape Amplifier Response Condition
RECTANGULAR
SATISFACTORY
FLAT
DROOPING
rtAj A"LOW PRIMARY INDUCTANCE
INOUTPUT TRANSFORMER:
INCORRECT VALUES OF THE
COUPLING ELEMENTSDEFICIENT LOW FREQUENCIES
PEAKED
AA HIGH LEAKAGE INDUCTANCE
IN OUTPUT TRANSFORMER*
OR HIGH DISTRIBUTED
CAPACITANCE IN CIRCUIT
\
DEFICIENT HIGH FREQUENCIES
RIPPLE
riiU AMALADJUSTMENT IN THE
NEGATIVE FEEDBACK
CIRCUIT; INCORRECT
CONSTANTS; INSTABILITY
'RINGING AT HIGH FREQUENCY
For an amplifier with good characteristics, the response will be flat up to about the 11th
harmonic as indicated with sharp square wave displays. As an example, if aIkHz square wave is
reproduced without distortion, the amplifier response is flat to about 11 kHz.
NOTES: a. It is advisable to check the input waveform on ascope before application.
b. The rise time of the “floating” output connection is 450ms maximum.
c. Connection from the SYNC output terminals to the scope time base
synchronizing input will make adjustments easier when displaying
waveforms.
2.6 Burst Output Signals
2.6.1 GENERAL
Three types of the burst signals are available, depending on the setting of the signal selector on
the rear panel. The modes are shown in Fig. 2-4.

4cycles on, 4cycles off
-AAAAy WW
8cycles on, 8cycles off
^WWWVV
4cycles on, 12 cycles off
-'\AAAj
AAAAj WJV
AAAAA/WV
AAAA^
Fig. 2-4 Burst signals.
As shown in Fig. 2-4, the output signal is applied during the on condition and blanked during
the off period. The type to be used depends on the application; examples are given below.
NOTES: Output voltage settings are initially made with the OUTPUT LEVEL
adjustments (switch and meter indication) and the FUNCTION switch set at sine
wave.
When the FUNCTION switch is set at BURST, the actual output (sine wave
signal) will be approximately 1/5 of the original setting. Disregard the meter
reading.
If in doubt, check the peak-to-peak voltage of the waveform, using acalibrated
scope. (Multiply the Vp-p by 0.353 for the rmsvolt).
2.6.2 LOUDSPEAKER TESTING
Loudspeakers can be tested with the burst signals for their operating characteristics.
The frequency response, cone-support system effects, and other important data can be
determined by noting the changes in the output waveforms.
Furthermore, the relationship between the motional and the “static” impedances can be
observed. When the loudspeaker is driven with ahigh impedance source, (a mismatched
condition), inefficient damping will be shown by the appearance of spurious waveforms during
the off period.
Interconnections for testing are shown in Fig. 2-5.
LAG- 125
ANECHOIC ROOM Fig. 2-5 Loudspeaker testing.
(II)

A2*channel scope is most suitable for testing, since the input and output waveforms can be
readily compared.
The FUNCTION SWITCH IS SET AT BURST and the type of the signal to be applied is
selected by the rear panel switch.
Examples are shown below for use of the test burst signals.
2.6.3 AMPLIFIER TESTING
Generally audio amplifiers have excellent transient characteristics and will not exhibit the
same results as loudspeakers. However, burst signals can be used to check amplifier frequency
response.
The tests are made with use of a2-channel scope; the interconnections are shown in Fig. 2-6.
Fig. 2-6 Amplifier testing with burst signals.
The change in the waveshape at the trailing end of the on cycle is observed. The waveshapes
and the amplifier conditions are shown in the table below for the 4-on and 4-off signal.
(12 )

WAVESHAPE CONDITION RESPONSE
(1)
wvv—miv SATIS FACTORY /\
(2)
aaaa..— DEFICIENT LOW FREQUENCIES
{3j
\NW—\im DEFICIENT HIGH FREQUENCIES /
It may be added that checks can be made on circuits with time-constant properties.
Waveshapes (2) and (3) respectively denote leading and lagging characteristics.
2.7 Use of the SYNC Connection
A. General:
The sync connections, on the rear panel, can be used in several applications as described
below. The “input” or “output” impedance is approximately 70kn.
PRECAUTION
When using the SYNC feature, it is important that the
generator output be in the unbalanced condition, i.e.; the
two black terminals are shorted. This will prevent in-
stability and other undesirable effects.
B. Control from an external source:
The oscillator frequency can be synchronized with an accurate source over arange of ±0.5%
per rms volt input. The control voltage should not exceed 5Vrms to avoid output distortion.
For example, when the oscillator is set at some point between 995 and 1005Hz, and asignal
of exactly lOOOHz is applied, the oscillator will be automatically locked in at lOOOHz. Thus, high
accuracy can be achieved with the use of aprecision frequency standard.
In another application, adistorted waveform can be “purified”, or filtered, by passing it
through the oscillator.
C. The SYNC output voltage, approximately l.SVrms, should be sufficient to synchronize or
trigger the sweep in ascope or to operate afrequency counter. The voltage is not affected by the
settings of the output level controls.
(13 )

2.8 Notes on Output Connections
The output circuit is designed to work into a600^2 load; level and voltage calibrations are
made on this basis.
When the load is higher or lower, the use of amatching pad or transformer is advised.
For loads higher than 600f2, set the 600f2 SHUNT switch at on. This will prevent the meter
from going off-scale at the maximum output condition, i.e., switch at +10 and the adjuster at full
clockwise. (The output impedance will be lowered to 300S2).
For low-power low-impedance circuits, connect aresistor in series with the load to make the
total impedance 600f2.
When testing stereo circuits, equal voltage to two input circuits can be applied with use of a
matching pad as shown in Fig. 2-7.
Fig. 2-7 Stereo input pad.
The voltage across the 600J2 loads will be one-half that of the input voltage, or lower by 6dB.
3MAINTENANCE
3.1 Fuse Replacement
When replacing the AC line fuse (at rear of the case), make certain that the proper rating is
used as given below:
LINE VOLTAGE
100 -120
200 -240
FUSE RATING
0.5A
0.3A
3.2 Exposing the Chassis
The top and bottom covers are taken off by removing the screws as shown in Fig. 3-1.
(14 )


SQUARE
SINE
BURST
OUTPUT LEVEL
-
VARIABLE
I
I-
I
.XBUFFER
AMPLIFIER
ATTENUATOR
+10 to -40dB
in lOdB STEPS
600n SHUNT
1
METERING ^METER
AMPLIFIER *<y
FUNCTIONAL BLOCK DIAGRAM; LAG-125

OSCAMP
t
AGC
I
AUDIO
GENERATOR
|
LEADER
ELECTRONICS
COflP.

METER
MS01
SCHEMATIC
Moa«
LAG
125
Q-B16
MAIN
I
AUDIO
GENERATOR^
LEADER
ELECTRONICS
CORP.
Table of contents
Other Leader Electronics Corp. Portable Generator manuals
Popular Portable Generator manuals by other brands
EMB
EMB Wallenstein HD5000E Operator's manual

Generac Power Systems
Generac Power Systems MC4000 owner's manual

Contractor Line
Contractor Line GEN8000 instruction manual

Stamford
Stamford UCI 274 Installation, service & maintenance manual

EINHELL
EINHELL TC-PG 5500 Original operating instructions

Evans
Evans GT190MG3500BS owner's manual