CS 2890 Power Simulator / Calibrator Table of contents
7
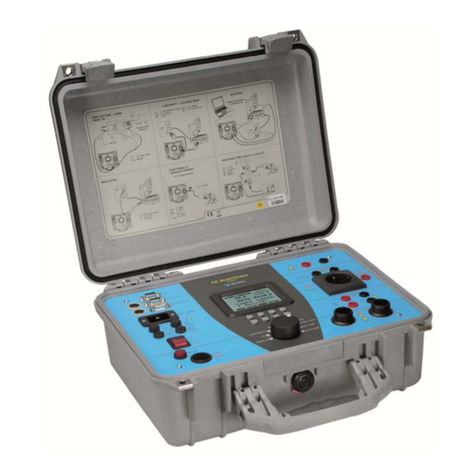
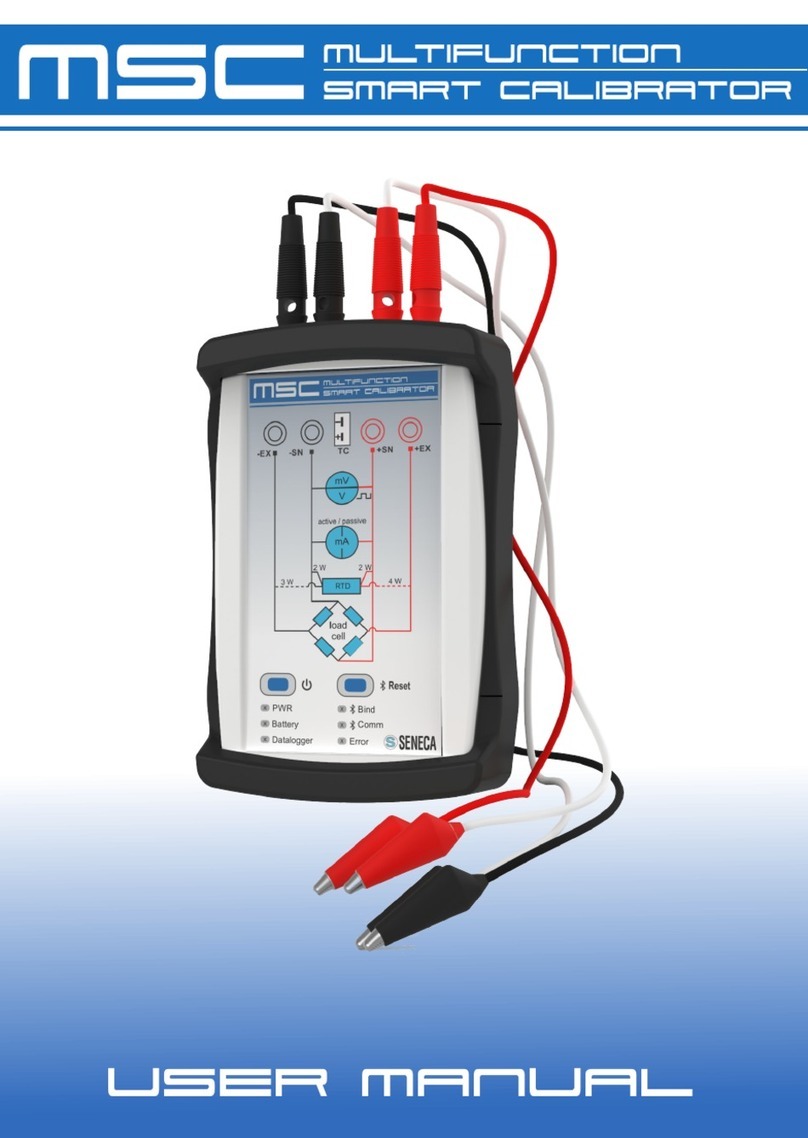
Figure 1: CS 2890 Power Simulator/Calibrator instrument..............................................9
Figure 2: Front panel .....................................................................................................13
Figure 3: Front connector panel.....................................................................................14
Figure 4: Upper connector panel ...................................................................................14
Figure 5: Bottom view....................................................................................................15
Figure 6: General setup menu.......................................................................................16
Figure 7: Colour representation of phase voltages........................................................16
Figure 8: Calibrator screen............................................................................................17
Figure 9: Calibrator screen - “Default” and “Adjusted” CS 2890 voltage output..........18
Figure 10: Adjustment screen........................................................................................19
Figure 11: CS 2890 Calibration certificate –voltage output...........................................20
Figure 12: Adjustment procedure using values from the calibration certificate..............20
Figure 13: Connection for the voltage adjustment procedure using substandard Volt-
meter .............................................................................................................................21
Figure 14: Voltage adjustment procedure using values from the substandard Volt-meter
.......................................................................................................................................22
Figure 15: CS 2890 Calibration certificate –current output...........................................22
Figure 16: Current adjustment procedure using values from the calibration certificate .23
Figure 17: Connection diagram for current adjustment procedure using substandard
Volt-meter......................................................................................................................23
Figure 18: Adjustment procedure using values from the substandard Volt-meter .........24
Figure 19: Reset of Adjusted values to default one .......................................................24
Figure 20: Voltage, Current value is NOT Adjusted (marked with sign “*”) ....................24
Figure 21: Voltage, Current value IS Adjusted (without sign “*”)....................................25
Figure 22: Instrument info screen..................................................................................25
Figure 23: Power Simulator Display symbols and keys description...............................26
Figure 24: Common display symbols and labels on SCOPE screen .............................27
Figure 25: Instrument status bar....................................................................................27
Figure 26: Main menu –Simulator window....................................................................29
Figure 27: Current lags voltage by 25° angle.................................................................31
Figure 28: Current leads voltage by 5° angle.................................................................31
Figure 29: Manual set time delay dialog........................................................................33
Figure 30: Swapping instrument channels.....................................................................34
Figure 31: Entering into Scope screen presentation......................................................35
Figure 32: Voltage and current waveform mode............................................................35
Figure 33: Voltage and current waveform mode - single mode and dual mode.............36
Figure 34: Phase diagram screen..................................................................................37
Figure 35: Unbalance diagram screen...........................................................................38
Figure 36: 230V fundamental voltage signal with added 5% of 3rd, 5th and 7th harmonic
.......................................................................................................................................39
Figure 37: Voltage harmonics settings screen...............................................................39
Figure 38: Current harmonics settings screen...............................................................39
Figure 39: Set harmonic selection window ....................................................................40
Figure 40: Harmonics histogram screen........................................................................41
Figure 41: Flicker settings menu....................................................................................42
Figure 42: U,I: Parameters screen.................................................................................43
Figure 43: Set voltage selection window........................................................................43
Figure 44: Set current selection window........................................................................43
Figure 45: Set phase selection window .........................................................................44
Figure 46: Set frequency selection window ...................................................................44


