Osram AS7056 User manual

1
Sensing is life
AS7056/57 Evaluation Kit
08/02/2022
Quick Start Guide

2
AS7056/57 Evaluation Kit
Quick Start Guide
AS7056/57 EVK
Install Software
How to Use
AS7056/57 PC Software
Logging Data
FW Upgrade
3
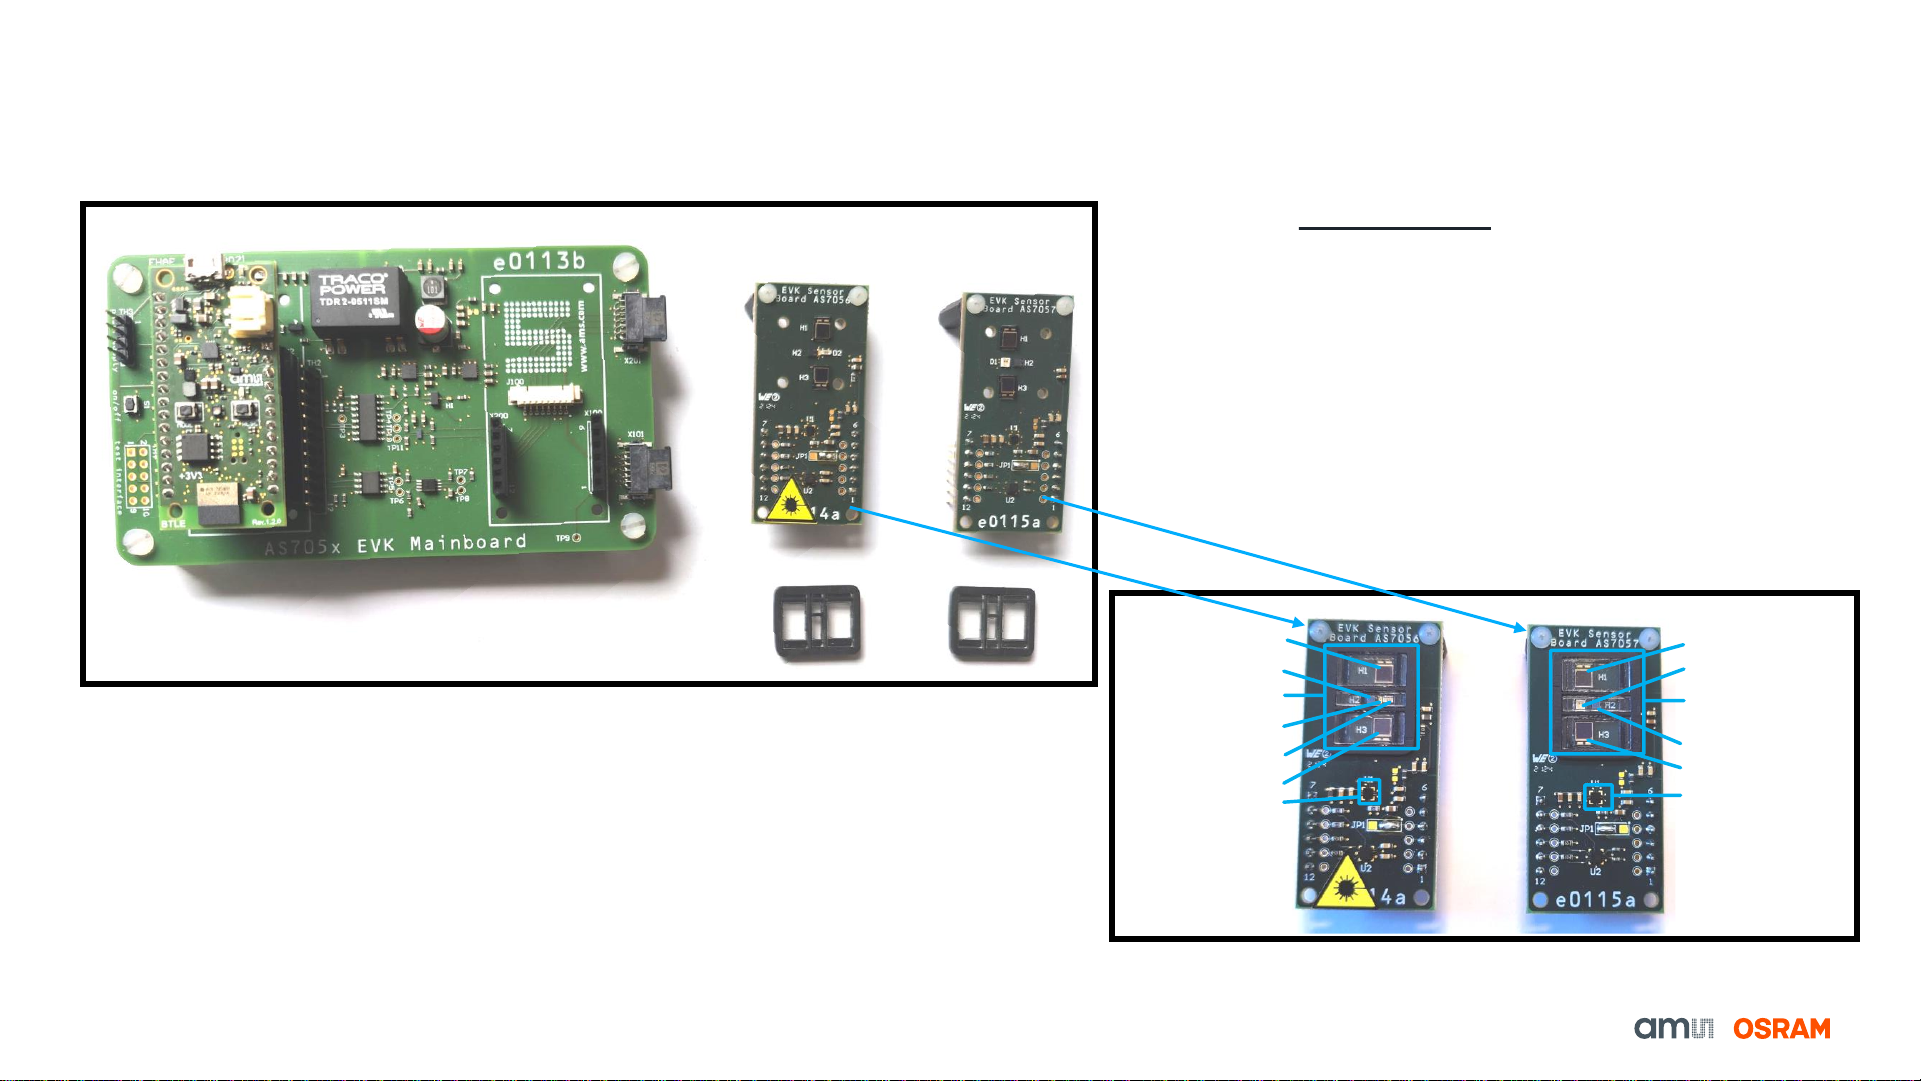
Contents of the AS705x Evaluation kit
AS705x Evaluation kit parts
Out of the Box
•1–AS705x EVK Mainboard
•2–Generic Bluetooth Board
•3–AS7056 Sensor board
•4–AS7057 Sensor board
•5–Optical Barrier & Cover Glass
•6–Optical Barrier & Cover Glass
•7–Micro USB cable included in the box
Fig. 1: AS705x Evaluation Kit out of the box
1
2
34
5 6
SFH2201
SFH7016
Optical Stack
SFH2704
SFH2201
AS7057 AFE
SFH2201
SFH2704
Optical Stack
SFH7015
SFH2201
AS7056 AFE
V00161
Fig. 2: AS7056 & AS7057 Sensor Boards
4
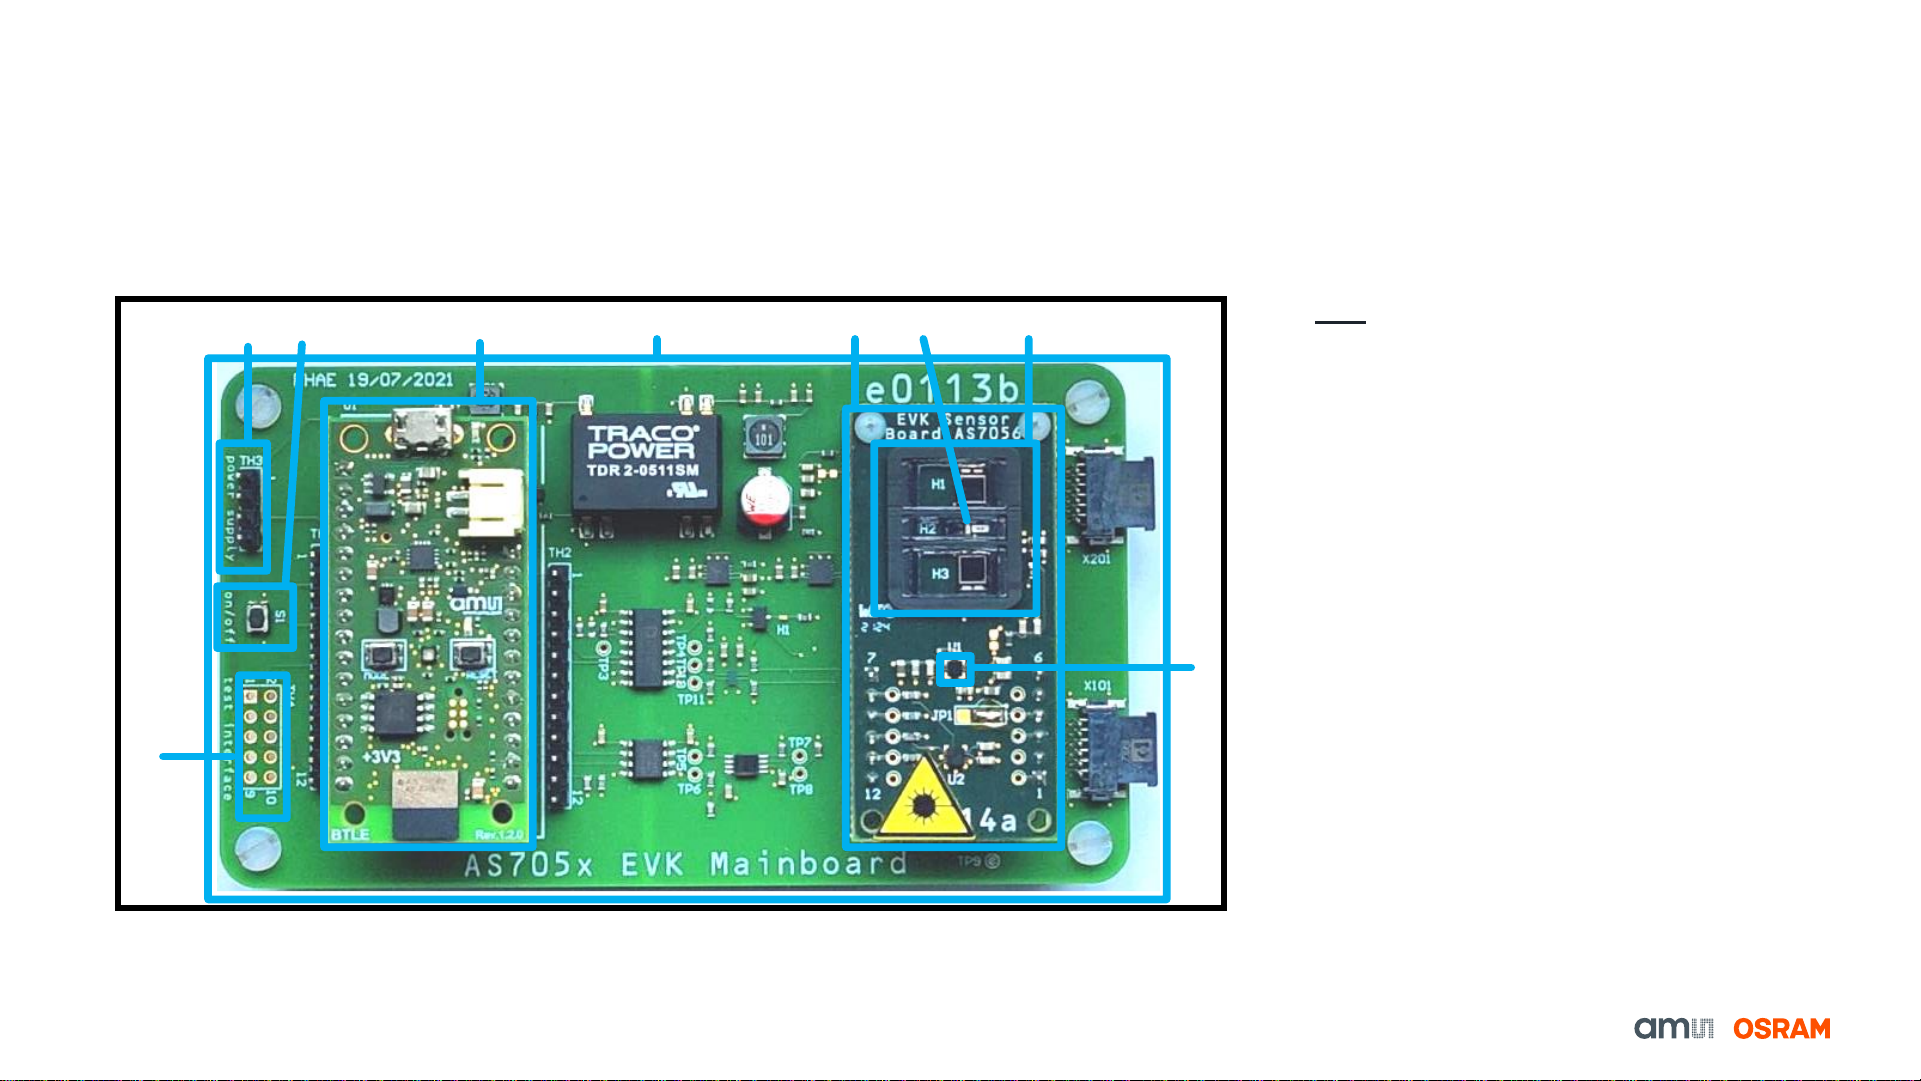
Contents of the AS7056 Evaluation kit
Evaluation kits main parts
5432
1
6
78
9
Key
•1–AS7056 AFE
•2–Optical Module
•3–VCSEL laser diode
•4–AS7056 Sensor board with Optical
Module
•5–AS705x EVK Mainboard
•6–BLE Controller Board
•7–EVK power supply On/Off button
•8 –Power Supply Test Interface
•9–Power supply & I2C Connection /
Test Interface
Fig. 3: AS7056 Evaluation Kit top view
5
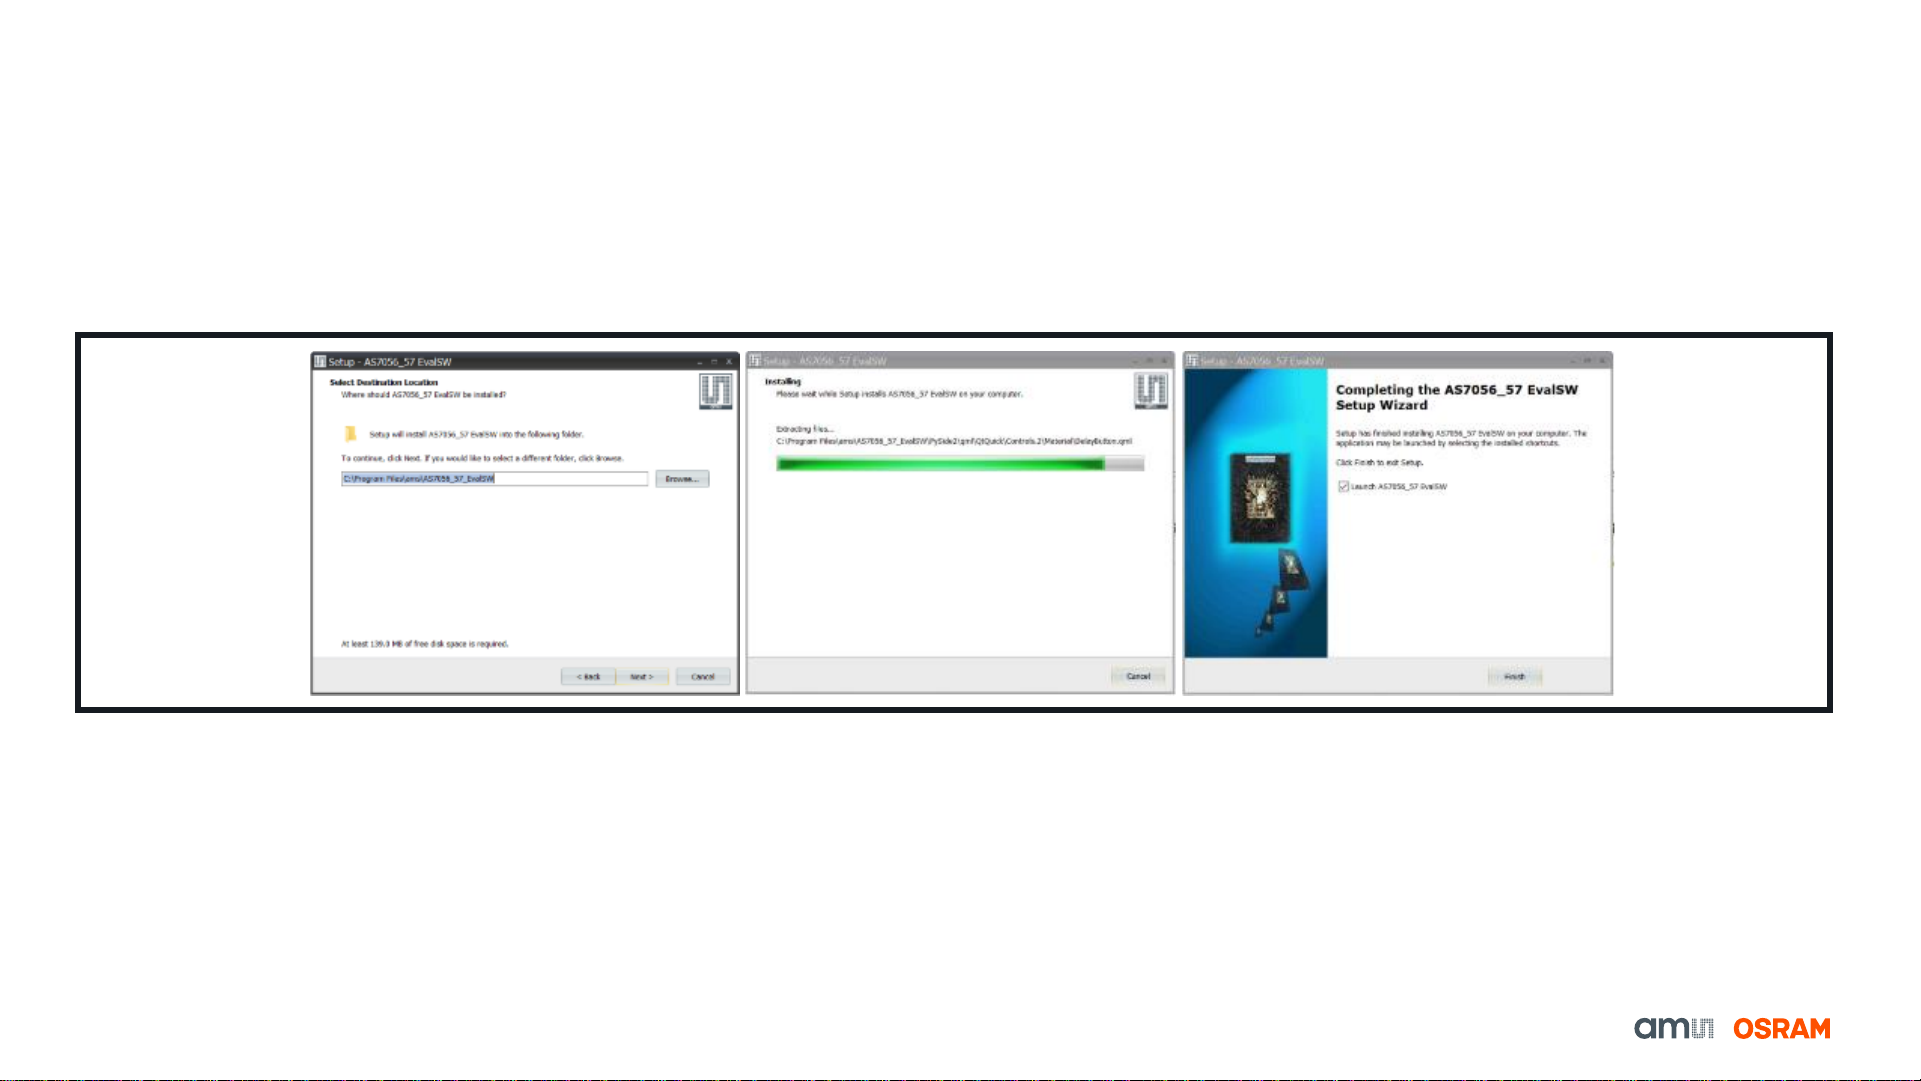
AS7056/57 PC Software
Installation
To install, start the installer executable and follow the instructions as shown in Fig. 4 below (left to right).
Fig. 4: AS7056/57 Software Installation steps
•Note: The EVK software is available for download (please contact the ams OSRAM support team (support_aws@ams-osram.com) for the download link)

6
Setup
Getting Started
1. Connect the micro USB to USB cable to the board and plug it
into your computer.
2. Afterwards, press the S1 button for 1 sec to turn on the sensor
board.
3. The green LED on the Bluetooth Microcontroller module and
USB connector board will light up as soon as the board is
powered.
4. The green LED (H1) on the mainboard will light up as soon as
the board is powered.
5. Start the EVK GUI software.
Fig. 5: AS7056 Evaluation Kit power ON
AS705x EVK Mainboard On/Off Button (S1)
ON: Press the button for 1 Sec
OFF: Press the button for 2 sec

7
AS7056/57 PC Software
Overview of GUI
Fig. 6: Overview of SW GUI
The GUI consists of three main
segments highlighted with the three
rectangles.
•The one on the top has the
register map list option, load
and save configuration file, save
the log file with the timestamp,
enable moving average filter (if
needed) and update the
firmware.
•The one is the middle has
control functions with three tabs
-> Configuration, Overview,
Application and Measurement
•The status bar at the bottom is
connection information,
configuration file information,
measurement condition and
logging status.
8
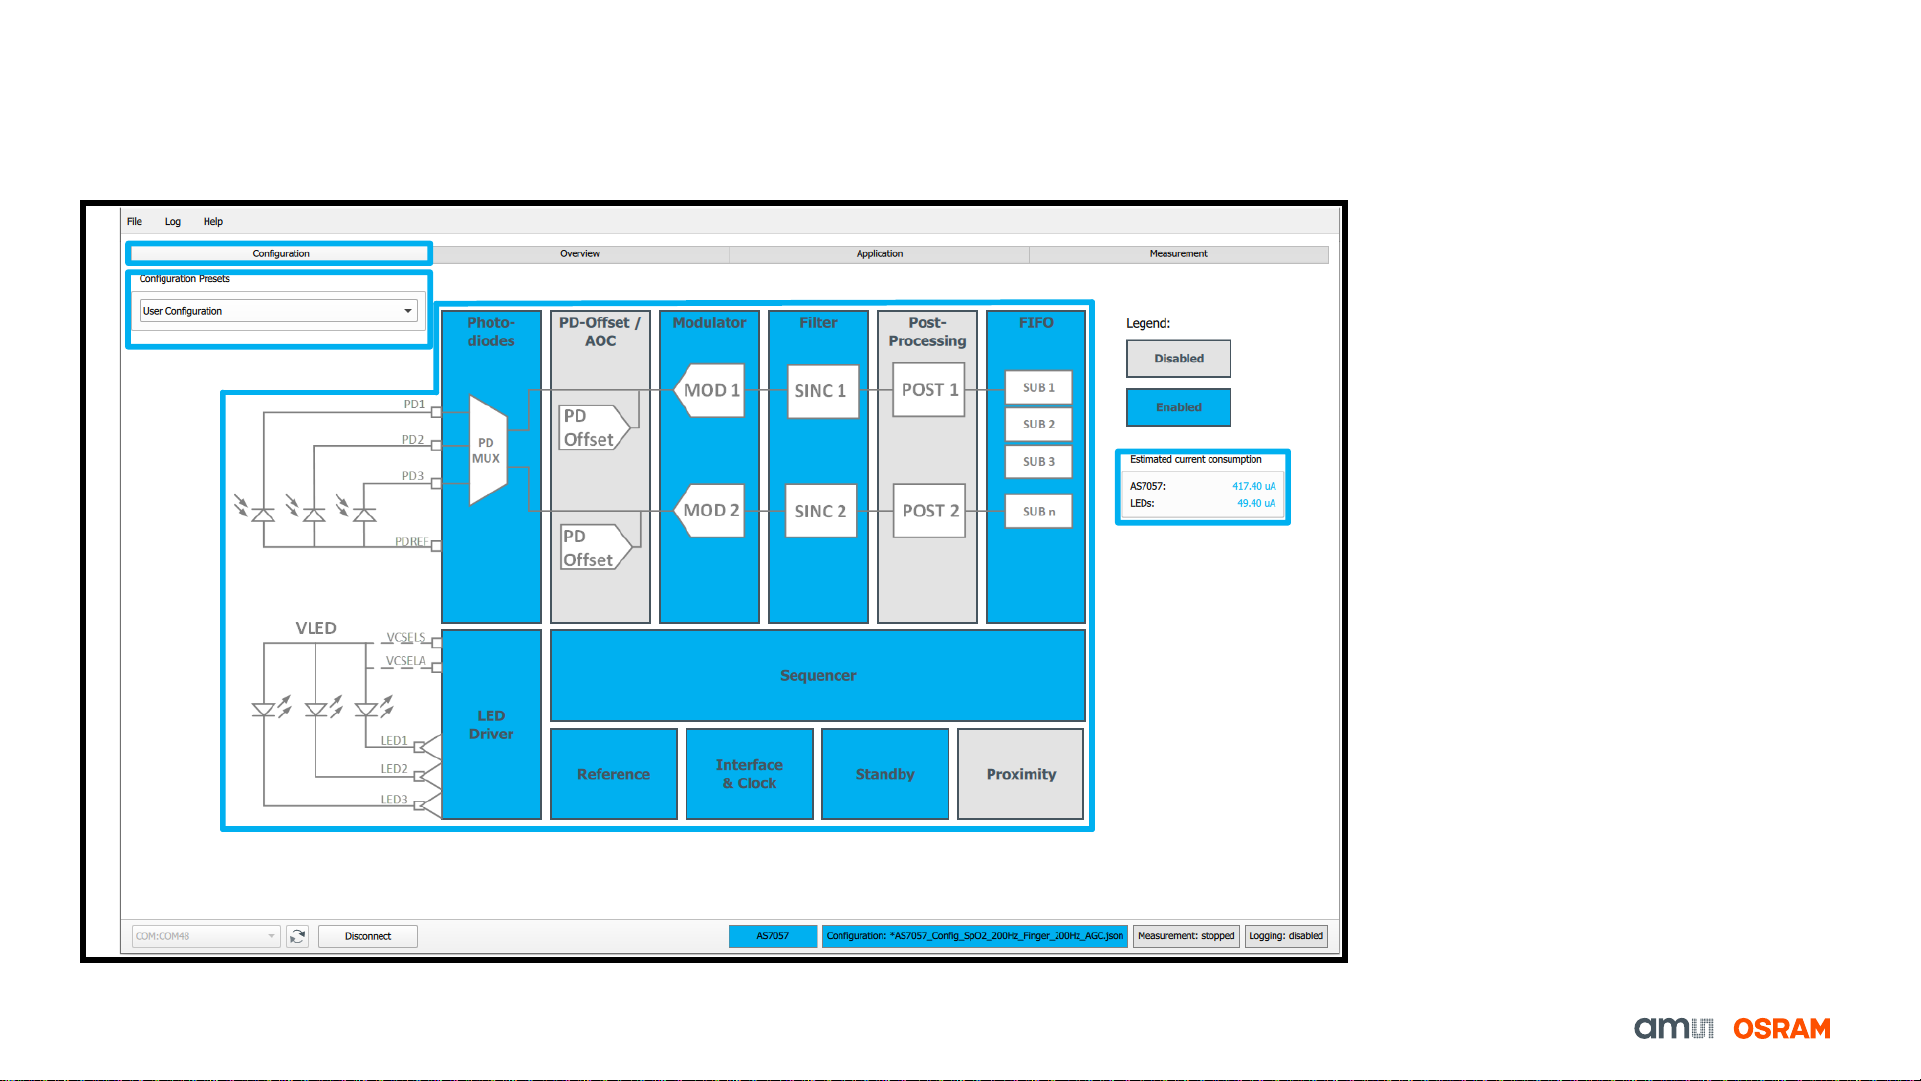
AS7056/57 PC Software
Overview of GUI –Configuration Tab
1. After launching the EVK GUI, the
“Configuration” tab is displayed.
2. A few configuration presets are
provided for the user to quickly
start using the device. These can
be chosen from the 'Configuration
Presets' Tab. Each file comes with
a description which lets the user
know which measurements could
be done using these.
3. Block diagram of the AS7056/57.
Blue color shows which sub-blocks
are is enabled and grey color
shows which sub-blocks are
disabled in a particular
configuration file. Each sub-block
can be accessed by clicking on it.
4. The estimated current consumption
of the AS7056/57 and LEDs during
measurement are displayed.
Standby mode is activated to put
the analog blocks to sleep after the
end of the measurement.
Fig. 7: Overview of SW GUI –Configuration Tab
4
1
2
3

9
AS7056/57 PC Software
Overview of GUI –Overview Tab
1. Aquick overview of the
device parameters and
provides general information
about the setting
configurations, which can be
found in the "Overview" tab.
2. Which parameter value is set
for a specific measurement
configuration can be seen in
each parameter block. For
example –LED current, LED
combination, modulator,
sequencer parameters, SINC
filter, etc.
Fig. 8: Overview of SW GUI –Overview Tab
1
2
10
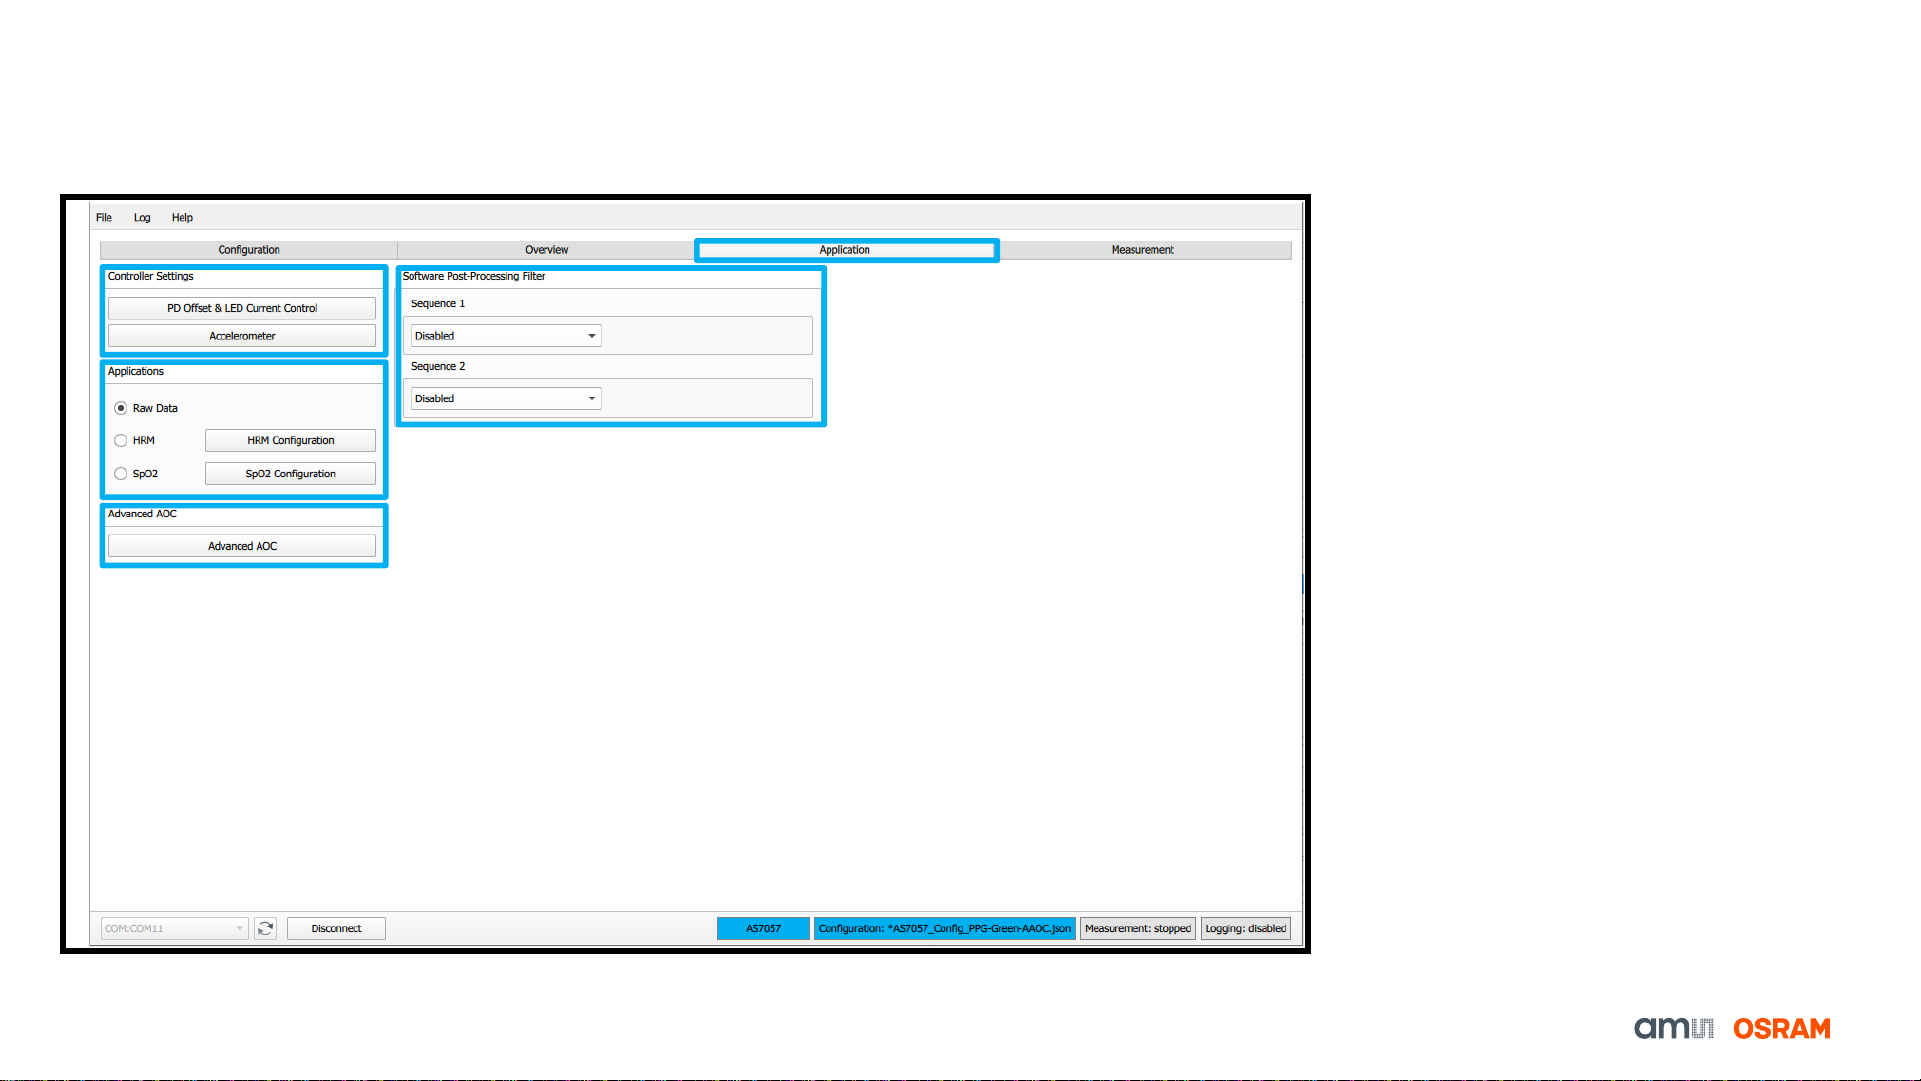
AS7056/57 PC Software
Overview of GUI –Application Tab 1. Software and vital signs application
related parameters can be found under
the 'Application' tab. Click the
“Application” tab to operate the “PD
Offset & LED Current Control”,
“Application” and “Software Post-
Processing Filter” sections.
2. In the Controller settings, there is AGC
Configuration that controls the PD-offset
and LED current and algorithms like
HRM and SpO2. The parameters
related to HRM & SpO2 applications
can be individually reviewed and
adjusted on this tab by enabling or
disabling the Accelerometer along with
the different frequency.
3. Various applications such as Raw Data,
HRM or SpO2 can be activated.
4. Different SW post-processing filters
have been implemented to improve the
quality of the output signal. The plot
area displays the post-processing filter.
5. Advanced Automatic Offset Control
(AAOC)
Fig. 9: Overview of SW GUI –Application Tab
1
2
3
4
5
This manual suits for next models
1
Table of contents
Other Osram Motherboard manuals


