ProfiTap PROFISHARK 1G User manual

1

2
Package contents
•1 x ProfiShark 1G or 1G+ main unit
•1 x USB key containing drivers,
software and manual
•1 x USB 3.0 cable
•1 x RJ45 cable
•1 x GPS/GLONASS Antenna (1G+ only)
•1 x Carrying pouch
For any questions, technical or otherwise,
contact our customer support
through our website:
or by email:
For the latest documentation and software,
visit our Resource Center:

3
Table of contents
4 General Information
5 Network TAP
6 ProfiShark 1G Visual Description
7 ProfiShark 1G+ Visual Description
8 Driver Installation
8 Analyzer Installation
9 ProfiShark 1G Manager:
9-Installation
9-Description
9-Statistics
9-Counters
11 -Charts
12 -Log
12 -Network Ports Diagnostic
14 -Features
16 Packet Capture:
19 -Live Capture Mode
20 -Direct Capture Mode
21 -Direct Capture Setup
22 -Timestamping
23 -Advanced Timestamping
26 Additional Information

4
General Information
ProfiShark 1G is a handheld plug and play device dedicated to
in-line Gigabit Ethernet monitoring. It facilitates field traffic
capture and troubleshooting. It is equivalent to a 10/100/1G
aggregator tap and two 1 Gbps NICs. All-in-one in a pocket-
sized box, the only additional hardware required being a laptop
or desktop PC with a free USB 3.0 port.
As it is based on USB 3.0 (5 Gbps), the ProfiShark 1G manages
full-duplex gigabit at wirespeed, without the bottleneck of an
aggregator tap. It also surpasses all standard NICs in capture
mode, as it catches any tag and encapsulation without altering
the frames.
ProfiShark 1G is the perfect tool for the field engineer as well
as for long-term traffic collection.
Features
- 10/100/1G monitoring on USB 3.0
- USB 3.0 powered, no adapter required
- Fail-safe monitoring
- Low delay, low jitter
- Hardware aggregation
- 8 ns hardware timestamping for accurate latency testing
- Real time statistics
- Low level error and bandwidth monitoring
- CRC error capture
- Capture any packet with any analyzer
- Direct capture to disk
- Dual NIC mode (SPAN)
- Very low CPU usage
- Invisible to the network

5
Network TAP
The ProfiShark 1G integrated network TAP provides safe
access to the network for monitoring purposes. It is a passive
monitoring device, in the sense that it is undetectable, the
original traffic staying unaltered and no extra packets being
inserted. As most of the TAP’s functions are performed by
dedicated hardware circuits, it is much more reliable and error
proof than SPAN ports.
In a gigabit network, the TAP has to negotiate with both
attached devices for the highest common speed. If no common
speed can be found, or if one of the devices is disconnected,
the TAP propagates the error to the other attached device,
allowing a redundant path to be activated.
In case of power failure, it activates its bypass circuits,
connecting the two attached devices directly. The ProfiShark
1G integrates a high performance fast failover circuit and
a proprietary algorithm, reducing the unavailability of the
network path down to 30ms.
NOTE The fast failover relies on the network setup. In case
the fast failover cannot perform, the two end devices have to
renegotiate the link. This operation takes about 2 seconds.
NOTE The user should verify that the two end devices connect
together with either a single cable, an RJ45 coupler, or the
unpowered TAP. The straight or crossover cables must be
employed in case of end devices that do not support Auto MDI/
MDIX operation (i.e. Auto Crossover). Experienced users can
bypass this procedure.
NOTE Although some vendors recommend the use of the
non-IEEE compliant “Forced Gigabit” mode, we strongly
recommend activating auto-negotiation when Gigabit speed is
required. More generally, auto-negotiation should always be
enabled on both end devices in order to avoid duplex mismatch
issues.

6
ProfiShark 1G Visual Description
1- Port A (RJ45) connected to the network
2- Port B (RJ45) connected to the network
3- Power indicator LED
4- USB 3.0 connector linked to your monitoring device
(i.e. a laptop computer)
5- Optional DC input (5V/1A)
6 - 7 - 8 - 9- The ProfiShark’s state is displayed on the front
LEDs. LEDs functions are named on top of the ProfiShark.
TAP functions:
Steady LED 10 (7): TAP is operating at 10 Mbit/s
Steady LED 100 (8): TAP is operating at 100 Mbit/s
Steady LED 10 (7) + LED 100 (8): TAP is operating at 1000 Mbit/s
Steady Link/Activity (6)(9): the port is linked up
Blinking Link/Activity (6)(9): the port is linked up and has RX/TX
activity
Blinking LED 10 (7) + LED 100 (8): TAP not connected or trying
to connect
Alternating LED 10 (7) + LED 100 (8): TAP cannot find a common
speed between network A and network B
General functions:
Blinking LED 10 (7): The ProfiShark is initializing
Blinking LED 100 (8): The ProfiShark HW firmware is corrupted
2
1
4
3
5
6 7 8 9

7
2
1
4
5
3
76
8
9 10 11 12
ProfiShark 1G+ Visual Description
1- Port A (RJ45) connected to the network
2- Port B (RJ45) connected to the network
3- PPS input (SMA Female)
4- GNSS (GPS/GLONASS) antenna input (SMA Female)
5- Sync LED
6- Power indicator LED
7- Optional DC input (5V/1A)
8- USB 3.0 connector linked to your monitoring device
(i.e. a laptop computer)
9 - 10 - 11 - 12 - The ProfiShark’s state is displayed on the front
LEDs. LEDs functions are named on top of the ProfiShark.
TAP functions:
Steady LED 10 (10): TAP is operating at 10 Mbit/s
Steady LED 100 (11): TAP is operating at 100 Mbit/s
Steady LED 10 (10) + LED 100 (11): TAP is operating at 1000 Mbit/s
Steady Link/Activity (9)(12): the port is linked up
Blinking Link/Activity (9)(12): the port is linked up and has RX/TX
activity
Blinking LED 10 (10) + LED 100 (11): TAP not connected or trying
to connect
Alternating LED 10 (10) + LED 100 (11): TAP cannot find a
common speed between network A and network B
Steady Sync LED (5): the internal timestamping is synchronized
with the UTC time with a ± 16ns precision
General functions:
Blinking LED 10 (10): The ProfiShark is initializing
Blinking LED 100 (11): The ProfiShark HW firmware is corrupted

8
Driver Installation
Drivers are available for Windows 7 32/64 bits, Windows 8
32/64 bits, and Linux.
ProfiShark 1G Windows drivers are included in the ProfiShark
1G Manager. Please refer to the ProfiShark 1G Manager
Installation section of this manual.
After having installed the ProfiShark 1G Manager, connect the
ProfiShark 1G on a free USB 3.0 port and the drivers should
install automatically. For a manual installation, the drivers can
be found in the default installation folder:
“C:\Program Files (x86)\Profitap\ProfiShark 1G\Driver\PT3”.
When the ProfiShark hardware is connected for the first time,
a reboot of the PC is required in order to refresh the Winpcap/
Wireshark device list. The Winpcap/Wireshark device list may
also be refreshed using the following command lines in a
cmd.exe window:
- open a CMD window
- net stop npf
- net start npf
To install the ProfiShark 1G drivers on Linux, follow the
instructions in the Installation.txt file located on the USB flash
drive.
The latest driver releases can be found in the Resource Center
at www.profitap.com. You will need to register to access this
area. Registering is free and will let you participate in ongoing
product improvements.
Analyzer Installation
Any of the compatible analyzers can be used to perform the
analysis. Compatible analyzers are listed on the ProfiShark 1G
product page at: www.profitap.com.
Wireshark is recommended and can be downloaded at:
www.wireshark.org.
To start capturing network data, launch your preferred
network analyzer and select the new network interface named
“ProfiShark 1G Device”. Refer to your analyzer’s user manual
to learn more about how to select a network interface.

9
ProfiShark 1G Manager
Installation
To install the ProfiShark 1G Manager on Windows, execute the
setup utility located in the “Windows” folder of the USB flash
drive. Please make sure any previous version of the ProfiShark
1G Manager has been uninstalled before starting the setup
utility. The setup utility will create a launch icon in your start
menu.
To install the ProfiShark 1G Manager on Linux, follow the
instructions in the Installation.txt file located on the USB flash
drive.
The latest software releases can be found in the Resource
Center at www.profitap.com.
Description
ProfiShark 1G Manager is a standalone application designed
by Profitap. It provides means for statistical analysis of a
network prior to a deeper investigation using an analyzer.
It also provides options for port diagnostic, port control,
timestamping, and traffic capture. It also includes a
firmware flashing utility. ProfiShark 1G Manager can be used
simultaneously with a software network analyzer, without the
need to interrupt data capture.
Statistics
ProfiShark 1G Manager provides several different visual
representations for network statistics.
Counters
The Counters tab lists every counter embedded in the
ProfiShark 1G for both network ports. The counters are 64-bit
hardware counters. They are cleared at hardware startup and
at link reconnection.
Statistics can be reset individually for each port or for the two
ports at the same time using the buttons on the left.
Clearing the counters using the buttons does not clear the
hardware counters, but stores all counters in reference
counter. The displayed counters are the result of the formula
(hardware counter - reference counter).

10
Size < 64 bytes:
CRC valid frames with a size inferior to 64 bytes
64 < size < 1518:
CRC valid frames with a size superior or equal to 64 bytes and
inferior or equal to 1518 bytes
Size > 1518 bytes:
CRC valid frames with a size superior to 1518 bytes
Collisions:
CRC error frames with a size inferior to 64 bytes
CRC errors:
CRC error frames with a size superior or equal to 64 bytes and
inferior or equal to 1518 bytes
Jabbers:
CRC errors frames with a size superior to 1518 bytes
Valid frames:
CRC valid frames of any size
Invalid frames:
CRC error frames of any size
Total bytes:
Valid frame bytes
Meters:
The meters on the right display the current bandwidth usage,
the average bandwidth usage and the average CRC error rate
for each port.

11
Charts
The Charts tab allows the inspection of statistical data over
time, using plots.
For each port, you can plot any of the statistical data by using
the checkboxes on the left. Once a box is checked,
the corresponding data appears on the chart on the right.
Refresh rate can be selected using the drop down list on the
left, allowing you to plot up to 10 hours of statistics.
When “packet/s” is selected, each series displays the
corresponding number of packets per second, except for the
bandwidth usage which is displayed in bytes per second.
When “percentage” is selected, each series is displayed in
term of percentage of the total number of packets, except for
the bandwidth usage which is displayed in percentage of the
total bandwidth.
Both graphs’ history can be reset using the Clear History button
on the left. Disconnecting the ProfiShark 1G also reset the
graphs’ data.
12
Log
The Log tab offers to set thresholds for bandwidth usage and
CRC error rate. Every time the threshold is exceeded, a log
entry is added, allowing to easily identify the type, date, and
port of the event.
This can be used for long term analysis, where events happen
randomly over a long period of time.
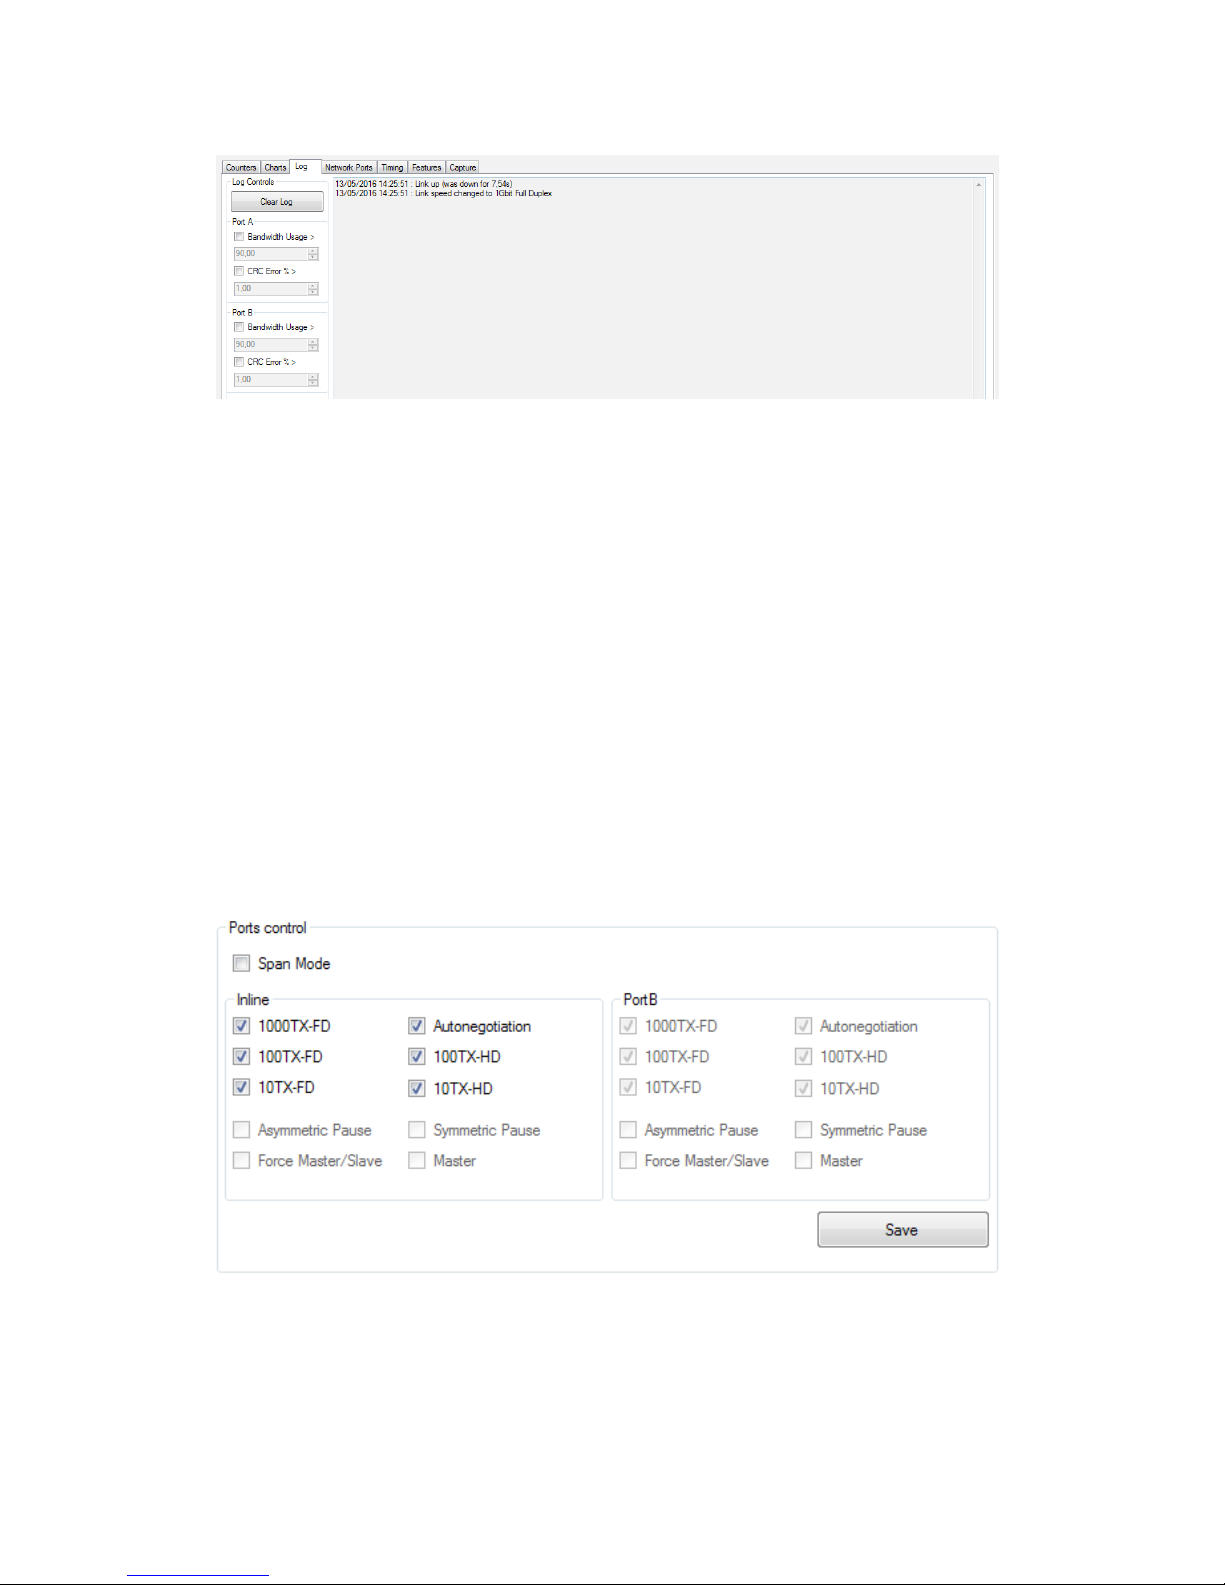
Network Ports Diagnostic
Ports Control
Customizable port settings are located on the right side of this
tab:
The ProfiShark 1G is set to in-line mode by default. Span mode
can be enabled or disabled in this section.
In in-line mode, both ports are controlled at the same time. In
Span mode, both ports can be configured separately (speed,
Full-Duplex/Half-Duplex, enable/disable autonegotiation).

13
Network Port Status
On the left side of this tab is a chart giving in-depth information
on the network link:
- Link status and speed
- Master/slave resolution
- Link partner capabilities
- Faults
14
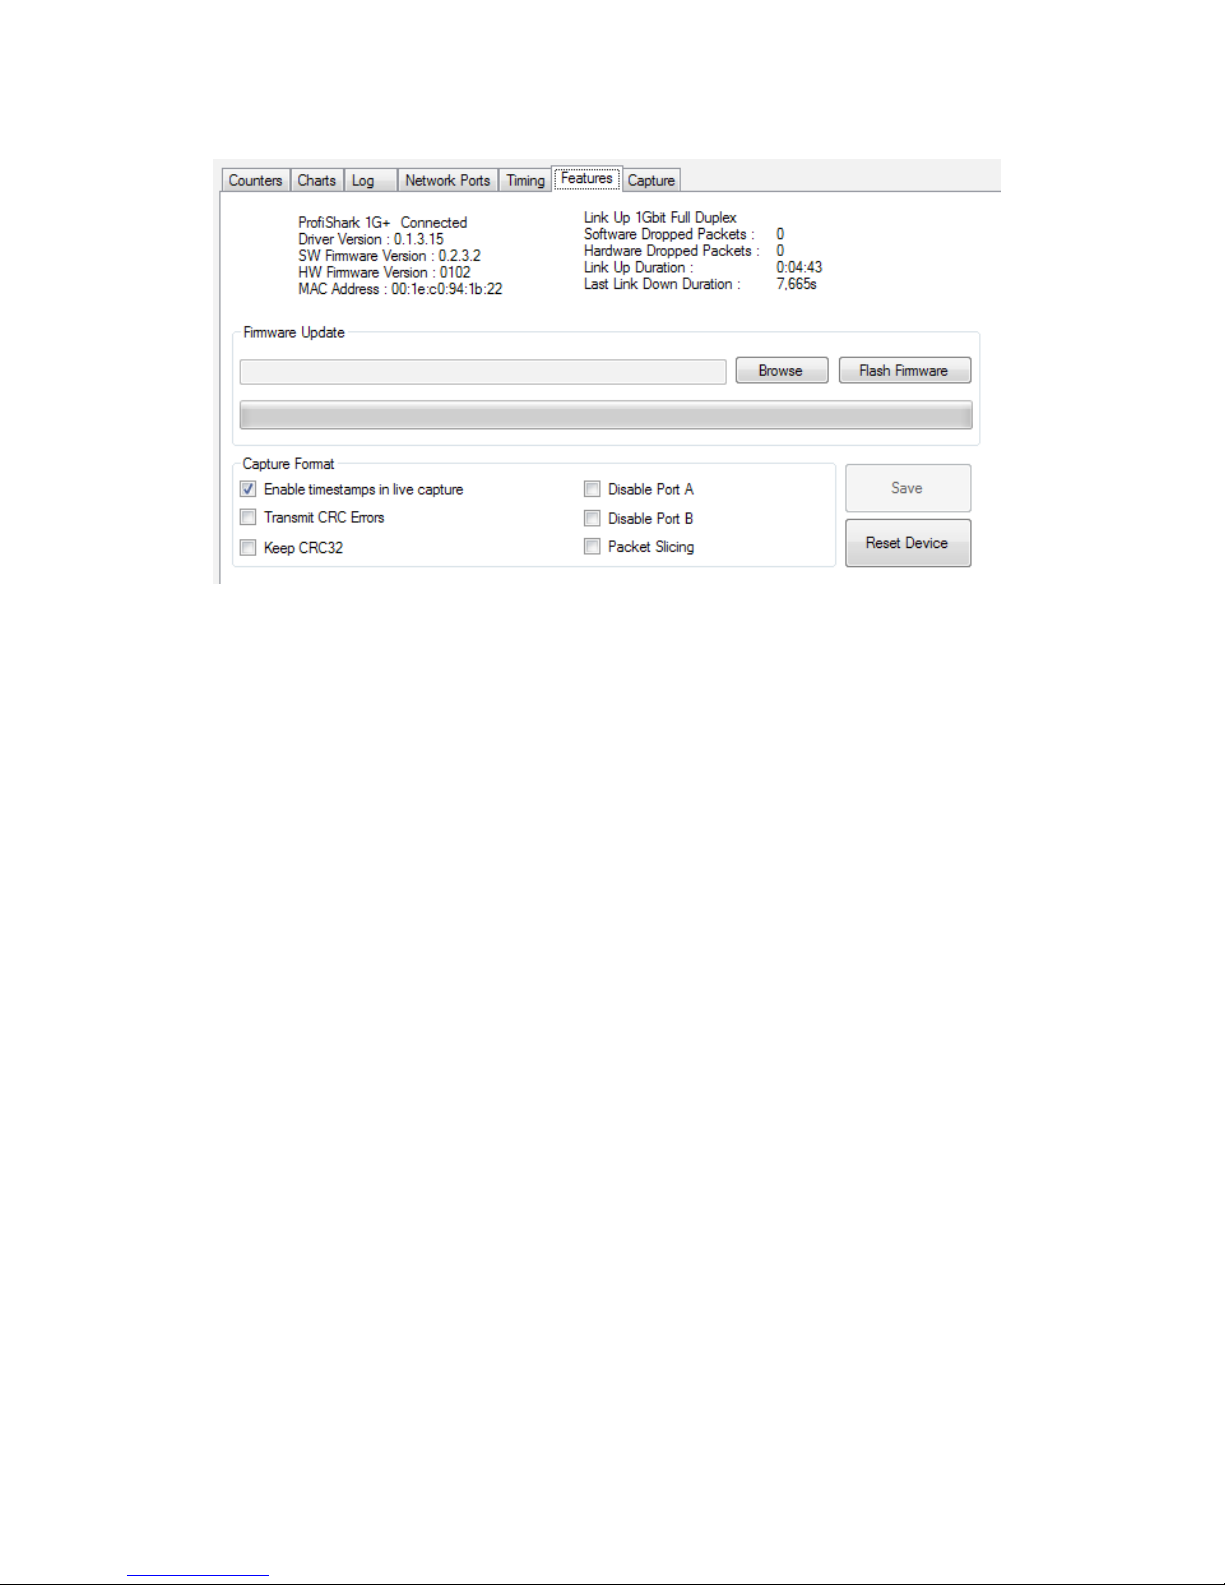
Features
The Features tab regroups information about the driver and
firmware version, port status, the firmware update utility, and a
way to enable or disable certain ProfiShark 1G features.
To update the ProfiShark 1G firmware, press the Browse
button, select the appropriate firmware file and press the Flash
Firmware button.
The corresponding firmware update will begin. The ProfiShark
1G Manager cannot be used while the update is in progress.
The update process can take a few minutes to complete.
Unplug and replug the ProfiShark device to use the new
firmware. Do not disconnect the USB port or shut your
computer down during the update process.
The latest firmware can be downloaded from the Resource
Center at: www.profitap.com.

15
The following features can be turned on and off:
Transmit CRC Errors:
If checked, the ProfiShark will not filter out network packets
with CRC errors like a normal NIC would.
Keep CRC32:
Keep the CRC32 information (32-bit Frame Check Sequence)
located at the end of the packets. FCS can be interpreted in
Wireshark (Edit -> Preferences -> Protocols -> Ethernet ->
Assume packets have FCS).
Disable Port A:
If checked, the frames which input on port A are not captured.
Disable Port B:
If checked, the frames which input on port B are not captured.
Packet Slicing:
If checked, the first 128 bytes of each frame are captured.
Enable timestamps:
If checked, a Unix formatted timestamp is adjoined at the
end of the packet data, after the FCS. This timestamp can be
interpreted by the Profitap Wireshark dissector in live capture
mode.
Unix timestamp format: the 64-bit timestamp is organized in two
32-bit words, representing the seconds since 01/01/1970, and the
fraction of second.
NOTE If the “Packet Slicing” feature is enabled, the hardware
automatically disables the “Keep CRC32” feature. No padding
is added to frames smaller than 128 bytes.
NOTE If both options “Transmit CRC Errors” and “Keep
CRC32” are enabled, all erroneous packets will be treated as
correct ones.

16
Packet Capture
ProfiShark 1G has the ability to capture:
- Any type of frames (VLAN, VXLAN, MPLS, Pause frames, etc.)
- Any encapsulated frames
- CRC errors frames
- Short frames (< 64 bytes)
- Jumbo frames (> 1518 bytes)
- Any frames between 10 bytes and 10 Kbytes
Once the drivers have been properly installed, a new
connection is added in the Network Connection panel.
ProfiShark 1G acts as two 1 Gbit/s unidirectional NICs,
regardless of the network connection speed. Frame
aggregation is done in the ProfiShark hardware and respects
the original frame order. As opposed to FIFO (First In, First
Out), the ProfiShark 1G employs an FCFS (First Come, First
Served) mechanism.

17

18
Two modes of capture are available:
- NIC Capture mode
- Direct Capture mode.
In NIC Capture mode (live capture), the capture is performed
like on any other network card. The frames are routed to the
NDIS driver.
In Direct Capture mode, the frame stream is dumped to the
disk. The capture file format is computed in the ProfiShark
hardware.
Protocol Analyzer
(e.g. Wireshark)
ProfiShark Hardware, 8ns Timestamp
Direct Capture Format Computation
ProfiShark NIC
Capture Driver
ProfiShark Direct
Capture Driver
Network Driver
(NDIS)
Capture Driver
(e.g. Winpcap)
HDD/SSD

19
Live Capture Mode
ProfiShark 1G transmits network frames to the capture
software without altering them. It is transparent for packet
size, packet type, or protocols. All tags and encapsulation are
preserved (e.g. VLAN, MPLS, GRE).
The “Software Dropped Packets” counter in the Features tab
indicates the number of packets dropped by the driver in Live
Capture mode. It is not representative of the packets dropped
in Direct Capture (see “Direct Capture Mode” chapter). These
drop events are caused by high CPU usage.
The “Hardware Dropped Packets” counter indicates the
amount of captured packets that were dropped due to low USB
bandwidth (e.g. Gigabit capture on USB 2.0). In USB 3.0 mode,
this counter should not increase, even in full speed gigabit
capture.
NOTE Capture of small packet at full speed gigabit is
extremely challenging for processors and can cause software
drops. For that reason, another capture mode is available (see
“Direct Capture Mode” chapter).

20
Direct Capture Mode
ProfiShark 1G provides with the option to capture traffic
without the need for third-party capture software. This mode
of capture is performed on a driver level, prior to all network
stacks and frame processing. With the support of direct
capture, small packet capture can be performed at wire speed.
The capture file is saved in PCAP Next Generation format
(.pcapng).
The packet timestamps are hardware generated with 8
nanosecond accuracy. The direct capture feature is compatible
with the different hardware features: “Packet Slicing”,
“Transmit CRC errors”, “Keep CRC32”, “Disable Port” (see
“Features” chapter).
Other manuals for PROFISHARK 1G
1
This manual suits for next models
1
Table of contents
Popular Adapter manuals by other brands


Jabra
Jabra LINK 14201-20 - DATASHEET FOR TOSHIBA PHONES quick start guide

OUNEVA
OUNEVA VG03-0029 installation guide

ABB
ABB FBIP-21 BACnet/IP Quick installation and start-up guide

Sybase
Sybase Adapter for SAP R/3 installation guide

Adaptec
Adaptec SlimSCSI APA-460 Hardware installation guide

Emerson
Emerson Smart Wireless THUM Adapter Reference manual