Seeburg SP2 User manual
SEEBURG acoustic line
active systempanel 2
owner´s manual

TABLE OF CONTENTS
1 INTRODUCTION 1
1.1 How to use this manual 2
2 THE CONTROLS AND CONNECTORS 2
3 OPERATING THE SP2 4
3.1 Active frequency dividing network 4
3.1.1 3 dB point 4
3.1.2 Filter falloff 4
3.1.3 Phase correction 4
3.1.4 Highmid attenuator 5
3.1.5 MONO-Bass option 6
3.2 Limiter operation 6
3.3 Subsonic and ultrasonic filters 7
3.4 Optional equalizer PC card 7
3.4.1 Adjustment of the EQ center frequencies 7
3.4.2 Adjustment of the filter Q 9
3.4.3 Filter gain 9
4 APPENDIX 10
4.1 Tables 10
4.2 Note - chart for SP2 configurations 12
4.3 Factory presets 13
4.4 SP2 specifications 14
4.5 EQ card specifications 14
4.6 Glossary 15
SEEBURG acoustic line SP2 Owner’s Manual Page 1
1 Introduction
Your new acoustic line SP2 is a very flexible device. Due to its wide range of adjustable
parameters it can also conveniently be used as an add-on for existing PA systems.
Read this owner’s manual carefully before putting your SP2 into operation, please!
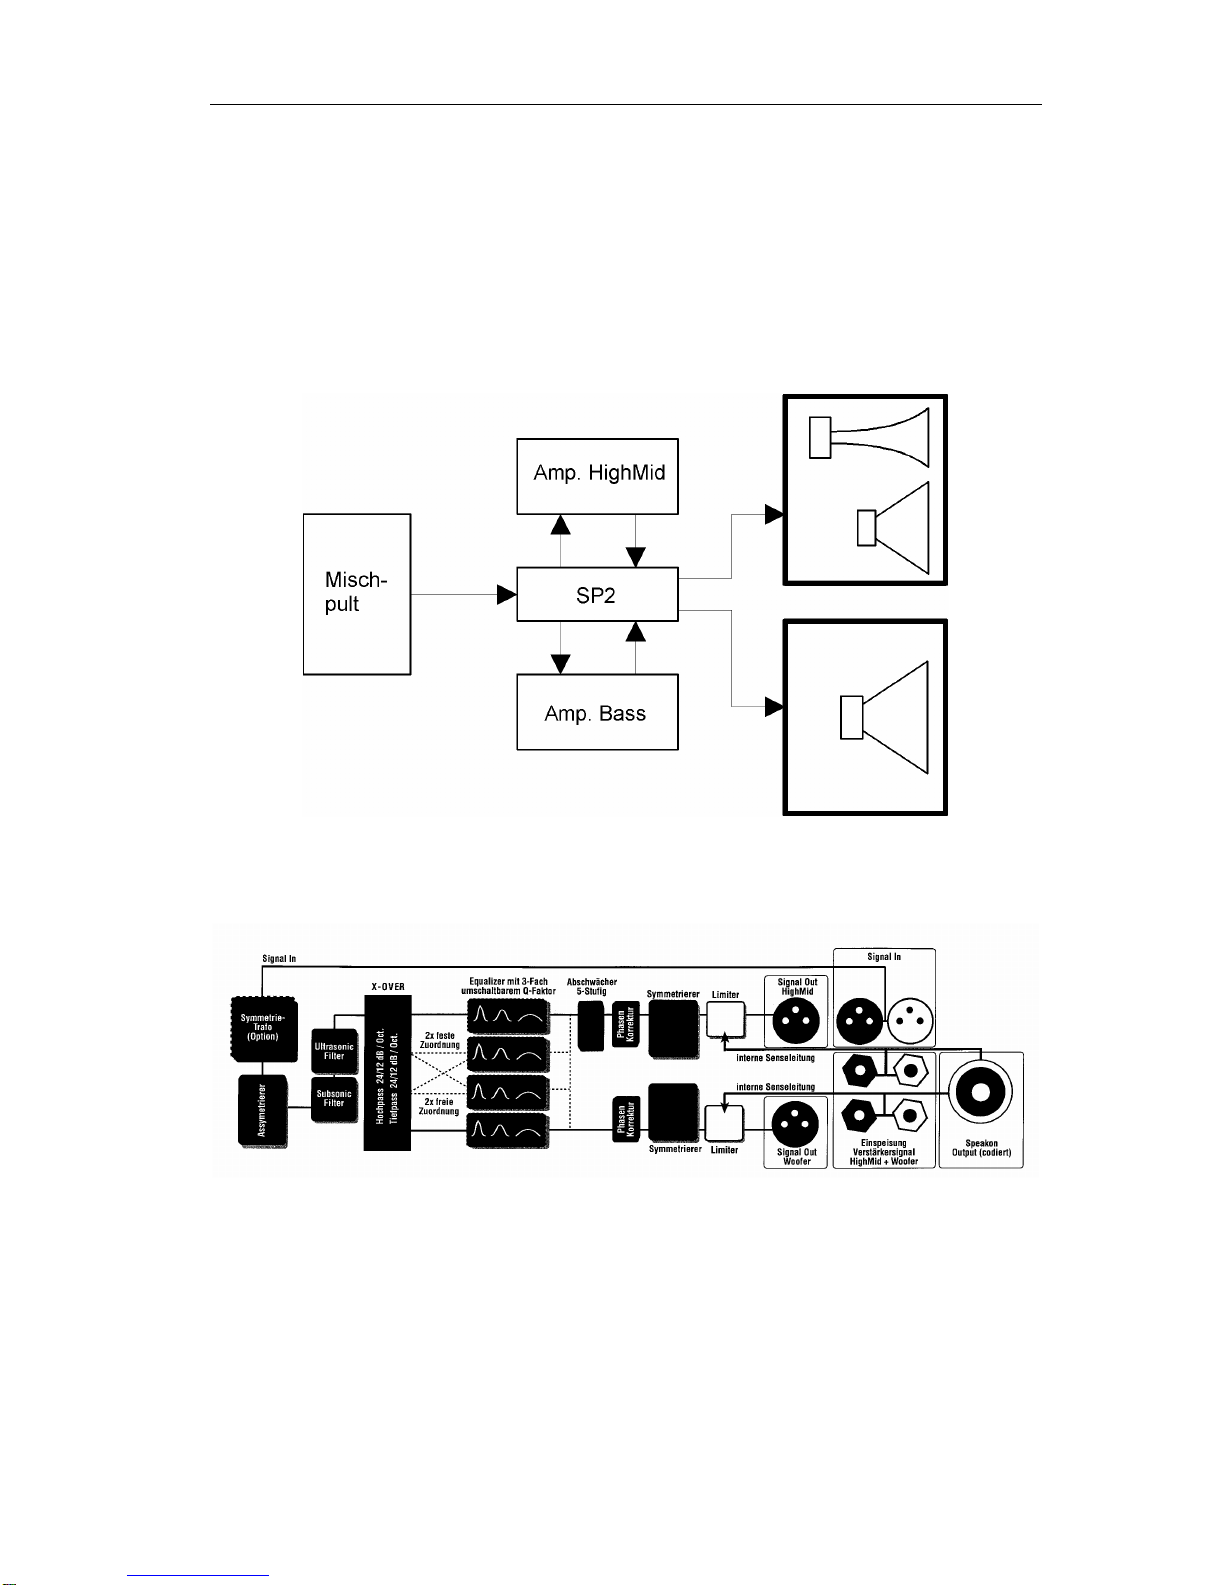
The SP2 system controller becomes the central device of your sound reinforcement system as
soon as the signal leaves the mixing console (see fig. 1). This one piece of audio gear incorporates
a 2-way frequency dividing network, a dynamics controller and a four band EQ (optional) - all in
stereo and fully configurable - as well as a connection panel and still takes up only one rack space.
Fig. 1 How the SP2 is hooked up (only one channel pictured).
A detailed illustration of the SP2’s functional blocks, which can be seen in the following figure (fig.
2).
Fig. 2 Block diagram of the SP2
If you bought the SP2 together with or as an upgrade for an acoustic line PA system it is already
set up for optimum performance with this specific system. For use with all other brand names there
is a modifiable standard configuration which is described in appendix 4.3.
In order to change the SP2’s parameters it is necessary to open the device and exchange one or
more SIP resistor arrays and/or change some jumper positions. If you are not sure how to perform
these tasks properly, please talk to your SEEBURG acoustic line dealer first.

Caution: Before opening the device must be turned off and the power line must be
disconnected! The manufacturer will accept no responsibility whatsoever for any damage
caused by improper handling of this device.
1.1 How to use this manual
This owners manual is written to assist you in setting the SP2 up in a way that lets you get the most
out of it. To this end we think it is useful to give a concise description of the SP2’s general mode of
operation. However, we are not trying to write a textbook on audio engineering where everything
can be covered in detail. Therefore some of the terminology used in the text is listed in a glossary
found in the appendix. If you should still encounter any trouble in finding a setup to suit your needs,
please talk to your dealer.
2 The controls and connectors
On the front panel (see fig. 3) you find the following connectors and indicators:
•audio in channels A and B: The SP2’s input channels A and B, which are connected to a
mixer’s stereo outputs.
•link to next panel channels A and B: Feed-through of the input signals, which is provided for
connecting another SP2 or a power amp.
•Power on-LED: Indicator lights up when ac power is present.
•Signal A/B-LED: Indicators light up when the input signal level rises above -20dB.
•Limit-LEDs Woofer/HighMid: Indicators show when the limiter is in operation.
•output to speakers: Speakon jacks to connect the speaker system.The highmid signal is
present on pins 1+/-, the bass signal on pins 2+/-.
The back panel’s connectors (see fig.4) are as follows
•Signal to Amp jacks for HighMid A/B and Woofer A/B: Jacks to connect your power amp
inputs. These outputs deliver the wet SP2 signal.
•Power Connection from Amp: Binding post pairs which are connected to the power amp
outputs. Caution: Never connect or disconnect any power amp output while the power
amp is in operation! Always turn off the power amp first!

SEEBURG acoustic line SP2 Owner’s Manual Page 3
Fig. 3 Front panel facilities
Fig. 4 Rear panel facilities

All SP2 inputs and outputs are electronically balanced. A balancing transformer can be installed as
an option if DC isolation is a requirement. If you wish to have this modification installed in your SP2
please contact your authorized SEEBURG acoustic line dealer.
3 Operating the SP2
3.1 Active frequency dividing network
An active frequency dividing network is placed in between a mixing console and a power amp. It
serves to divide the source signal into several frequency ranges. These signals are sent to
seperate power amps with their respective woofers, midrange drivers and tweeters connected. The
SP2 incorporates a 2-way network with the ability to adjust its crossover frequency via
exchangeable SIP-resistor-arrays. The highpass filter for the woofer frequency range and the
lowpass filter for the high-mid range both show a Linkwitz-Riley frequency and phase response.
The following parameters can be adjusted:
3.1.1 3 dB point
The characteristic breakpoint of the high- and lowpass filters’ frequency response can be adjusted
by insertion of a SIP-resistor-array. Choosing different 3dB-points for the two filters results in a
varying amount of overlap of the complementary frequency response curves. Please choose your
SIP values according to table 1 in the appendix.
3.1.2 Filter falloff
In addition to the filters’ 3dB points you can also adjust the steepness of the filter falloff in their
respective passband-to-stopband-transition ranges. It can be chosen separately for each filter to
yield either 12dB/octave or 24 dB/octave. The adjustment is performed by moving the blue jumpers
on the PC board. In the highmid range you can also set this jumper to 0 dB/octave, effectively
putting this filter out of operation.
Fig. 5 Measured frequency responses of the SP2 frequency dividing network.
3.1.3 Phase correction
To compensate for phase differences between the frequency divided signals, the SP2 gives the
opportunity to set the woofer phase angle to 0°, 60 °or 120°via the light green jumper. Together
with the highmid phase angle, which can be set to 0°or 180°, it is possible to adjust the relative
phase in 60°steps over a full 360°range.
This phase correction may be necessary in order to compensate for speaker arrangements which
show a horizontal displacement of the loudspeakers’ acoustical centers (see fig. 6). The geometric
difference in the acoustical signal path translates into a phase difference of frequencies which are
transmitted by both speakers, leading to severe frequency response distortions in the crossover
frequency range 1
1see glossary in the appendix
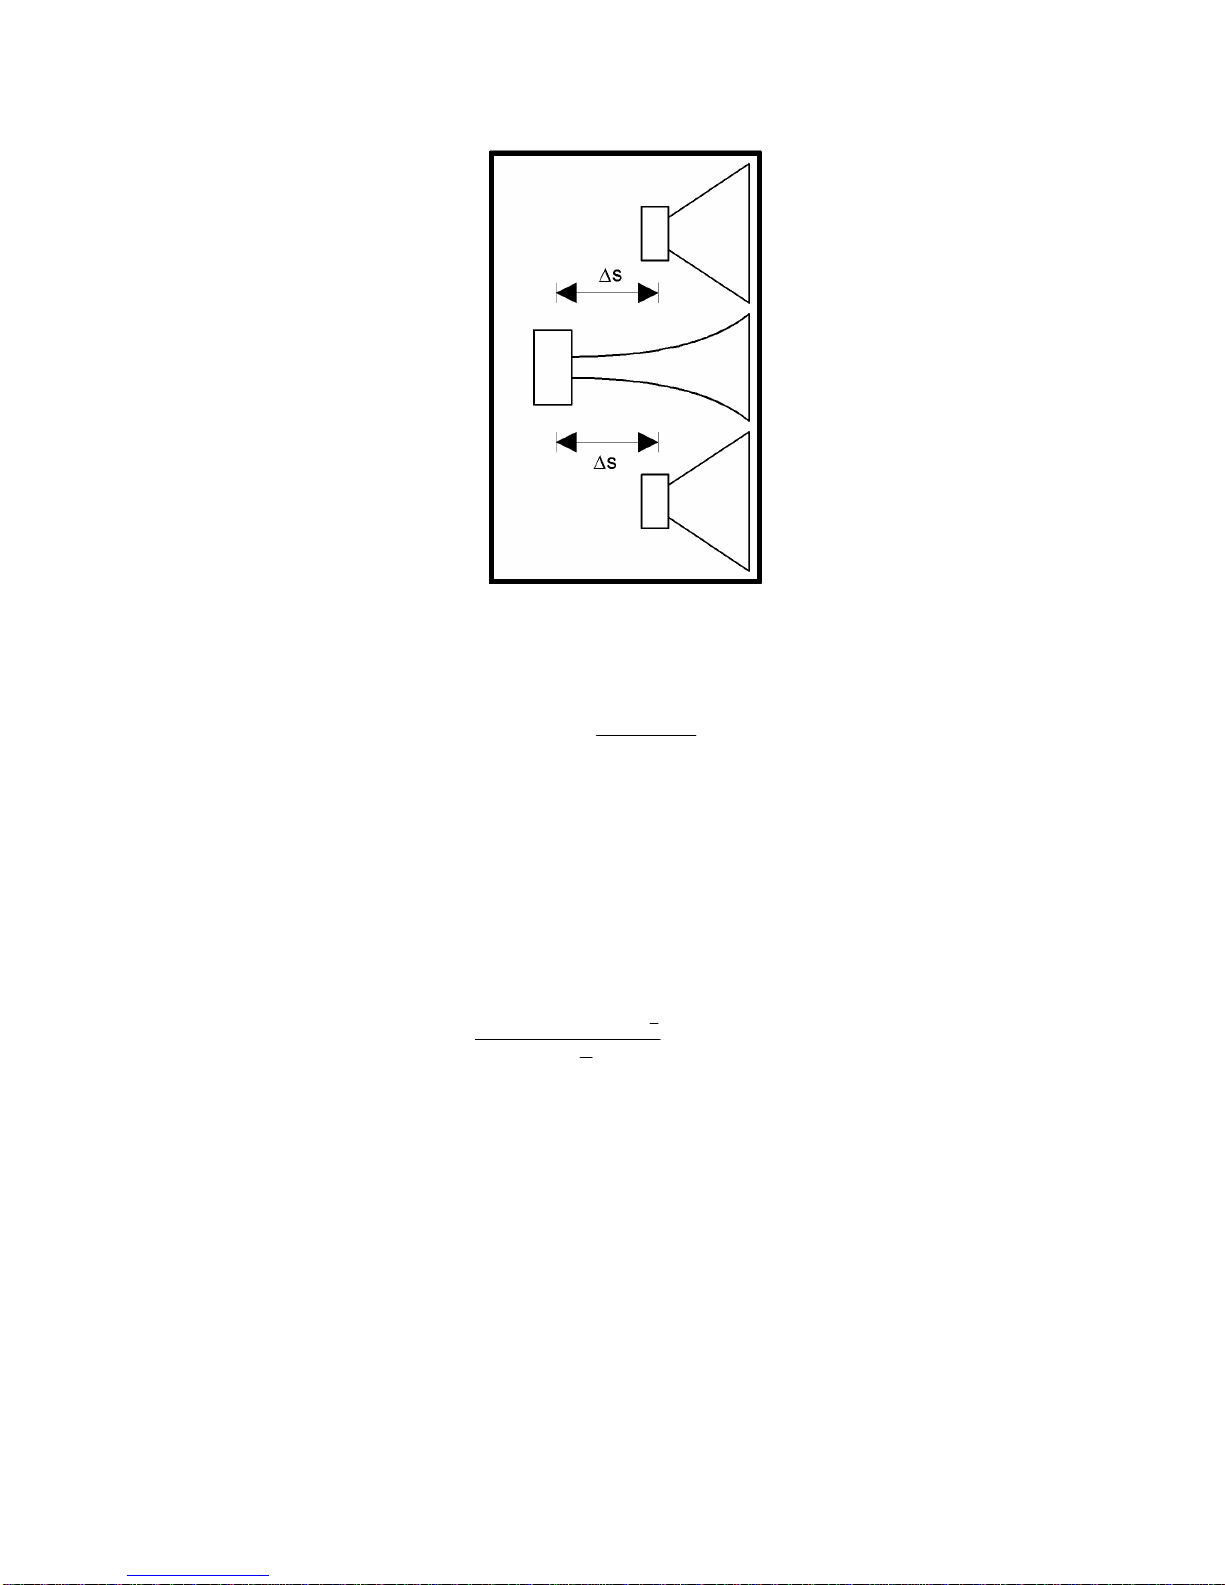
Fig. 6 Displaced Speakers
The phase correction angle (Φin degrees) for a known speaker displacement is given by
Φ
∆
=
⋅
°⋅
s f
c
360
∆s: Speaker offset in m
c: Speed of sound in air. (Given an air pressure of 101.3 hPa and a temperature
of 20°Celsius c is 340 m/s. The temperature coeff icient is 0.6 (m/s)/°C).
Example: You want to control a monitor with two 12’’speakers and a 2’’driver with the SP2. The 2’’
driver’s acoustical center is 0.115m behind the 12’’speaker’s acoustical center. The crossover
frequency is 1500 Hz. The necessary phase correction then amounts to
Φ = ⋅ °⋅ = °≈ °
0115 360 1500
340 182 180
1
,,64
ms
m
s
3.1.4 Highmid attenuator
The attenuator function makes it possible to reduce the highmid gain relative to the woofer gain in
steps of 2.5 dB. This feature comes in handy if your bass speakers are less efficient than your
highmid system. The adjustment is performed by moving the red jumper to the respective position.
The attenuation is printed on the PC board (see fig. 7). The first position on the socket corresponds
to 0 dB.

Fig. 7 Highmid attenuation jumper socket.
3.1.5 MONO-Bass option
If you intend to use a system with a single bass speaker cabinet, use the SP2’s MONO-Bass
function. To this end you have to latch the two blue wire breakers which are labeled ‘Mono-Bass’.
The effect is an identical bass signal at the woofer output connectors.
3.2 Limiter operation
The SP2 incorporates 4 independent limiters ( HighMid CH. A and CH. B, Bass CH. A and CH. B).
For each of these you can preset one of 3 different attack/release time constants as well as the
maximum allowable speaker output power.
For proper limiter operation it is mandatory to connect the speakers to the ‘output to speaker’-
speakon connectors, and not directly to the power amp outputs. Those must be connected to the
‘power connection from amp’-inputs. By passing the power amp signal through the unit it is
possible to detect the actual power delivered to the speakers. This power detection is
indispensable for proper limiter operation (see also fig. 1).
The time constants are set by placement of the blue jumpers in the limiter section. The jumper
sockets are labeled A, B and C corresponding to fast, medium and slow attack/release times. The
actual time constants are different for the two signal paths:
Bass: A = 20ms, B = 100ms, C = 200ms
HighMid: A = 10ms, B = 40 ms, C = 100ms
The maximum allowable power is adjusted via the four 5-switch DIP-arrays. Table 2 in the
appendix shows the power amp thresholds for various speaker cabinet impedances. Limiter
operation is visible on the front panel by two red LEDs. The limiting characteristic of the SP2 is
shown in fig. 8: the diagram shows a dynamic characteristic curve where the signal is not abruptly
limited above a certain threshold, but rather compressed with a compression ratio2that increases
with increasing power.
2see glossary in the appendix
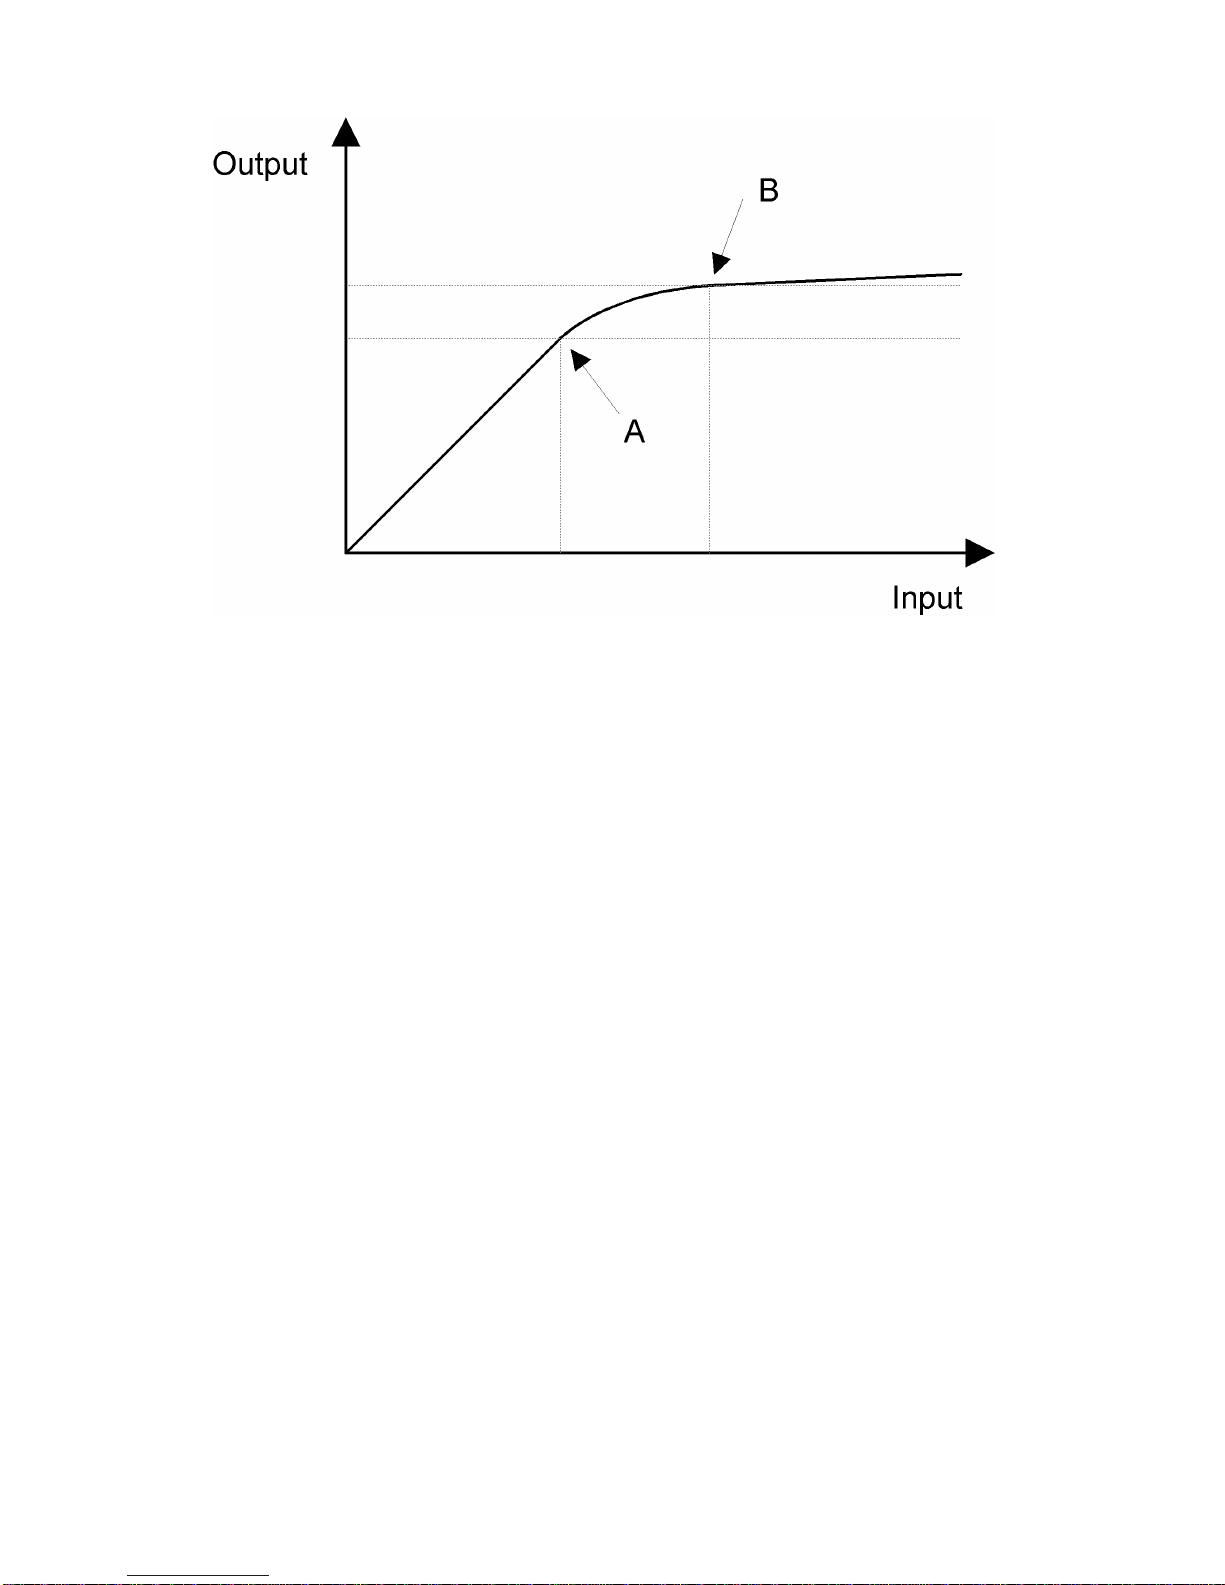
Fig. 8 Characteristic curve of the SP2 limiter. The limit indicator LED lights up at point A. The compression
ratio increases with an increasing input signal (area between A and B). The maximum compression ratio of
1:20 is reached beyond B.
3.3 Subsonic and ultrasonic filters
The subsonic filter is a highpass filter with a falloff of 18 dB/oct. The ultrasonic filter shows the
same steepness with a lowpass characteristic. The 3 dB points are at 25 Hz and 18 kHz,
respectively. The filters are used to block frequencies below and beyond the normal hearing range.
They are always in operation and cannot be turned off.
3.4 Optional equalizer PC card
If you choose to purchase a SP2 without the 2x4 band equalizer card, you still have the option to
install one as an upgrade. With this card it is possible to equalize your system’s frequency
response at adjustable center frequencies with a free choice of the signal path (woofer or highmid)
where you want to attach each EQ band to. The only limitation here is a maximum of 3 (out of 4
available) EQ bands per signal path. The insert points for the individual filter sections are labeled
‘EQ-Insert’ on the PC-motherboard. Unused insert points must be short circuited with a jumper.
(These yellow jumpers are placed in ‘park sockets’, which can be found right next to the EQ insert
connectors.)
3.4.1 Adjustment of the EQ center frequencies
The available EQ bands are divided into several frequency ranges (see fig. 9 through 12). Out of
these ranges the exact center frequencies are chosen by installing SIP resistor arrays. The resistor
values and the corresponding center frequencies are listed in table 1 in the appendix for the E12
resistor series, which has been expanded by a 20 kΩvalue from the E24 series. The SIP insert
connectors are labeled ‘Frequency’ on the EQ card.

Fig. 9 Measured frequency response curves for EQ1
Fig. 10 Measured frequency response curves for EQ2
Fig. 11 Measured frequency response curves for EQ3
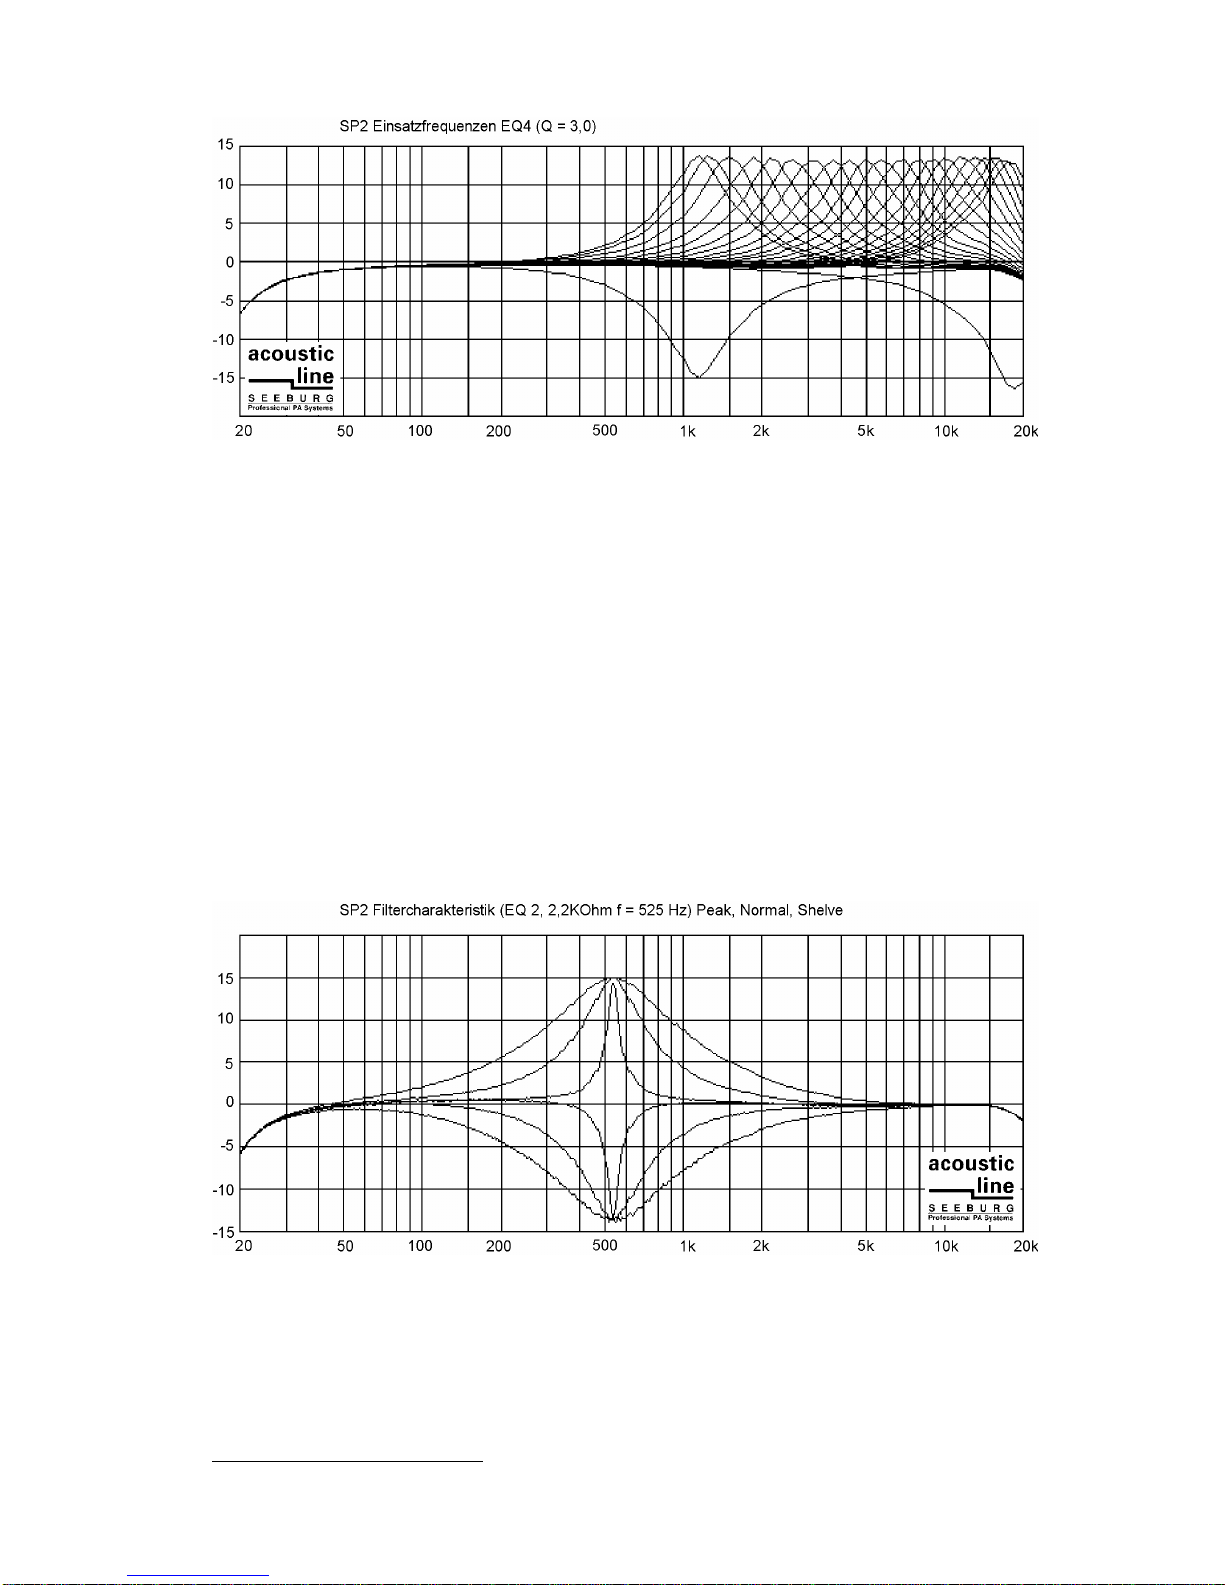
Fig. 12 Measured frequency response curves for EQ4
As can be seen in fig. 9 through fig. 12, there is a falloff of the zero amplitude curves below 50 Hz
and above 15 kHz. This is due to the subsonic/ultrasonic filters, which are always in operation (see
section 3.3).
3.4.2 Adjustment of the filter Q
The quality factor of the filters (filter Q3) can be set by positioning the yellow jumpers on the EQ PC
board. The corresponding connectors are labeled ‘Bandwidth’. There is a choice of three filter Qs:
•Peak (Q = 12): yellow jumper left
•Normal (Q = 3): yellow jumper center
•Shelve (Q = 1,5): yellow jumper right
The resulting characteristic curves are shown in fig. 13.
Fig. 13 Characteristic curves of the EQ filters with three different Q factors preset.
3.4.3 Filter gain
The filter gain for each EQ band is adjusted with the trimmers on the EQ card from -12 dB
(maximum attenuation) to +12dB (see fig. 9 through fig. 12).
3see glossary in the appendix

4 Appendix
4.1 Tables
SIP-resistor- Frequency
array X-Over EQ1 EQ2 EQ3 EQ4
470 2400 330 1250 7000 19000
560 2100 305 1100 6400 17500
680 1600 280 1000 6000 16000
820 1400 290 920 5700 15500
1K 1200 240 880 5000 13500
1,2K 1000 205 800 4250 11500
1,5K 800 185 700 3800 10500
1,8K 750 162 610 3200 9200
2,2K 530 140 525 2850 8000
2,7K 430 120 450 2500 6750
3,3K 370 105 400 2200 5850
3,9K 310 90 350 1800 5000
4,7K 260 76 300 1600 4250
5,6K 220 65 250 1400 3700
6,8K 170 55 210 1200 3100
8,2K 150 45 175 1000 2700
10K 130 38 150 825 2250
12K 105 32 125 700 1800
15K 85 28 100 565 1500
18K 70 25 85 460 1250
20K 65 20 75 430 1150
Table 1 SIP resistor values and the corresponding 3 dB points of the frequency dividing network and EQ
center frequencies.
Resistor values given in ohms (Ω).
Frequencies given in hertz (Hz).
The resistor values are usually coded with three numbers on the SIP housing. The two most
significant digits represent the resistor value. The third number determines the magnitude by
defining the number of zeroes that must be attached to number one and two.
Examples: 222: 2200 Ω= 2,2 kΩ
153: 15000 Ω= 15 kΩ

Configuration Threshold
S 1 S 2 S 3 S 4 S 5 U P 16 P 8 P 4 P 2
OFF OFF OFF OFF OFF 12 9 18 36 72
ON OFF OFF OFF OFF 15 14 28 56 113
OFF ON OFF OFF OFF 18 20 41 81 162
ON ON OFF OFF OFF 21 28 55 110 221
OFF OFF ON OFF OFF 24 36 72 144 288
ON OFF ON OFF OFF 28 49 98 196 392
OFF ON ON OFF OFF 32 64 128 256 512
ON ON ON OFF OFF 36 81 162 324 648
OFF OFF OFF ON OFF 40 100 200 400 800
ON OFF OFF ON OFF 44 121 242 484 968
ON ON OFF ON OFF 48 144 288 576 1152
OFF OFF ON ON OFF 52 169 338 676 1352
ON OFF ON ON OFF 56 196 392 784 1568
OFF ON ON ON OFF 60 225 450 900 1800
ON ON ON ON OFF 64 256 512 1024 2048
OFF OFF OFF OFF ON 68 289 578 1156 2312
ON OFF OFF OFF ON 72 324 648 1296 2592
OFF ON OFF OFF ON 76 361 722 1444 2888
ON ON OFF OFF ON 80 400 800 1600 3200
OFF OFF ON OFF ON 84 441 882 1764 3528
ON OFF ON OFF ON 88 484 968 1936 3872
OFF ON ON OFF ON 92 529 1058 2116 4232
ON ON ON OFF ON 96 576 1152 2304 4608
OFF OFF OFF ON ON 100 625 1250 2500 5000
ON OFF OFF ON ON 104 676 1352 2704 5408
OFF ON OFF ON ON 108 729 1458 2916 5832
ON ON OFF ON ON 112 784 1568 3136 6272
OFF OFF ON ON ON 116 841 1682 3364 6728
ON OFF ON ON ON 120 900 1800 3600 7200
OFF ON ON ON ON 124 961 1922 3844 7688
ON ON ON ON ON 128 1024 2048 4096 8192
Table 2 DIP-switch configuration for adjusting the limiter threshold.
U in volts
P 16 in watts delivered to a 16 Ωimpedance
P 8 in watts delivered to a 8 Ωimpedance
P 4 in watts delivered to a 4 Ωimpedance
P 2 in watts delivered to a 2 Ωimpedance

4.2 Note - chart for SP2 configurations
Fig. 14 Simplified SP2 layout can be used as a note chart for controller configurations.

4.3 Factory presets
SP2 units which have not been delivered as part of a SEEBURG acoustic line sytem are factory
preset as follows:
X-over: 3 dB point (SIP): 105 Hz (12 kΩ)
Filter falloff: 24 dB/oct.
Phase angle HighMid and Woofer: 0°
Attenuation HighMid: 0 dB
Mono-Option: off
EQ 1: Center frequency (SIP): 55 Hz (6,8 kΩ)
Insert: Woofer
Bandwidth: normal (jumper centered)
Gain: 0 dB (trimmer in center position)
EQ 2: Center frequency (SIP): 210 Hz (6,8 kΩ)
Insert: HighMid
Bandwidth: normal (jumper centered)
Gain: 0 dB (trimmer in center position)
EQ 3: Center frequency (SIP): 3200 Hz (1,8 kΩ)
Insert: HighMid
Bandwidth: normal (jumper centered)
Gain: 0 dB (trimmer centered)
EQ 4: Center frequency (SIP): 13500 Hz (1 kΩ)
Insert: HighMid
Bandwidth: normal (jumper centered)
Gain: 0 dB (trimmer centered)
Limiter: all limiter-DIP-switches on (limiter not in operation)

4.4 SP2 specifications
SNR (at 6 dB gain): > 103 dB (EQ included)
THD (at 6 dB gain): < 0,04 %
Headroom: 22 dBU
subsonic/ultrasonic filters: -3 dB points at 25 Hz and18 kHz
-18 dB/octave
Output impedance (Signal to Amp): 600 Ω
Input impedance (Audio In): 40 kΩ
AC mains / power draw: 230 Volt/AC/10 VA (EQ inc.)
Dimensions (w x h x d): 482 x 440 x230 mm
Weight: 3,4 kg
4.5 EQ card specifications
Gain: ±12 dB
Frequency bands EQ1: 20 - 330 Hz
EQ2: 75 - 1250 Hz
EQ3: 430 - 7000 Hz
EQ4: 1150 - 19000 Hz
(Specifications subject to change without notice)
4.6 Glossary
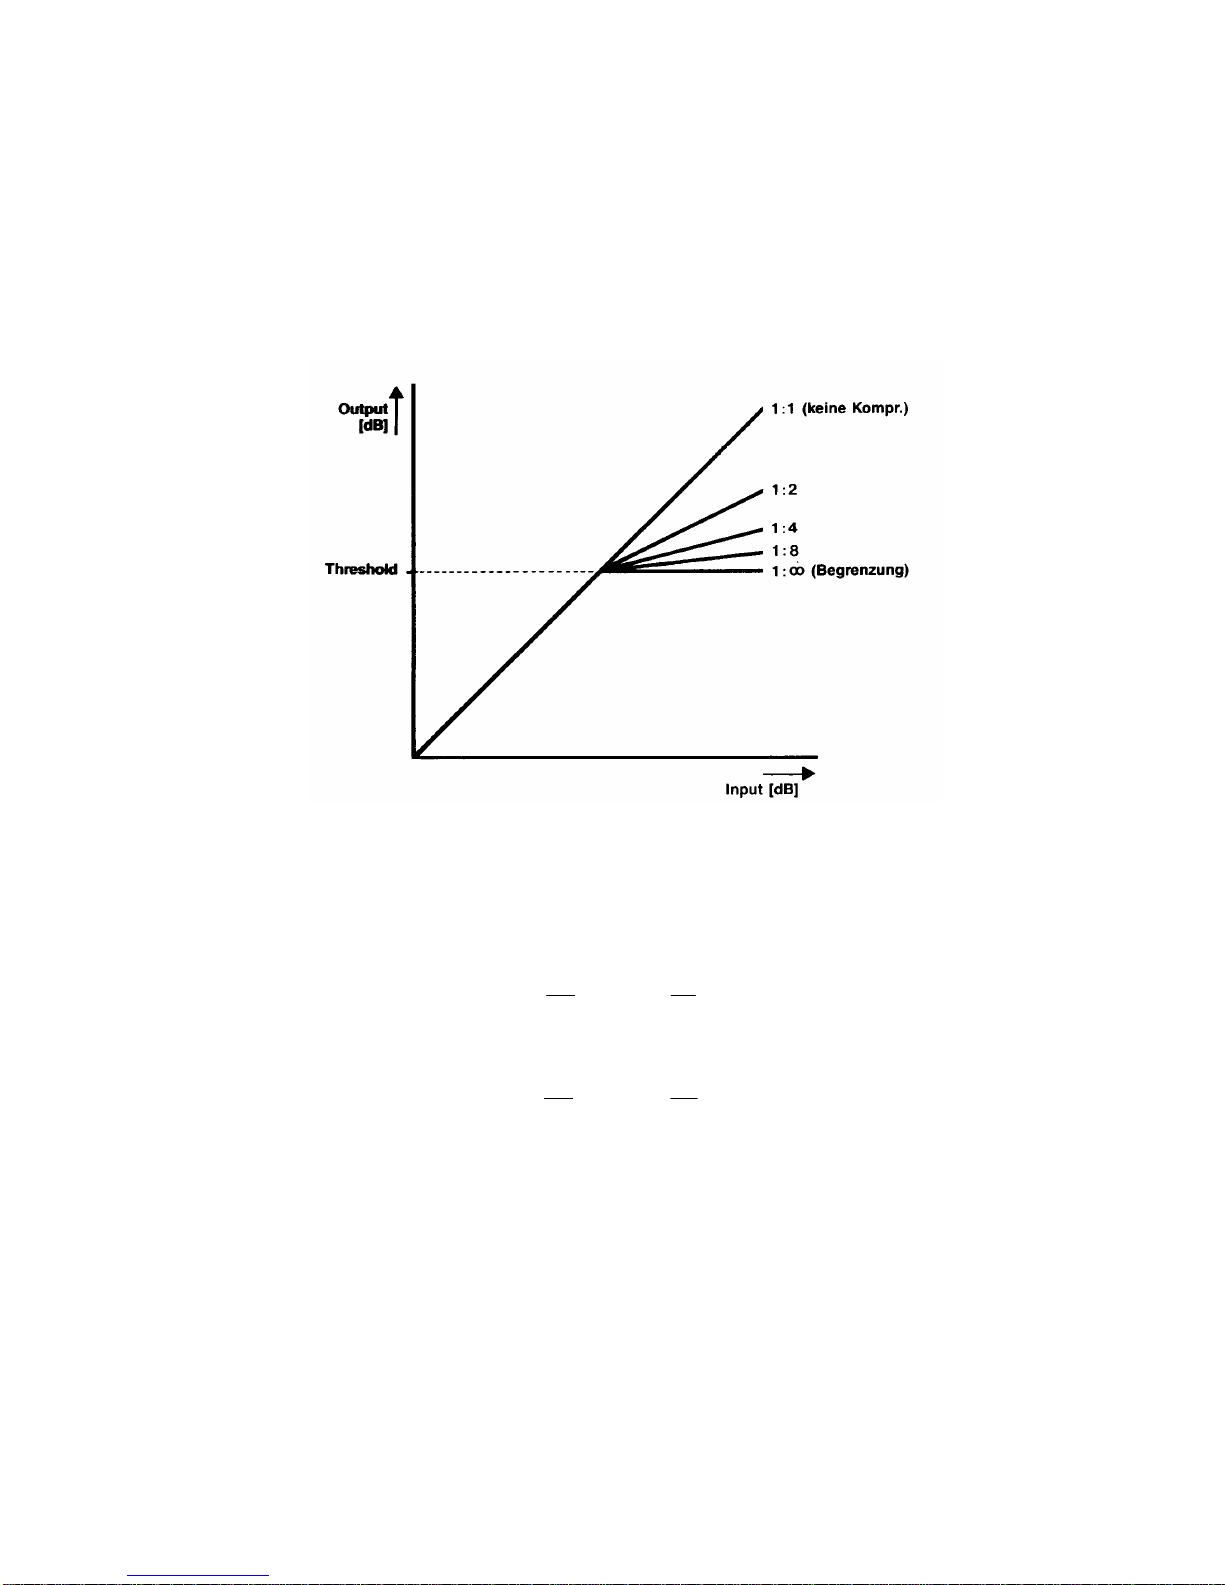
•Compression ratio: Compressors limit the audio signal amplitude whenever it surpasses a
certain preset threshold level. The characteristic curve’s slope equals 1 below this threshold,
meaning that the output amplitude is the same as the input amplitude. At the threshold point the
curve has a knee, beyond which the slope decreases with increasing compression ratio. Here,
the output grows slower than the input (see fig. 15). The compression ratio is the slope of the
curve above the compressor’s threshold. Stand alone compressor units feature an adjustable
compresion ratio, as opposed to a limiter, which usually shows a fixed compression ratio of 1:∞
(i.e. a slope of 0: the output amplitude is constant over varying input levels).
Fig. 15 Illustration to help explain the term compression ratio.
•Decibel (dB): In technical acoustics all kinds of signal amplitudes, power levels and sound
pressure levels are usually expressed in decibels. Since a decibel is a logarithmic measure, it
can only express the ratio of two signals, and no absolute values.
By definition, the ratio of two power levels is:
L
dB
P
P
p= ⋅10 0
log( )
With the help of a known impedance, this can be expressed in voltages as follows:
L
dB
U
U
u= ⋅20 0
log( )
The reference voltage U0 in audio electronics is by convention 0.775V.
The reference power level P0is usually assumed to be 1 mW, which equals 0.775V into 600 Ω.
•Phase shift: The superposition of two identical waveforms of the same frequency and
amplitude that cross zero at the same time (i.e. they are in phase) results in the same wave with
its amplitude doubled (see fig. 16a). Likewise, if they are 180° out of phase, the wave is
extinguished (see fig. 16b). The time delay between the two waves is called their phase shift.
The effect of the amplitude amplification/attenuation depends strongly on the amount of phase
shift. It is not necessary for the two signals to have the same amplitude, it is just that then the
effect is at its extreme. But even lesser effects due to different amplitudes (at the same
frequency) can be very noticable in audio reproduction.
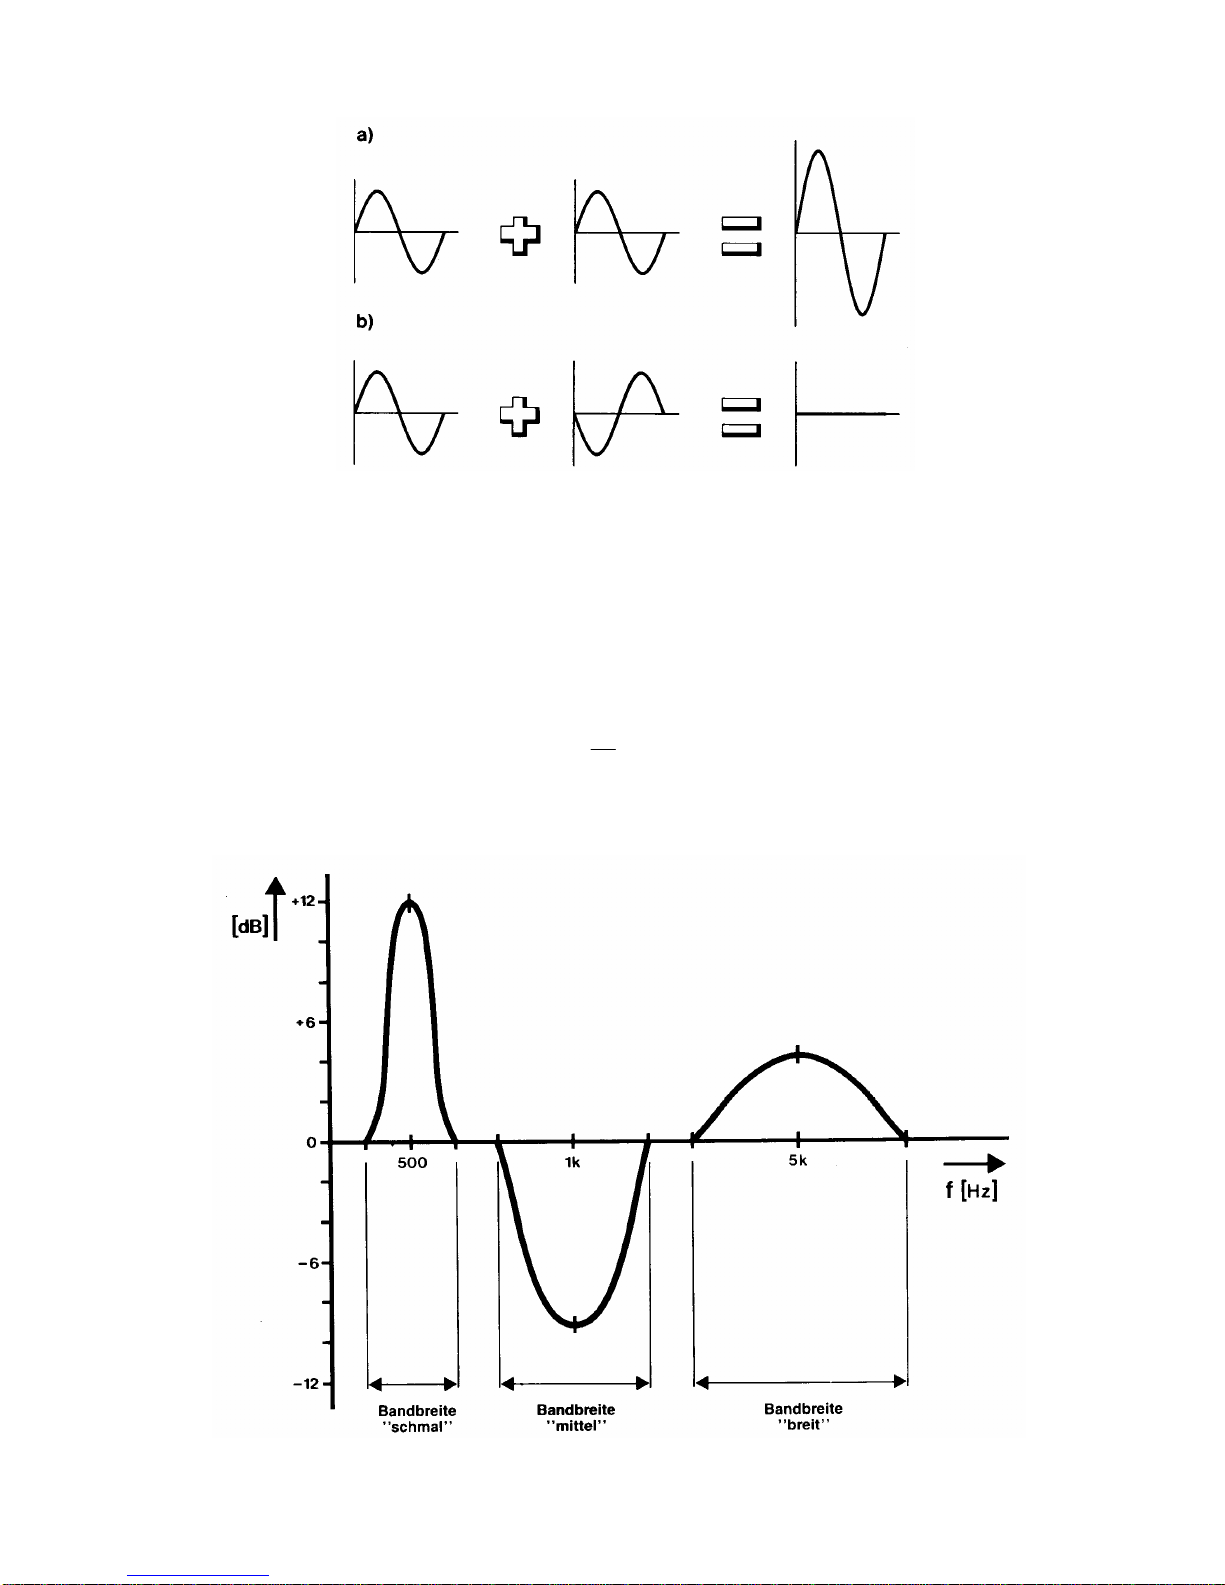
Fig. 16 Two waves of equal amplitude, frequency and phase add up to a wave of twice the amplitude (a).
•Filter Q: The quality factor (Q) of a resonant filter is a measure for the sharpness of the
resonance peak that can be realized with this circuit. Every equalizer contains a number of
electric resonant filters. A equalizer with a low Q will affect the frequencies in the vicinity of the
resonance peak stronger than one with a high Q. So, if you want to control only a very narrow
frequency band you have to choose a very high Q filter. However, in many applications it is
desired to affect a wider range (for example a broad bass boost between 50 and 150 Hz in a PA
system), which can be achieved with a low filter Q (see fig. 17).
The filter Q for electrical resonant circuits can be expressed as:
Qf
B
=0
B = fu-fl: Bandwidth. fu is the upper 3 dB point, fl is the lower 3 dB point.
fo: Center frequency.
Fig. 17 Filter Q and Bandwidth.

SEEBURG acoustic line GmbH
Auweg 32
D-89250 Senden/Freudenegg
www.acoustic-line.de
Table of contents
Other Seeburg Recording Equipment manuals


