A&D Doctor Pro TM-2430-13 User manual

TM-2430-13
(Doctor Pro)
Ambulatory Blood Pressure Monitor
Data Analysis Software
INSTRUCTION MANUAL
WM:PD4000019C

1
CONTENTS
1. INTRODUCTION.........................................................................................................3
1-1 About the Data Analysis Software...................................................................................................3
1-2 Symbols...........................................................................................................................................4
1-3 Monitoring Device Review...............................................................................................................4
1-4 Software Package Components......................................................................................................5
1-5 System Requirements.....................................................................................................................5
1-6 Installing the Software.....................................................................................................................5
1-7 Safety...............................................................................................................................................5
2. OPERATING PROCEDURE .......................................................................................6
2-1 Getting Started ................................................................................................................................6
2-2 Communication Between the Monitor and the Software.................................................................6
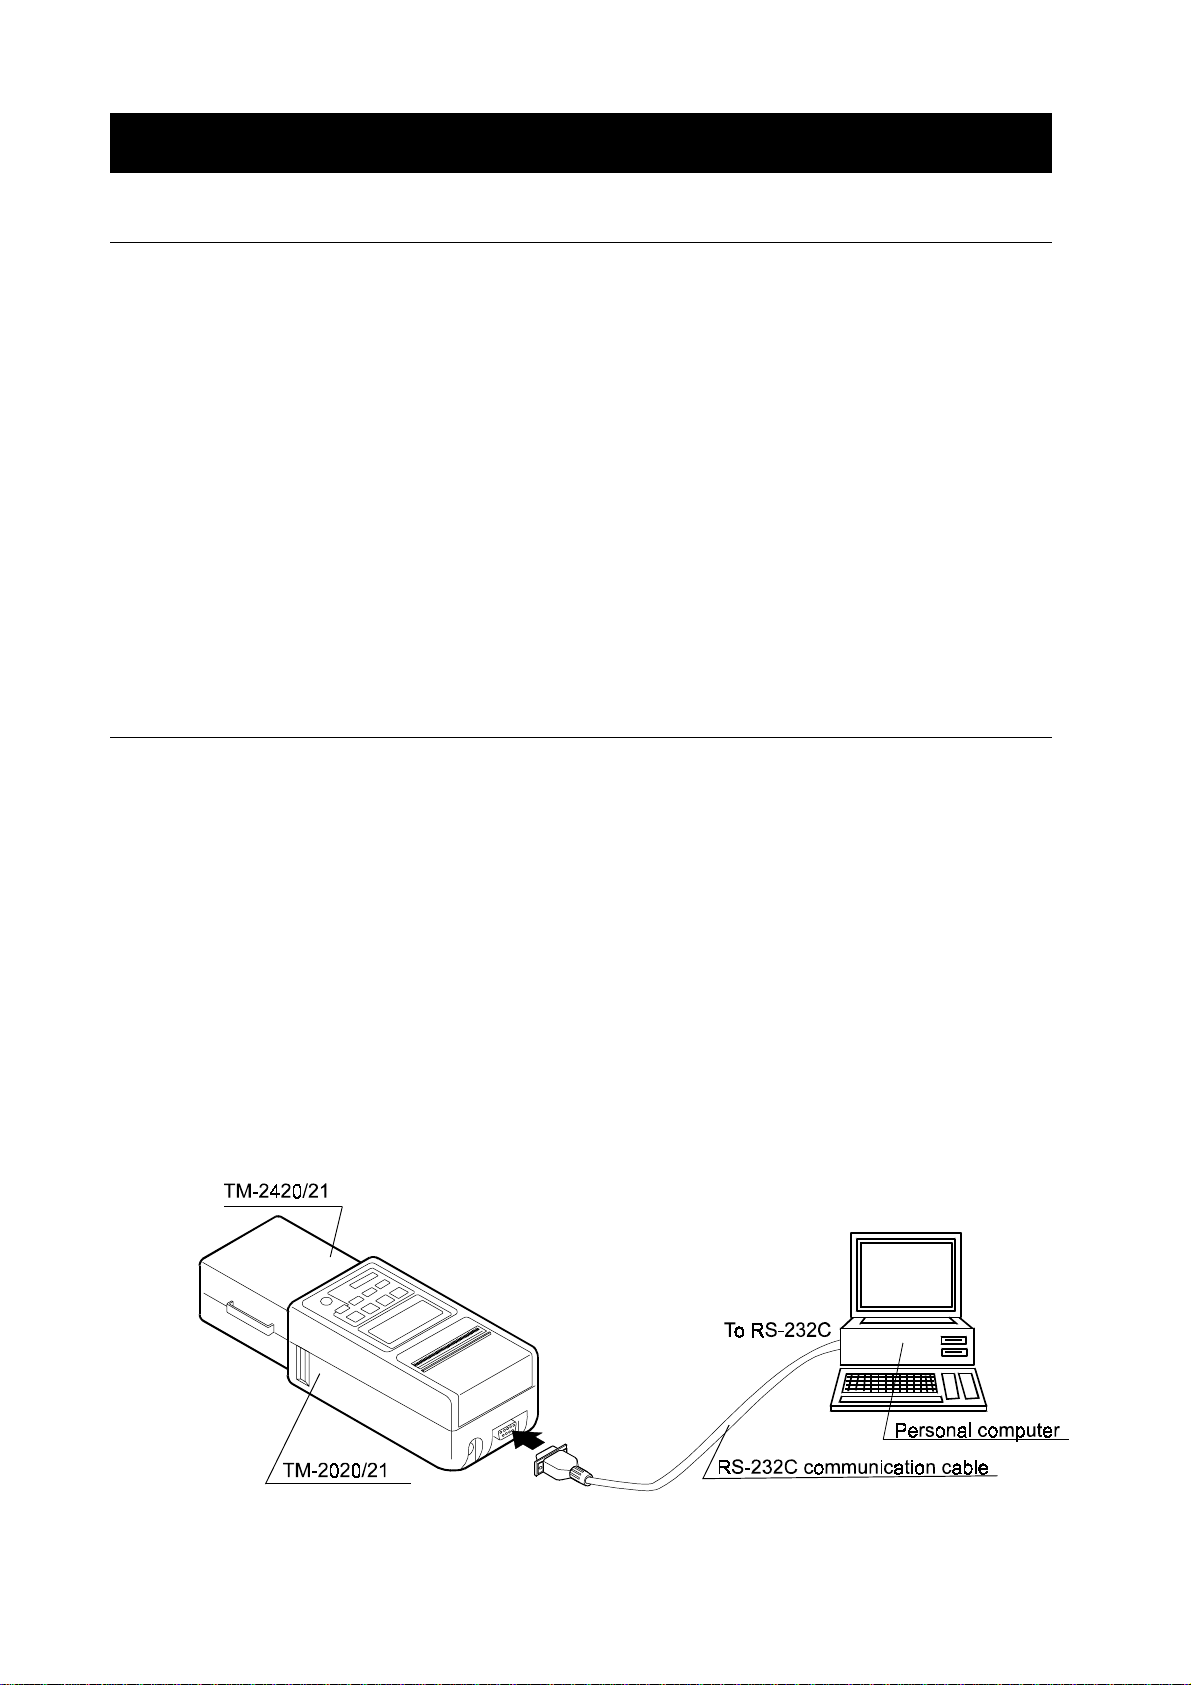
2-2-1 Connecting the TM-2420/TM-2421 to the computer ....................................................................6
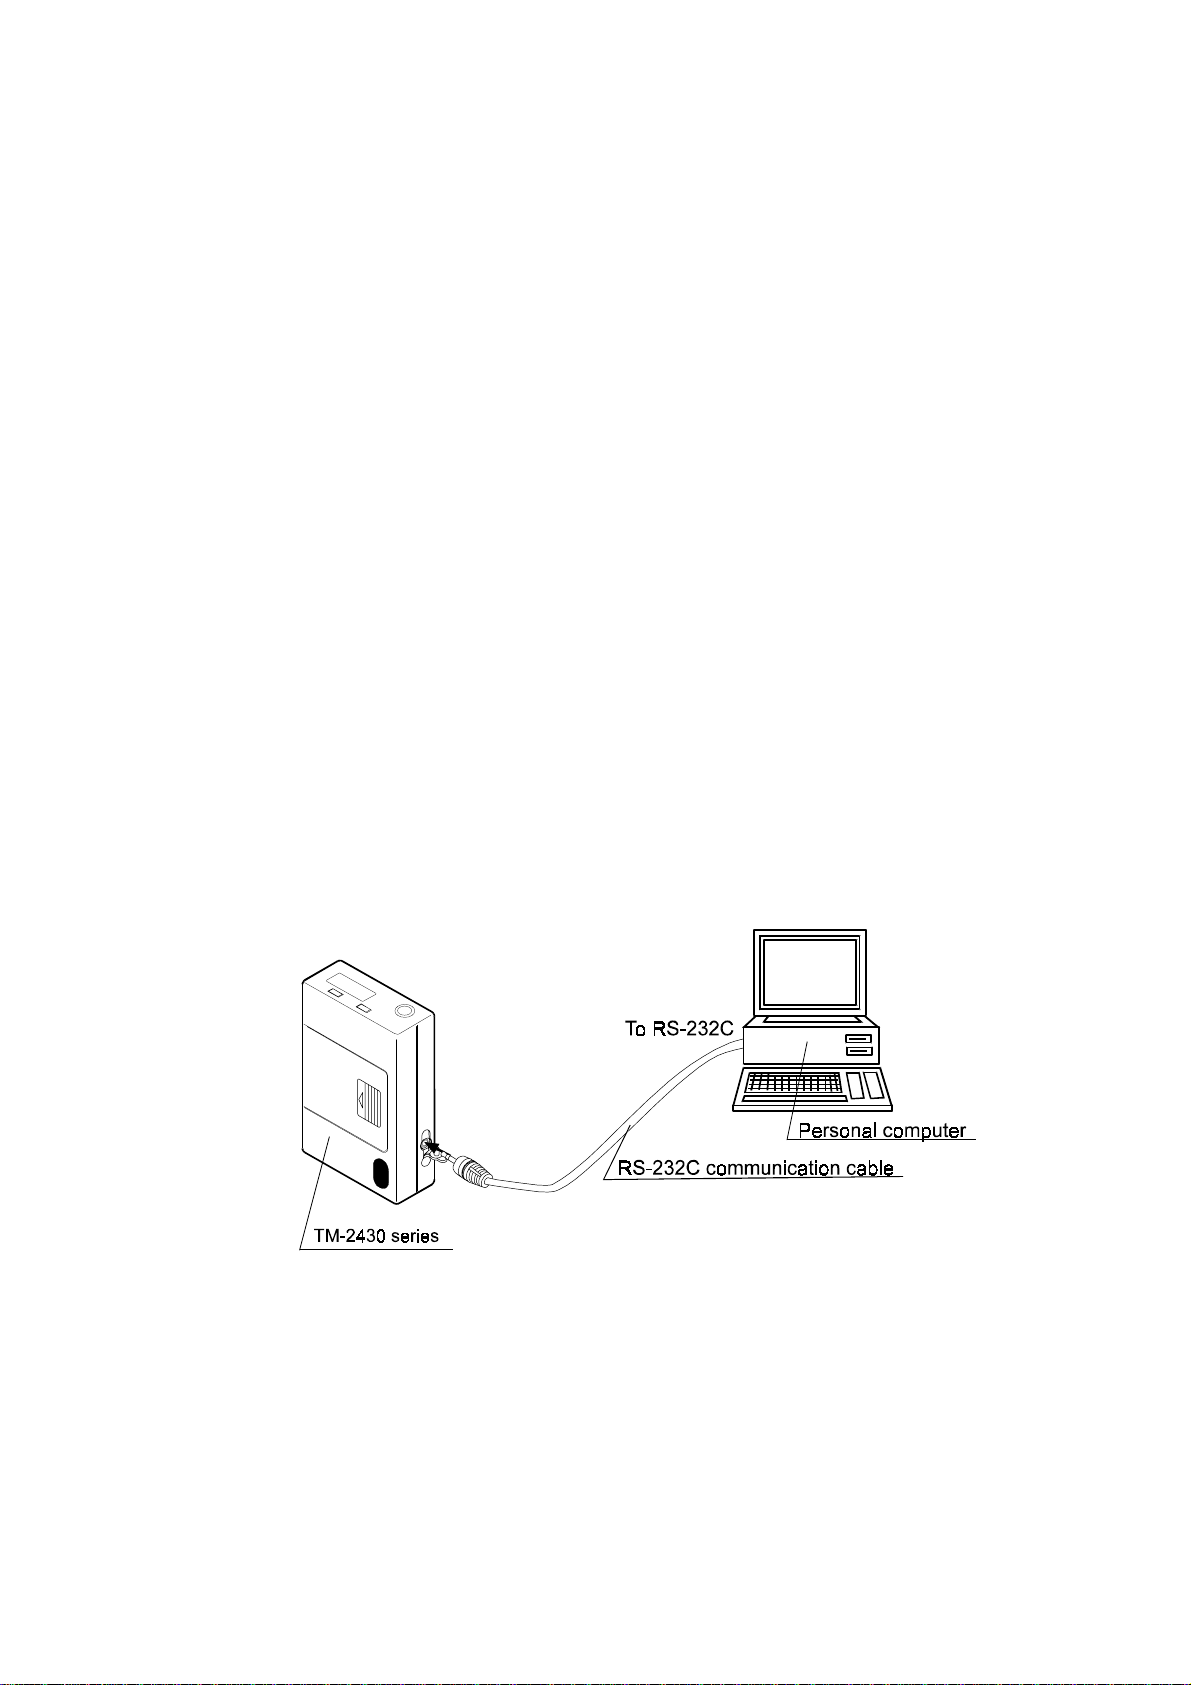
2-2-2 Connecting the TM-2430 series to the computer.........................................................................7
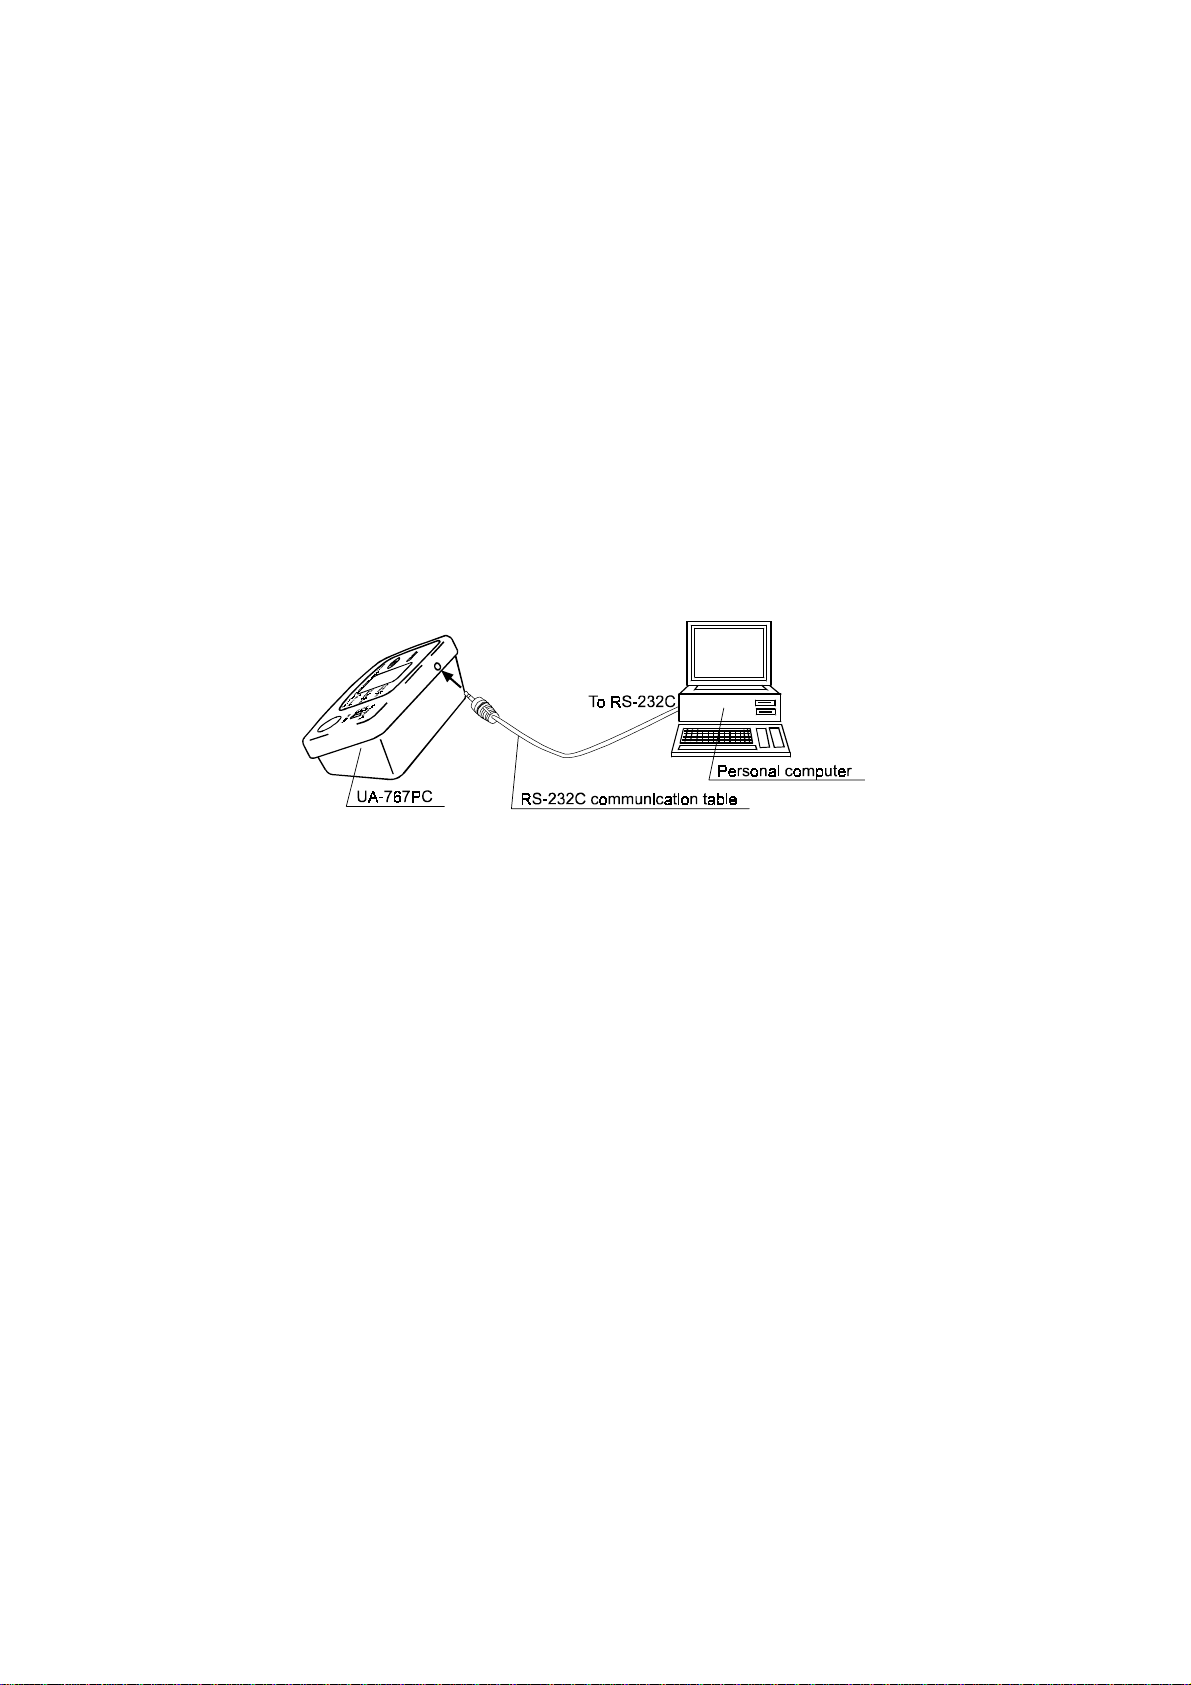
2-2-3 Connecting the UA-767PC to the computer.................................................................................8
2-3 Main Screen Description .................................................................................................................9
2-4 Toolbar ..........................................................................................................................................10
2-4-1 Analysis Intervals........................................................................................................................10
2-4-2 BP Mode.....................................................................................................................................11
2-5 File Menu.......................................................................................................................................12
2-5-1 Open...........................................................................................................................................13
2-5-2 Save As ......................................................................................................................................13
2-5-3 Delete .........................................................................................................................................13
2-5-4 Convert.......................................................................................................................................14
2-5-5 File Merge...................................................................................................................................14
2-5-6 Print ............................................................................................................................................15
2-5-7 Exit..............................................................................................................................................15
2-5-8 Saving a File...............................................................................................................................15
2-5-9 Closing a Data File.....................................................................................................................15
2-6 View Menu.....................................................................................................................................16
2-6-1 Summary Data............................................................................................................................17
2-6-2 BP Data List................................................................................................................................19
2-6-3 Trends Screen............................................................................................................................21
2-6-4 Correlation Plots.........................................................................................................................25
2-6-5 Histograms .................................................................................................................................27
2-6-6 Circadian Rhythm.......................................................................................................................28
2-6-7 HIB Analysis ...............................................................................................................................29
2-6-8 Patient Information .....................................................................................................................30

2
2-7 Recorder Menu............................................................................................................................. 31
2-7-1 Retrieving Data from the Monitor............................................................................................... 32
2-7-2 Clearing The Monitor’s Memory ................................................................................................ 33
2-7-3 Programming the Monitor’s Intervals and Conditions................................................................ 34
2-7-4 Blood Pressure Measurement (Available only with the UA-767PC) ......................................... 40
2-8 Report Menu................................................................................................................................. 41
2-8-1 Creating a New Report Template.............................................................................................. 42
2-8-2 Editing an Existing Report Template......................................................................................... 43
2-8-3 Deleting an Existing Report Template....................................................................................... 43
2-8-4 Saving a Default Report Template for Printing.......................................................................... 43
2-8-5 Printing an Existing Report Template........................................................................................ 43
2-8-6 Closing the Report dialog box ................................................................................................... 43
2-9 Options Menu ............................................................................................................................... 44
2-9-1 Report formats........................................................................................................................... 44
2-9-2 Physician List............................................................................................................................. 44
2-9-3 Trend Display............................................................................................................................. 45
2-9-4 Default Settings ......................................................................................................................... 46
2-10 On-line Help................................................................................................................................ 47
3. TROUBLESHOOTING ............................................................................................. 48
3-1 Measurement Errors..................................................................................................................... 48
3-1-1 TM-2420/TM-2421 Error Codes ................................................................................................ 48
3-1-2 TM-2430 Series Error Codes..................................................................................................... 50
3-2 Communication Errors.................................................................................................................. 51
3-3 Missing Files................................................................................................................................. 52
3-4 Reports Are Not Printing With the Desired BP Mode................................................................... 52
3-5 Summary Data / Sleep Tab Data can not be Seen...................................................................... 52
4. PRINTOUT EXAMPLES........................................................................................... 53
5. TERMS/ABBREVIATIONS....................................................................................... 62
5-1 Terms Related to Blood Pressure ................................................................................................ 62
5-2 Terms Related to Statistics........................................................................................................... 62
5-3 Terms Related to Biological Rhythm............................................................................................ 63
5-4Terms Related to the Risk Management of High Blood Pressure................................................. 65

3
1. INTRODUCTION
1-1 About the Data Analysis Software
Welcome to the Ambulatory Blood Pressure Monitor (ABPM) Data Analysis Software.
This software is intended for use with the following devices.
ABPM: For diagnosing high blood pressure
1) A&D TM-2430 Series Ambulatory Blood Pressure Monitor
2) A&D TM-2420/TM-2421 Ambulatory Blood Pressure Monitor
and the TM-2020/TM-2021 Printer/Processor/Interface (hereafter referred to as "processor").
Home use monitor: For managing the blood pressure of a high blood pressure patient
3) A&D UA-767PC Digital Blood Pressure Monitor
The ABPM Data Analysis Software, that analyzes ambulatory blood pressure data, is a powerful tool
for diagnosing high blood pressure and managing the blood pressure of a high blood pressure
patient. The following features are incorporated in this software:
♦Statistical Analysis Statistical data may be viewed in full, partial,
sleep, and awake intervals, respectively in full
screen, by switching between clearly labeled
tabs.
♦Graphical Data Systolic/diastolic blood pressure, mean arterial
blood pressure, and pulse data are displayed
graphically to quickly determine patterns or
trends in the data.
Circadian rhythm and HBI analysis are
displayed graphically and numerically.
♦Data Conversion The Data Convert feature automatically stores
blood pressure and pulse data in standard
(CSV) file format for use with popular
spreadsheet programs.
♦Printed Reports Custom data report formats are easily defined
and printed. “Mini-report” feature automatically
prints a compact summary report.
♦On-line Help Built-in Help feature provides context-sensitive
help at any time.
♦Maximum Time Period Doctor Pro can analyze up to one week’s data
starting from the oldest reading.
When used with the UA-767PC, Doctor Pro can
analyze up to five years’ data
♦Maximum number of readings The maximum number of readings that Doctor
Pro can process is 900.
When used with the UA-767PC, Doctor Pro can
process 1827 readings.

4
1-2 Symbols
The symbols printed on the device have the following meaning:
CE marking
SN Serial number
1-3 Monitoring Device Review
The following section briefly reviews the devices and how they may be used with this software.
A&D Ambulatory Blood Pressure Monitors are used to record an individual’s blood pressure over an extended
period of time, normally 24-72 hours. The monitor is worn by the patient. The monitor non-invasively records
the patient’s systolic/diastolic blood pressure and heart rate based on predetermined intervals and conditions.
With a UA-767PC, the blood pressure data on individuals for a long period of time can be managed
and blood pressure trends are indicated clearly by using this software.
The user may divide each 24-hour period into several time intervals. Within each period the monitor
may be programmed to record the patient’s blood pressure at 11, 31, 5, 10, 15, 201, 30, 60, and 1201-
minute intervals. The monitor can also be programmed to remain OFF during any time interval.
These measurement intervals may be timed to coincide with the patient’s daily activities.
The A&D TM-2020/TM-2021 Printer/Processor/Interface is used for performing one or more of the
following functions: Analyze blood pressure data stored in the monitor; program the monitor’s
intervals and conditions; function as an interface between the monitor and the software.
Note:Data that was initially analyzed using A&D TM-2020-01/02/03 or TM-2021-
01/02/03 Data Analysis Software Program for DOS™ is compatible with this
software’s format and can be analyzed by this software.
1 The 1 and 3-minute measurement intervals are available only with the TM-2420/TM- 2421.
The 20-minute measurement interval is available only with the TM-2421.
The 120-minute measurement interval is available only with the TM-2421/ TM-2430.

5
1-4 Software Package Components
Items included in your complete software package are:
♦ABPM 3.5-inch program disk
♦Ambulatory Blood Pressure Monitor Data Analysis Software Instruction Manual
♦For TM-2420/TM-2421
AX-KO600 (9 pin D-SUB, socket type), Communication cable for TM-2420/TM-2421
♦For TM-2430 series/UA-767PC
AX-KO1502 (9 pin D-SUB, socket type), Communication cable for TM-2430 series
1-5 System Requirements
♦Computer A 486DX or higher microprocessor
♦RAM Memory Minimum 16 MB
♦Operating System Windows™ 95, 98, Me, 2000, NT 4.0
♦Graphic Adapter SVGA video card
(minimum of 256 colors, 800X600 pixels or higher
recommended)
♦Disk Type 3.5-inch floppy disk drive
♦Hard Disk At least 2.5 MB
♦Serial Ports Minimum one (9 pin D-SUB or 25 pin D-SUB)
(A cable separately available is required for the 25 pin
D-SUB serial port)
♦Printer Type Printers supported by MS Windows™ operating system
1-6 Installing the Software
The software must be run from a hard disk drive only. It may not be run from a floppy disk. To
install the software on your hard disk drive, complete the following instructions:
Step 1 Insert the program disk in drive A:.
Step 2 Click the Start button on the Windows taskbar and select Run.
Step 3 Type “a:setup”
Step 4 Click OK.
Step 5 Follow the instructions on the screen.
Note The serial number is required when installing the software. The serial number is
printed on the label of the program disk.
1-7 Safety
Do not attach the monitor to a patient when the monitor, or the monitor and the processor, are being
connected to a computer.

6
2. OPERATING PROCEDURE
2-1 Getting Started
Two initial actions may be executed when starting up the software:
(1) Data may be retrieved from the monitor.
(2) Stored data files may be opened and viewed for analysis.
To retrieve data from the monitor, see:
♦“2-2 Communication Between the Monitor and the Software”
To view stored files, see:
♦“2-5-1 Open”
2-2 Communication Between the Monitor and the Software
To communicate between the monitor and the software, the connection between the monitor and the
computer must be established first.
2-2-1 Connecting the TM-2420/TM-2421 to the computer
♦You must use the A&D-supplied RS-232C communication cable, otherwise
communication errors will occur.
♦Steps 1-4 must be completed prior to accessing the software or it may not recognize that
the monitor is connected to the computer. If proper communication is not established, a
cable check error may occur.
♦You must use AX-KO600 cable for 9 pin serial port (supplied) or AX-KO599 cable for 25
pin serial port (available separately as an option).
Figure 1: Connection between the TM-2420/2421 and the computer
(The illustration above is not to scale.)

7
Step 1 Connect the monitor to the processor.
Step 2 Connect the male end of the A&D-supplied RS-232C communication cable to the
processor.
Step 3 Connect the female end of the A&D-supplied RS-232C communication cable to the
computer.
Step 4 The display on the processor will show “0-----”. If the processor does not have a
display, the LED should be green. If the LED is not green or the “0-----” does not
appear, see “3-2 Communication Errors”. If the processor shows “0-----”, go to step
5. If the processor has a green light, go to step 6.
Note:If possible, keep the cable connected to the computer unless the port is needed
for other functions.
Step 5 Press the ENTER key on the processor keypad. A series of 6 dashes “------” will
appear on the processor screen.
Step 6 Run the software.
Step 7 Confirm that the correct serial port is set. For details, see “2-9-4-2 Serial Port”.
2-2-2 Connecting the TM-2430 series to the computer
♦You must use the A&D-supplied RS-232C communication cable, otherwise
communication errors will occur.
♦You must use AX-KO1502 cable for 9 pin serial port (supplied) or AX-KO1503 cable for
25 pin serial port (available separately as an option).
Figure 2 : Connection between the TM-2430 series and the computer
(The illustration above is not to scale.)
Step 1 Connect the male end of the A&D-supplied RS-232C communication cable to the
monitor.
Step 2 Connect the female end of the A&D-supplied RS-232C communication cable to the
computer.

8
Step 3 The display on the monitor will show “----”. If “----” does not appear, see “3-2
Communication Errors”. Otherwise go to step 4.
Note:If possible, keep the cable connected to the computer unless the port is needed
for other functions.
Step 4 Run the software.
Step 5 Confirm that the correct serial port and the correct monitor type are set. For details,
see “2-9-4-2 Serial Port” and “2-9-4-3 Recorder Type”.
2-2-3 Connecting the UA-767PC to the computer
♦You must use the A&D-supplied RS-232C communication cable, otherwise
communication errors will occur.
♦You must use AX-KO1502 cable for 9 pin serial port (supplied) or AX-KO1503 cable for
25 pin serial port (available separately as an option).
Figure 3: Connection between the UA-767PC and the computer
(The illustration above is not to scale.)
Step 1 Connect the male end of the A&D-supplied RS-232C communication cable to the monitor.
Step 2 Connect the female end of the A&D-supplied RS-232C communication cable to the
computer.
Step 3 After the connection, the display on the monitor will not change. The display will show
“----”, just before starting communication.
Note:If possible, keep the cable connected to the computer unless the port is needed
for other functions.
Step 4 Run the software.
Step 5 Confirm that the correct serial port and the correct monitor type are set. For details,
see “2-9-4-2 Serial Port” and “2-9-4-3 Recorder Type”.
The software is now ready to:
♦Retrieve data from the monitor. See “2-7-1 Retrieving Data from the Monitor”.
♦Clear the monitor’s memory. See “2-7-2 Clearing the Monitor’s Memory”.
♦Program the monitor’s intervals and conditions. See “2-7-3 Programming the Monitor’s
Intervals and Conditions”.

9
2-3 Main Screen Description
The main screen is comprised of six menus and two toolbar buttons located permanently along the
top of the screen. These menus may be used to access the various features of the software. The
toolbar buttons may be used to set Partial Analysis and Blood Pressure Mode parameters.
Toolbar Buttons: (Only for TM-2420/TM-2421, TM-2430)
Button See Description
Analysis Intervals “2-4-1 Analysis Intervals” The Analysis Intervals button may be used
to define specific “Full” and “Partial” time
intervals within an opened data file for
custom data analysis.
Note: Not available with the UA-767PC.
BP Mode “2-4-2 BP Mode” The BP Mode selection box may be used
to specify which blood pressure
measurement method (Korotkoff,
oscillometric or both) is used as the basis
for statistical and graphical analysis.
Note: This only applies to TM-2421 data
files.
Main Menus:
Menu See Description
File “2-5 File Menu” The File menu may be used to manage the
files stored on the hard drive or a floppy disk
and to exit the software.
View “2-6 View Menu” The View menu may be used to access the
statistical, tabular, and graphical analysis
screens.
Recorder “2-7 Recorder Menu” The Recorder menu may be used to
program the monitor, clear measurement
data in the monitor’s memory and to retrieve
the measurement data from the monitor.
Report “2-8 Report Menu” The Report menu may be used to specify
report formats and print reports.
Option “2-9 Options Menu” The Options menu may be used to set the
default settings and user-defined
parameters.
Help “2-10 On-line Help” The Help menu may be used to view
information on software usage. Help may
also be accessed by pressing F1 when
various screens are opened or by clicking
the Help button on a screen.

10
2-4 Toolbar
There are two toolbar buttons which appear underneath the main menu bar:
(1) Analysis Intervals
(2) BP Mode
2-4-1 Analysis Intervals
The Analysis Intervals feature is used to define specific periods of time within an opened data file for
custom data analysis. Two intervals, Full Analysis and Partial Analysis may be defined for each data
file.
Figure 4: Analysis Intervals dialog box
To set the Analysis Intervals, complete these steps:
Step 1 Click the Analysis Intervals button on the toolbar.
Step 2 Set each item in the Full analysis interval box, using the scroll bar.
Step 3 Check a Status button in the Partial analysis interval box. When “Enabled” is checked,
set each item in the box.
Step 4 Click the Save button.
Step 5 To cancel the settings, click the Cancel button.
The Partial Analysis Interval affects many of the software features including:
♦Summary Data
After the Partial Analysis Interval is enabled, the Partial tab in the Summary Data will be
activated.
♦Trend Graphs
After Partial Analysis Interval is defined, the data specified within the parameters will
appear in red on the Trend Graph.
♦Correlation Plots
After Partial Analysis parameters are defined, a second set of Correlation plots in red will
appear based on the data specified within the Partial Analysis parameters.

11
♦Histograms
After Partial Analysis parameters are defined, the data specified within the parameters
will appear in red overlaying the Full Analysis data.
2-4-2 BP Mode
The BP Mode is used to select which blood pressure method will be used as the primary and
secondary choices for displaying the blood pressure measurement data. A&D monitors employ
either Korotkoff, oscillometric or dual Korotkoff and oscillometric measurement methods. If the
current data file contains data from a dual system, you may choose Korotkoff, oscillometric or both
methods to analyze the data.
The measurement method(s) specified in the BP Mode will be the basis for the statistical and
graphical analysis performed on the opened data file. The method noted with a one (1) is the
primary method and the method noted with a two (2) is the secondary method. If a primary method
measurement error occurred during the monitoring session or a measurement is manually excluded
(see “2-6-2-1 Excluding/Including BP Measurements”), a valid measurement in the secondary
method will be substituted for it with the appropriate BP Mode selection.
Method Setting Description
Oscillometric only This option sets the primary blood pressure choice to
oscillometric and disables the secondary choice. If the
oscillometric reading for any measurement is invalid or has
been excluded by the user in the BP Data List, the
measurement will be excluded from graphical displays and
statistical computations.
1: Oscillometric, 2: Korotkoff This option sets the primary blood pressure choice to
oscillometric and the secondary choice to Korotkoff. If an
oscillometric reading is invalid, oscillometric readings will
be substituted with Korotkoff readings. If both readings
are invalid for a measurement, all data from the
measurement is excluded.
Korotkoff only This option sets the primary blood pressure choice to
Korotkoff and disables the secondary choice. If the
Korotkoff reading for any measurement is invalid or has
been excluded by the user in the BP Data List, the
measurement will be excluded from graphical displays and
statistical computations.
1: Korotkoff, 2: Oscillometric This option sets the primary blood pressure choice to
Korotkoff and the secondary choice to oscillometric. If a
Korotkoff reading is invalid, Korotkoff readings will be
substituted with oscillometric readings. If both readings
are invalid for a measurement, all data from the
measurement is excluded.

12
To specify the BP Mode while viewing an opened data file, complete these steps:
Step 1 Select the BP Mode box on the toolbar.
Step 2 Select the desired BP Mode used to view and analyze the opened data file.
Figure 5: BP Mode selection on toolbar
To set a default BP Mode for the software at startup, see “2-9-4 Default Settings”.
Note:The BP Mode for printed reports is assigned separately in the Report Format
Setup. See “2-8 Report Menu”.
2-5 File Menu
The File menu is used to manage the files stored on a hard drive or floppy disk. It may also be used
to exit the software. The File menu has the following sub-menus:
Menu Description
Open This function is used to select a data file for viewing, modifying or
printing a report. After a file has been opened, the file name, patient
name and date of the monitoring session are displayed in the title bar
of the main screen
Save As This function is used to copy a selected file to a new file with a
different name.
Delete This function is used to delete a selected file.
Convert This function is used to convert the blood pressure measurement
data of a data file to a format which is readable by most spreadsheet
applications. The converted file will have the same name as the data
file with a .CSV file extension.
Merge the BP data files This function is used to merge multiple data files into one file.
Print This function is used to print reports for one or more data files
according to a user-selectable report format.
Exit This selection is used to exit the software.

13
2-5-1 Open
The File | Open function is used to access the blood pressure data within existing data files.
Figure 6: File Open dialog box
To open a file, complete the following steps:
Step 1 Select the File menu.
Step 2 Select the Open sub-menu.
Step 3 Select a file from the directory shown or move to a different directory.
Step 4 Click the Open button.
Note:The File | Save As, View and Report menus and Analysis Intervals buttons are
disabled until a data file is opened.
2-5-2 Save As
The File | Save As function is used to copy an open data file to another data file with a different
name or to a different directory with any name.
When a file is copied, corresponding .dat and .p files are created. These two files must stay together
within the same directory. The Save As function creates new .dat and .p file with the new file name
in the selected directory. When entering a new file name in the Save As dialog box, it is not
necessary to type the file extension. The original file will not be altered when using the Save As
function.
2-5-3 Delete
The File | Delete function is used to delete a data file.
CAUTION: Data files will be permanently removed when deleted.

14
2-5-4 Convert
The File | Convert function is used to create a .CSV (comma delimited) format file from a .dat file
that is compatible with most spreadsheet applications, including Microsoft Excel™. The .CSV file
that is created includes DATE, TIME, SYS, DIA, MAP, PUL headings so that the data can be
identified correctly when opened in a spreadsheet. The original file will not be modified in any way.
The data is being converted and will be saved to the same name and directory as the original data
file, but with a .CSV extension.
2-5-5 File Merge
The File | Merge function is used to merge multiple data files into a new file.
Figure 7: File Merge dialog box
To merge multiple data files, complete the following steps:
Step 1 Select the File menu.
Step 2 Select the Merge the BP data files sub-menu.
Step 3 Select the data type to be merged.
Step 4 Open the folder that contains the data files to be merged.
Step 5 Drag the selected data files to the Merge-File-List Box.
Step 6 Click the OK button.
Step 7 Save the selected data files in a new file.
Note:
•
The data files, of which time periods overlap, can not be merged.
•
The merged file will not open if the merged time period exceeds:
8 days (TM-2420/TM-2421 and TM-2430)
5 years(UA-767PC).
•
File merging is available only for data files of the same monitor. Data files of
different monitors can not be merged.
The default data type of the file merge dialog box, when opened, is UA-767P(C).

15
2-5-6 Print
The File | Print function is used to print reports for one or more data files according to a user-
selected format. This enables the user to generate multiple reports without having to open each file
separately.
To print a report for multiple data files, complete the following steps:
Step 1 Select the File menu, then select the Print sub-menu.
Step 2 In the Print dialog box, select the files that you want to print a report for by holding
the Shift or Ctrl key down while clicking the desired files.
Step 3 Click Open.
Step 4 In the Report Selection dialog box, select the report format that you want to use for
the reports or click Print “Mini” report to print a condensed report. For “Mini” report
printout examples, see pages 60 and 61.
2-5-7 Exit
The File | Exit selection may be used to exit the software.
2-5-8 Saving a File
Files are automatically saved when the data is retrieved from the monitor. See “2-7-1 Retrieving
Data from the Monitor”. Any modifications made to the data file are saved immediately when the
Save button is selected to close a function.
2-5-9 Closing a Data File
There is no file close feature in this software. A file may be closed in two ways:
1) By opening another file. The current file will automatically be closed when you open
another file.
2) By exiting the software.

16
2-6 View Menu
The View menu may be used to view numerical, statistical and graphical data screens. The View
menu is disabled unless a file is opened. For information on how to open a file, see “2-5-1 Open”.
The View menu has the following sub-menus:
Menu See Description
Summary Data “2-6-1 Summary Data” Function for viewing statistical data.
BP Data List “2-6-2 BP Data List” Function for viewing numerical data and
entering comments.
Trends “2-6-3 Trends Screen” Function for viewing blood pressure, mean
arterial blood pressure, pulse (heart rate) and
double product trends.
Correlation “2-6-4 Correlation Plots” Function for viewing correlation plots of
systolic blood pressure to diastolic blood
pressure and diastolic blood pressure to
pulse.
The scatter diagram allows easy observation
of the correlation between systolic and
diastolic blood pressures; the minimum and
maximum values, the magnitude of fluctuation
and the density, of a 24-hour blood pressure
data.
Histograms “2-6-5 Histograms” Function for viewing the frequency distribution
of the measurement data.
Allows easy observation of the data that
occurs most frequently, the frequency
distribution and the distribution width during
the time interval.
Circadian rhythm “2-6-6 Circadian Rhythm” Function for viewing the graph showing the
estimated amplitude and peak position, and
the numerical data, based on the 95%
confidence interval and the cosinor analysis
graph.
Note: Not available with the UA-767PC.
HBI analysis “2-6-7 HBI Analysis” Function for viewing the graph showing the
hyperbalic area and hypobalic area, and the
numerical data converted into a one-day
period.
Hyperbalic; that area exceeding the user-
defined limits for the sleep and awake
intervals.
Hypobalic; that area not reaching the user-
defined limits for the sleep and awake intervals.
Note: Not available with the UA-767PC.
Patient Information “2-6-8 Patient Information” Function for entering patient and physician
information, as well as fields for the sleep and
awake intervals.

17
2-6-1 Summary Data
The Summary Data screen includes statistics on the data of the opened file and may be viewed
directly on the screen. These statistics are separated into four data tabs:
Full Statistics based on all the data within the file.
Partial Statistics based on the data specified in the Partial Analysis parameter. See “2-4-1
Analysis Intervals”.
Awake Statistics based on the data during the waking hours.
Note:Waking hours are specified as those hours outside the identified sleeping hours.
Sleep Statistics based on the data during the specified sleeping hours. See “2-6-8 Patient
Information”.
To view, close, or print the individual Summary Data screen, complete the following steps:
Step 1 Select the View menu.
Step 2 Select the Summary Data sub-menu. The Summary Data display appears.
Figure 8: Summary Data display
Step 3 Click one of the four data tabs, Full, Partial, Awake or Sleep. The Full tab will always
be enabled. The Partial, Sleep and Awake tabs will be enabled after they are
specified. See “2-4-1 Analysis Intervals” to specify Partial Analysis and “2-6-8
Patient Information” to specify the Sleep interval.
Step 4 To print the data for an individual Summary Data tab, select the tab you want to print
and click the Print button on the right hand side of the screen.
Note:You may also print the Summary Data screens in the standard report, see “2-8
Report Menu”.
Step 5 Click the Close button to close the Data Summary screen.

18
Each of the four Summary Data is titled with the name of the tab, file, patient and measurement
method. For detailed information on Summary Data screen listings, see below:
Summary Data Tab Definition
Time Interval The analysis period, start time/date – end time/date, for the
activated Summary Data tab.
Valid Readings The total number of measurements taken during the monitoring
session less any monitoring errors or manually excluded readings
within the data set. See “3-1 Measurement Errors” for
information on measurement errors.
Excluded Readings The measurement error percentage. This figure is based on the
combined total of measurement errors and excluded
measurements.
Min (Minimum) The minimum measurement value for Systolic, Diastolic, MAP
and Pulse measurements during the Time Interval.
Mean The mean value for Systolic, Diastolic, MAP and Pulse
measurements during the Time Interval.
Max (Maximum) The maximum measurement value for Systolic, Diastolic, MAP
and Pulse measurements during the Time Interval.
SD (Standard Deviation) The Standard Deviation of the value for Systolic, Diastolic, MAP
and Pulse measurements during the Time Interval.
SE (Standard Error) The Standard Error of the value for Systolic, Diastolic, MAP and
Pulse measurements during the Time Interval.
CV(%)
(Coefficient of Variation ) The Coefficient of Variation for Systolic, Diastolic, MAP and Pulse
measurements during the Time Interval.
SYS/DIA limits Systolic and Diastolic limits for the Awake and Sleep interval.
Readings > SYS limit(s) The percentage of the Systolic measurement values greater than
the specified Systolic limit. See “2-9-4-1 BP (Blood Pressure)
Settings" for information on specifying the Systolic Blood
Pressure Limit.
Readings > DIA limit(s) The percentage of the Diastolic measurement values greater
than the specified Diastolic limit. See "2-9-4-1 BP (Blood
Pressure) Settings" for information on specifying the Diastolic
Blood Pressure Limit.
Highest Systolic Value The time and date of the highest Systolic value during the Time
Interval.
Highest Diastolic Value The time and date of the highest Diastolic value during the Time
Interval.
Lowest Systolic Value The time and date of the lowest Systolic value during the Time
Interval.
Lowest Diastolic Value The time and date of the lowest Diastolic value during the Time
Interval.

19
2-6-2 BP Data List
The BP Data List function displays individual blood pressure measurement within an open data file in
tabular form. With the BP Data List, you may input measurement comments, exclude/include a
measurement within the graphics and statistics or link a measurement to the beginning of the Trends
Screen.
The following table defines each heading within the Blood Pressure Data List:
Item Description
# Measurement number
DATE/TIME Date and time of the measurement
SYS Systolic blood pressure
DIA Diastolic blood pressure
MAP Mean arterial blood pressure, obtained by MAP=DIA+(SYS-DIA)/3
PUL Pulse
DP Double Product, obtained by DP=SYS∗PUL/100
STATUS The status line has 3 positions. When filled with a character other than “–”,
each denotes a specific occurrence or condition.
Position 1
BP method,
O or K
Denotes the BP method used for the specific measurement. “K” refers to
Korotkoff method, “O” refers to oscillometric method.
Position 2
E (Event) Indicates that data was measured when the monitor’s EVENT button was
activated.
Position 3
Error code Denotes the specific error code that occurred during the monitoring session,
see “3-1 Measurement Errors”.
Exclude When this column has an “X”, the measurement has been excluded from the
statistics and graphs.
Comments Space provided for user to enter patient diagnostic notations up to 20
characters.
Vertical scroll
bar The vertical scroll bar on the right hand side of the screen helps scroll through
the measurements. This may also be performed with the up and down arrow
keys, as well as the mouse.
Save button Saves any edits, i.e. comments, exclusions or inclusions.
Close button Closes the screen.
Note: Edits (comments, exclusions or inclusions) will not be saved.
Help button Opens the Blood Pressure Data List help screen.
This manual suits for next models
7
Table of contents
Other A&D Software manuals
Popular Software manuals by other brands

Toshiba
Toshiba STRATA CIX Remote Call Control Administrator's guide

Juniper
Juniper JUNOSE FOR E SERIES BROADBAND SERVICES ROUTERS - S... release note

Novell
Novell GROUPWISE 7 - USERS manual

Brocade Communications Systems
Brocade Communications Systems Brocade 8/12c installation guide

Canon
Canon Optura 200 MC instruction manual

Follett
Follett VERSION 6.00 user guide