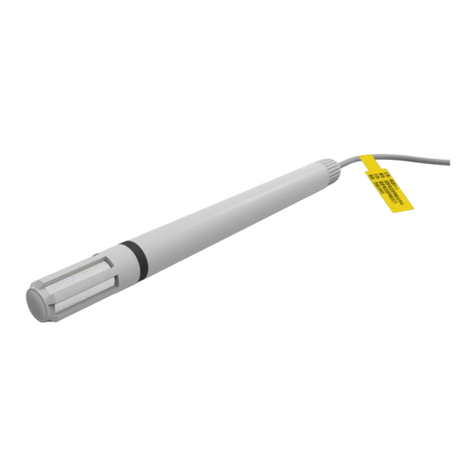
ASAIR AHT10 User manual

AHT10 Technical Manual
Temperature and Humidity Sensor
• Full calibration
AHT10, as a new generation of temperature and
humidity sensors, has established a new standard
in size and intelligence. It is embedded in a double
row flat no-lead package suitable for reflow
soldering, with a bottom of 4 x 5 mm and a height
of 1.6 mm. The sensor outputs calibrated digital
2
signals in standard I C format.AHT10 is equipped
with a newly designed ASIC chip, an improved
MEMS semiconductor capacitive humidity sensing
element and a standard on-chip temperature
sensing element. As a result, the performance
of the new generation of temperature and humidity
sensors has greatly improved or even exceeded
that of the previous ones with more stability in
harsh environments.
Each sensor is calibrated and tested, with product
batch number printed on the surface of the product.
Due to the improvement and miniaturization of the
sensor, its cost-effective ratio is higher, and
finally all equipment will benefit from the cutting-
edge energy-saving operation mode.
Application Scope
HVAC system, dehumidifier, test and inspection equipment, consumer goods, automobiles, automatic control,
data recorder, weather station, household appliances, humidity regulation, medical and other related
temperature and humidity detection and control.
Figure 1: AHT10 Sensor Package Diagram (Unit: mm Tolerance: 0.1 mm)
2
• Digital output, I C interface
• Excellent long-term stability
• SMD package suitable for reflow soldering
• Quick response and strong anti-jamming capability
Product Overview
1
/1 0
0.8
0.8
4.0
5.0
1.27
1.0
AHT10
1.6
2.7
ASAIR
XXXXXX
®
1
2
3 4
5
6
ADR
SDA
SCL
NC
GND
VDD
ASAIR®
www.aosong.com Guangzhou Aosong Electronics Co.,Ltd. Tel:400-630-5378 Versior:V1.1

Sensor Performance
Relative Humidity
Parameter
Condition Min Typical Max
Unit
resolution ratio
1
accuracy error
Repeatability
Hysteresis
Nonlinear
2
Response time
Scope of work
4
Long time drift
Typical
Typical
Max
0.024
±2
See Figure 2
±0.1
±1
t 63% 8
%RH
%RH
%RH
%RH
%RH
%RH
S
%RH
%RH/yr
<0.1
100
0
3
extended
Normal
<0.5
Temperature
Parameter
Condition Min Typical Max
Unit
resolution ratio
1
accuracy error
Repeatability
Hysteresis
6
Response time
Scope of work
Long time drift
0.01
±0.3
±0.1
±0.1
t 63% 5
℃
℃/y r
85
-40
3
extended
<0.04
30
℃
℃
℃
℃
℃
S
-40 -20 0 20 40 60 80
±0.0
±0.5
±1.0
±1.5
±2.0
Figure 3 Typical error and maximum error of temperature
Temperature(℃)
0 10 20 30 40 50 60 70 80 90 100
±0
±2
±4
±6
±8
±10
Figure 2 The maximum error of relative humidity at 25°C
△RH(%RH) △T℃
Max Value
Typical Value
Relative Humidity(% RH)
Voltage
Power
5
consumption
Communication
Typical
Dormant
Measure
3.3
0.25
Electric Specification
5
Current, IDD
1.8 3.6
23
Dormant
Measure
Average
2
Two-line digital interface, standard I C protocol
0.07
3.3
0.9
V
µA
µW
mW
µW
-
-
--
Table 2. Electric Specification
Sensor Model
Package Quantity
AHT10 4000PCS/Roll
Tape package
Package Information
1 This precision is the test precision of the sensor with 3.3V voltage at 25℃ excluding
hysteresis and nonlinearity, and only suitable for non-condensation conditions.
2 The time required to reach 63% of the first-order response under the conditions of 25℃
and 1 m/s air flow.
3 Normal working scope: 0 - 80% RH. Sensor reading will be deviated if beyond this
range, (drift < 3% RH after 200 hours at 90% RH humidity). The working scope is further
limited to - 40– 80℃.
4
If the sensor is surrounded by volatile solvents, irritating tapes, adhesives and
packaging materials, the reading may be higher. For more information, please
refer to the relevant documents.
5 The minimum and maximum of supply current and power consumption are based
on the conditions of VDD = 3.3 V and T < 60 ℃. The average value is value measured
every two seconds.
6 The response time depends on the thermal conductivity of the sensor substrate.
ASAIR®
2
/1 0
Table 1 Humidity Characteristic
Table 3 Temperature Characteristic
Table 4 Package
µA
Typical
Typical
Max See Figure 3
Typical Value
Max Value
Parameter
Condition Min Typical Max
Unit
www.aosong.com Guangzhou Aosong Electronics Co.,Ltd. Tel:400-630-5378 Versior:V1.1
AHT10 Technical Manual

150
120
90
60
30
0 20 30 40 50 60
70
2 .1 2 .3 2 .5 2 . 7 2 .9 3 . 1 3 .3 3 . 5
Voltage
(V D D )
1 Expansion of performance
100
80
60
40
20
0
Figure 4 Working Conditions Temperature (℃)
0 5 10 1 5 2 0 2 5 3 0 3 5 4 0 4 5 5 0 5 5 6 0 6 5 7 0 7 5 8 0
Temperature (℃)
Figure 5 Maximum humidity error between 0~80 °C, unit: (% RH)
Relative Humidity (%RH) Normal Range
Maximum range
Normal Range
100
±8
10
0
±6±5±7
±5
±4
±5
2 0
3 0
4 0
5 0
6 0
7 0
±6±4
±3
±3±3
±4
8 0
±4
9 0
±7±5
±5
±5±6
Current
(nA)
Current
IDD(nA)
AHT10 User Guide
ASAIR®
3
/1 0
Temperature
(℃)
Note: Above errors are the tested maximum errors (excluding
hysteresis) with the high precision dew-point instrument as
reference instrument. The typical error is± 2 % RH with the
range of maximum error. In other scopes, the typical value
is 1/2 of the maximum error.
The RH accuracy at 25℃ is defined in Fig. 2, and
the maximum humidity error at other temperatures
is shown in Fig. 5.
-40 -20 0 20 40 60 80 100
1.1 Working Conditions
1.2 RH Accuracy at Different Temperatures
1. 3 Electric Specification
The sensor performance is stable in the suggested
working scope, as shown in Figure 4. Long-term
exposure to abnormal scope, especially when
humidity > 80%, may lead to temporary signal drift
(drift + 3% RH after 60 hours). When the sensor is
restored to normal working conditions, it will slowly
restore itself to the correct state. Refer to Recovery
Processing in Section 2.3 to speed up the recovery
process. Long-term use under abnormal conditions
will accelerate the aging of products.
40
50
60
70
80
90
100
110
The power consumption given in Table 1 is related to
temperature and supply voltage VDD. Estimated power
consumption, see Figures 6 and 7. Note that the curves
in Figures 6 and 7 are typical natural characteristics and
may have deviations
Figure 6 When VDD = 3.3V, the typical relationship between
supply current and temperature (dormancy mode). Please
note that there is a deviation of about ± 25% with the display
value.
Figure 7 shows the typical relationship between supply
current and voltage (dormancy mode) at 25 ℃. Please
be noted that the deviation between these data and the
display value may reach ± 50 % of the display value. At 60 ℃,
the coefficient is about 15. (Compared with Table 2).
www.aosong.com Guangzhou Aosong Electronics Co.,Ltd. Tel:400-630-5378 Versior:V1.1
AHT10 Technical Manual

T
PtP
T
LtL
T
S(max)
Preheating zone
Time
Temperature
2 Application Information
The I/O pads of SMD are made of copper pin
frame planar substrates, which are exposed
to the outside for mechanical and electrical
connections. When used, I / O pads and bare
pads need to be welded on PCB. In order to
prevent oxidation and optimize welding, the
welding joints at the bottom of the sensor are
plated with Ni/Au.
On PCB, the length of I/O contact surface
should be 0.2 mm longer than that of the I/O
package pad of AHT 10. The inner part should
match the shape of the I/O package pad. The
ratio of pin width to SMD package pad width
is 1:1. See figure 8.
For screen and solder layer design 8, it is
suggested to use copper foil definition solder
(SMD) with the solder layer opening larger
than the metal solder plate.
For SMD pads, if the gap between the copper
foil pad and the soldering layer is 60 m-75 m,
the opening size of the soldering layer shall be
greater than the size of the soldering plate
(120 m-150 m).
The circular part of the sealing pad shall match
the corresponding circular solder layer opening
to ensure that there is enough solder layer area
(especially at the corner) to prevent solder from
joining.
Each pad shall have its own soldering layer
opening, forming a soldering layer network
around the adjacent pads.
Figure 8. Recommended design size of AHT10 PCB (mm) and
the outer part with dotted line is the outer dimension of SMD
package.
For solder printing, laser cutting stainless steel
mesh with electronic polishing trapezoidal wall
is recommended, with recommended thickness
of 0. 125 mm. The steel mesh size of the pad
should be 0.1 mm longer than PCB pad and placed
0.1 mm away from the packaging center. Steel
mesh with bare pads must cover 70% - 90% of the
pad area - that is, the central position of the heat
dissipation area reaches 1. 4 mm x 2. 3 mm.
Due to the low SMD mounting, it is recommended
to use no-cleaning type 3 solders tin 9 and to
purify it with nitrogen during reflux.
ASAIR®
4
/1 0
2.1 Welding Specification
www.aosong.com Guangzhou Aosong Electronics Co.,Ltd. Tel:400-630-5378 Versior:V1.1
7Contact surface refers to the metal layer on PCB where SMD pads are welded.
8The solder mask layer refers to the insulating layer covering the connecting
line at the top of the PCB.
Figure 9 JEDEC Standard welding procedure diagram.
Tp<= 260℃, tp< 30 sec, lead-free welding.TL< 220℃,
tl< 150 sec,The rate of temperature rise and fall
during welding shall be < 5℃/ sec.
Critical zone
AHT 10 can be welded through standard reflow
furnace. The sensor fully meets the
IPC/JEDEC J-STD-020D welding standard. The
contact time should be less than 40 seconds at the
highest 260℃ (see Fig. 9) and the ultimate welding
temperature that the sensor can withstand is 260℃.。
Note: After reflow welding, the sensor should be
stored in the environment of > 75% RH for at least
12 hours to ensure the re-hydration of the polymer.
Otherwise, it will cause sensor reading drift. The
sensor can also be placed in a natural environment
(> 40% RH) for more than five days to re-hydrate.
Hydration time can be reduced by using low
temperature reflow welding (e.g.180℃).
Don't wash the circuit boards is allowed after
welding. Therefore, it is suggested that customers
use "wash-free" solder paste. If the sensor is
applied to corrosive gases, condensate water may
be produced (e.g. in high humidity environment),
both pin pads and PCB need to be sealed
(e.g. using conformal coating) to avoid poor contact
or short circuit.
2.2 Storage conditions and instructions
The humidity sensitivity level (MSL) is 1, according
to IPC/JEDEC J-STD-020 standard. Therefore, it is
recommended to use it within one year after delivery.
Humidity sensor is not an ordinary electronic
component, and it needs careful protection, which
users must pay attention to. Long-term exposure
to high concentration of chemical vapor will cause
the sensor reading to drift.
9The type of solder is related to the size of particles in solder. Type 3 powder
in size range of 25-45 µ m.
AHT10 Technical Manual

Moreover, when the measurement frequency is too
high, the temperature of the sensor itself will rise,
which will affect the measurement accuracy. In order
to make its temperature rise below 0.1℃, the
activation time of AHT10 should not exceed 10% of
the measurement time - it is recommended to
measure data every 2 seconds.
2.5Material used for sealing and encapsulation
Many materials absorb moisture and act as buffer,
which will increase response time and hysteresis.
Therefore, the material around the sensor should be
carefully selected. Recommended materials are:
metal materials, LCP, POM (Delrin), PTFE (Teflon),
PE, PEEK, PP, PB, PPS, PSU, PVDF, and PVF.
Material for sealing and bonding (conservative
recommendation): It is recommended to use method
of filling epoxy resin or silicone resin for packaging
electronic components. Gases released from these
materials may also contaminate AHT10 (see 2.2).
Therefore, the sensor should be finally assembled
and placed in a well-ventilated place, or dried for
24 hours in an environment of > 50℃, in order to
release the contaminated gas before packaging.
2.6Wiring rules and signal integrity
If SCL and SDA signal lines are parallel and very
close to each other, they may cause signal crosstalk
and communication failure. The solution is to place
VDD and/or GND between the two signal lines,
separate the signal lines and use shielded cables. In
addition, reducing SCL frequency may also improve
the integrity of signal transmission. A 100 nF
decoupling capacitor must be added between the
power supply pin (VDD, GND) for smoothing. This
capacitor should be as close to the sensor as possible.
See the next chapter.
ASAIR®
5
/1 0
www.aosong.com Guangzhou Aosong Electronics Co.,Ltd. Tel:400-630-5378 Versior:V1.1
Therefore, it is recommended that the sensor be
stored in the original package including sealed
ESD bag, and meet the following conditions:
temperature range 10℃- 50℃(0 - 85℃ in a limited
time), humidity 20 - 60% RH (no ESD packaged
sensor). For sensors that have been removed
from the original package, we recommend that
they be stored in antistatic bags made of metal
PET / AL / CPE.
During production and transportation, sensors
should avoid exposure to high concentration of
chemical solvents and prolonged exposure.
Avoid exposure to volatile glue, adhesive tape,
stickers or volatile packaging materials, such
as foamed foil, foam material, etc. The production
area should be well ventilated.
2.3 Recovery processing
As mentioned above, if the sensor is exposed to
extreme working conditions or chemical vapor,
the reading will drift. It can be restored to the
calibration state by processing as follows.
Drying: Keep for 10 hours at 80 - 85℃ with the
humidity of more than 75 % RH.
Rehydration: Keep for 12 hours at 20 - 30℃with
the humidity of more than 75 % RH.10
2.4 Temperature Influence
The relative humidity of gases depends largely
on temperature. Therefore, when measuring
humidity, all sensors measuring the same humidity
should work at the same temperature as possible.
When testing, it is necessary to ensure that the
tested sensors and reference sensors are at the
same temperature, and then compare the humidity
readings.
If the sensor and the heating-prone electronic
components are placed on the same printing
circuit board, measures should be taken to
minimize the effect of heat transfer as far as
possible in the design of the circuit.
For example, to maintain good ventilation of the
shell, the copper coating of AHT10 and other
parts of the printed circuit board should be as
smallest as possible, or leave a gap between
them. (See Fig. 10)
Figure 10 AHT10 top view of printing circuit board. The design of
milling slit can minimize heat transfer.
1075 % RHIt can be easily generated from saturated Na Cl.
AHT10 Technical Manual

Table 5 AHT10 Distribution of pins(Top View)
4 Electric Specification
4.1 Absolute Maximum Rating
Parameters Min Max Unit
-0.3
3.6 V
-0.3 VDD +0.3
V
Input current for each pin
-10 10 mA
Table 6 Absolute maximum electric rating
Parameter Condition Min TypicalMax Unit
VDD = 3.3 V,
-4 mA < IOL <
0mA
0 -
0.4
V
70% VDD
-
VDD
V
- -
-4
mA
0 -
30%
VDD
V
70% VDD
-
VDD
V
Input current
VDD = 3.6 V,
VIN = 0 V to 3.6 V
- -
±1
uA
Pin Name Definition
1
ADR
Connect Power ground
2
SDA
Serial data, bidirectional
3
SCL
Serial clock
4
VDD
Power supply voltage
5
GND
Power ground
6 NC
Remain suspended
3 Interface Definition
AHT10
ADR
SDA
SCL
NC
GND
VDD VDD 1.8~3.6V
VDD 1.8~3.6V
0.1uf
MCU
(Master)
SDA
SCL
RPRP
a high level.The pull-up resistance may have
been included in the MCU's I/O circuit. Detailed
information about sensor input/output
characteristics can be obtained by referring to
tables 7 and 8.
The electric specifications of AHT10 are defined
in Table 1. The absolute maximum ratings given in
Table 6 are only stress ratings and to provide more
information. Under such conditions, it is not
advisable for the device to perform functional
operation. Exposure to absolute maximum rating
for a long time may affect the reliability of the
sensor.
ASAIR®
6
/1 0
1
2
3 4
5
6
ADR
SDA
SCL
NC
GND
VDD
www.aosong.com Guangzhou Aosong Electronics Co.,Ltd. Tel:400-630-5378 Versior:V1.1
3.1 Power Pins (VDD,GND)
The power supply range of AHT10 is 1.8-3.6V,
and the recommended voltage is 3.3V. A 100nF
decoupling capacitor should be connected
between the power supply (VDD) and the ground
(GND) and the capacitor should be located as
close as possible to the sensor - Reference to
Fig. 11
3.2 Serial clock SCL
SCL is used to synchronize the communication
between microprocessor and AHT10. Because
the interface contains complete static logic,
there is no minimum SCL frequency.
3.3 Serial data SDA
SDA pins are used for data input and output of
sensors. When sending commands to sensors,
SDA is valid at the rising edge of serial clock
(SCL), and SDA must remain stable when SCL
is high level. After the descending edge of SCL,
the SDA value can be changed. To ensure
communication safety, the effective time of SDA
should be extended to TSU and THO respectively
before SCL rising edge and after SCL falling
edge - refer to Fig. 12. When the data is read
from the sensor, SDA is valid (TV) after the SCL
decreases and maintains the descent edge of the
next SCL.
Figure 11 Typical application circuits including pull-up resistance RP and
decoupling capacitance between VDD and GND.
Note:
1. The supply voltage of MCU of main engine must be the same as that of
the sensor when the product is used in the circuit.
2. If the reliability of the system needs to be further improved, the power
supply of the sensor can be controlled.
2 2
3. I C bus can only connect a single AHT10, and cannot connect other I C
devices.
To avoid signal collision, MCU must only drive
SDA and SCL at low levels.An external pull-up
resistor (e.g. 10kΩ) is needed to lift the signal to
Digital I/O pin
(SDA, SCL) to GND
ESD electrostatic discharge conforms to JEDEC
JESD22-A114 standard (human body mode ±4kV)
and JEDEC JESD22-A115 (machine mode±200V).
If the test condition exceeds the nominal limit, the
sensor needs additional protection circuit.
4.2 Input/output characteristics
Electric specifications include power consumption,
high and low voltage of input and output, voltage of
power supply. In order to make the sensor
communication smooth, it is important to ensure
that the signal design is strictly limited to the range
given in tables 7, 8 and 12.
Output low
voltage VOL
Output high
voltage VOH
Table 7 Direct current characteristics of DIO pads, if without special declaration,
VDD = 1.8V to 3.6V, T = -40 °C to 85 °C.
AHT10 Technical Manual
VDD to GND
Output sink
current IOL
Input low
voltage VIL
Input high
voltage VIH

SCL
70%
30%
SDA
70%
30%
t
Parameter Mark
2
I C Typical Mode 2
I C High speed mode Unit
MIN MAX MIN MAX
I2Cclock frequency fSCL 0 100 0 400 KHz
Initial signal time tHDST
Aμs
tHIGH 4.7 1.3 μs
tLOW 4.0 0.6 μs
tHDDA
T0.09 3.45 0.02 0.9 μs
tSUDA
T250 100 μs
5.3 Send Command
SCL
70%
30%
SDA
70%
30%
ASAIR®
7
/1 0
www.aosong.com Guangzhou Aosong Electronics Co.,Ltd. Tel:400-630-5378 Versior:V1.1
Figure 12.The sequence diagrams and abbreviations of digital input/output
are explained in Table 8. Thicker SDA lines are controlled by sensors, and
ordinary SDA lines are controlled by single chip computer. Please be noted
that the effective read time of SDA is triggered by the drop edge of the
previous conversion
SCL Clock High
Level Width
Note: Both pins are measured from 0.2 VDD and 0.8 VDD.
2
Note: The above I C time serial is determined by the following
internal delays:
(1) The internal SDI input pins are delayed relative to SCK pins with a typical value
of 100ns.
(2) The internal SDI output pin is delayed relative to SCK failing edge with a typical
value of 200 ns.
SCL Clock Low
Level Width
Data save time
relative to SCL
SDA edge
Data Setting
Time Relative to
SCL SDA Edge
2
Table 8. I C Sequence Characteristics of Digital Input/output in fast Mode.
The specific meaning is shown in Figure 12. Unless otherwise indicated
2
AHT10 adopts standard I C protocol to
2
communicate. For information on the I C
protocol except the following chapters,
please refer to the following website:
www.aosong.com for sample reference。
5.1 Start Sensor
Step 1: Make the sensor power on with selected
voltage of VDD power supply voltage (ranging
from 1.8 V to 3.6 V). When the sensor is powered
on, it takes 20 milliseconds at most (the SCL is
high level) to enter idle state, that is, to be ready
to receive commands sent by MCU.
5.2 Timing sequence of start/stop
Each transport sequence starts with the Start
state and ends with the Stop state, as shown in
Figures 13 and 14.
Figure 13 Start Transmit State (S) - When SCL is at high level, SDA is
converted from high level to low level. The start state is a special bus state
controlled by the main engine, indicating the start of slave machinetransit
(after Start, BUS is generally considered to be in a busy state).
Figure 14 Stop Transmit State (P) - When the SCL is at high level, the SDA
line is converted from low level to high level. Stop state is a special bus state
controlled by the main engine, indicating the end of slave machine transmit
(after Stop, BUS is generally considered to be in idle state).
2
After transmit is started,the I C first byte of the
2
transmitted afterwards includes a 7-bit I C
device address 0x38 and an SDA direction bit
(read as R:'1' and written as W:'0'). After the
8th SCL clock falling edge, it is indicated that
the sensor data is received normally by lowering
the SDA pin (ACK bit). After issuing the
initialization command, ('1110'0001' refers to
initialization, and '1010'1100' refers to
temperature and humidity measurement), the
MCU must wait for the measurement to be
completed. The basic commands are summarized
in Table 9 and the status bits returned from the
machine is illustrated in Table 10.
AHT10 Technical Manual
5 Sensor Communication

ASAIR®
8
/1 0
S 1 0 0 0 0 0 0 0
ACK
1 0 1 1 1 0 1 0
ACK
P
I
2
C address +write Soft Reset
6 Signal Transformation
6.1 Relative humidity transformation
6.2 Temperature transformation
7 Environmental stability
8 Package
Command Definition Code
Initialization Keep main engine
1110’0001
Trigger Measurement
1010’1100
Soft reset
1011’1010
Table 9 Basic Commands
Bit Definition
Bit[7] (Busyindication) 1-- Busy in measurement
0-- Free in dormant state
Bit [6:5] (ModeStatus)
00 in NOR mode
01 in CYC mode
1x in CMD mode
Bit [3]
5.4 Soft Reset
S0 1 110 0 0 0
ACK
1 0 1 0 1 1 0 0
ACK
I
2
C address +write
S01 1 1 0 0 0 1
ACK
ACK
I
2
C address +read
State
x x x x x x x x
ACK
x x x x x x x x
ACK
humidity data
x x x x x x x x
ACK
x x x x x x x x
ACK
x x x x x x x x
ACK
P
Remained
Bit [2:0]
Bit [4]
CAL Enable
1--calibrated
0--uncalibrated
0011001 1
ACK
00000 0 0 0
ACK
P
DATA0 DATA1
x x x x x x x x
Note: The sensor takes time to collect data. After the host sends out the
measurement command (0 x AC), it delays more than 75 milliseconds to read
the converted data and judge whether the returned status bits are normal. If
the state bit [Bit 7] is 0, the data can be read normally, and 1 represents that
the sensor is busy, the host needs to wait for data processing to complete.
Remained
Host to slave Slave to host ACK Start
S
Stop
P
ACK
www.aosong.com Guangzhou Aosong Electronics Co.,Ltd. Tel:400-630-5378 Versior:V1.1
Keep main engine
Description
Remained Remained
Table 10. State bit description.
Trigger measurement data
Read temperature and humidity data
Trigger measurement 0xAC
humidity data
humidity temperature temperature data
temperature data
This command (see Table 9) is used to restart the
sensor system without having to turn off and turn
on the power again. After receiving this command,
the sensor system starts to reinitialize and restore
the default settings. Soft reset takes no more than
20 milliseconds.
Figure 17. Soft Reset– The grey part is controlled by AHT10.
Relative humidity RH can be calculated according
to the relative humidity signal SRH output from
SDA by the following equation.
(The result is expressed in% RH)
Temperature T can be calculated by substituting
the temperature output signal ST into the following
formula.(The results are expressed as
temperature°C):
If the sensor is used in equipment or machinery,
please make sure that it is the same temperature
and humidity that the sensor used for measurement
and the sensor used for reference that have sensed.
If the sensor is placed in the equipment, the
reaction time will be prolonged, so it is necessary
to ensure that sufficient measurement time is
reserved in the programming. The AHT10 sensor
is tested according to the enterprise standard of
Aosong temperature and humidity sensor. The
performance of sensors under other test conditions
is not guaranteed and cannot be regarded as a part
of sensor performance. Especially for the specific
occasions required by users, we do not make any
commitments.
AHT10 provides SMD packaging (similar to QFN),
which represents a bilateral flat and pin-free
package. The sensor chip is made of a copper lead
frame coated with Ni/Au. The weight of the sensor
is about 63 mg.
AHT10 Technical Manual

9
/1 0
www.aosong.com Guangzhou Aosong Electronics Co.,Ltd. Tel:400-630-5378 Versior:V1.1
8.1 Trace Information
Figure 18 sensor laser label
Figure 19 : Label on the tape
8.2 Transport Package
Figure 20 Package tape and sensor location diagram
A label is also attached to the tape, as shown in Figure
19, and other trace information is provided.
ASAIR®
ASAIR
®
Name: Temperature and humidity sensor
Date:YYYY-MM-DD
5 0 1 8 1 2 1 0
Batch:XXXXXX
AHT10
ASAIR
XXXXXX
®
Qty:4000PCS
Model: AHT10
All AHT10 sensors have laser labels on their surfaces.
See Figure 18.
AHT10 is packed in coiled tape and sealed in antistatic
ESD bags. The standard packing size is 4000 pieces
per roll. For AHT10 packaging, the last 440 mm (55
sensor capacity) and first 200 mm (25 sensor capacity)
of each roll are empty packaging.
The package diagram with sensor positioning is
shown in Figure 20. The reel is placed in the
antistatic pocket.
Unit
AHT10 Technical Manual

10
/10
www.aosong.com Guangzhou Aosong Electronics Co.,Ltd. Tel:400-630-5378 Versior:V1.1
Version
Date Version Page Alteration
Initial Version
This manual is likely to change sometime without prior notice.
Attention
Warning of personal injury
ESD Protection
If the Buyer intends to purchase or use the Aosong
products without any application license and
authorization, the buyer shall bear all compensation
for personal injury and death resulting therefrom, and
shall not claim for compensation including various
costs, compensation fees, lawyers, etc. Expenses and
so on with the managers and employees of Aosong
Company, as well as subsidiaries, agents, distributors,
etc.
ASAIR®
2018/11
2018/12 V1.1
V1.0
1-10
1-10
Newly added protocol description and instruction parameters.
Do not apply this product to safety protection devices
or emergency stop equipment, as well as any other
applications that may cause personal injury due to
the failure of the product. This product cannot be
used unless there is a special purpose or with an
authorization to use it. Please refer to the product
data sheet and Application guide before installing,
processing, using or maintaining the product. Failure
to comply with this recommendation may result in
death and serious bodily injury.
Due to the inherent component design, it is sensitive
to static electricity. In order to prevent the damage
and the reduction of the product's performance caused
by static electricity, the necessary anti-static measures
should be taken when applying this product.
Quality Assurance
Our company provides 12-month (1-year) quality
assurance for buyers of its products (calculated from the
date of delivery) based on the technical specifications in
the data manual of the product published by Aosong. If
the product is found to be defective under warranty, our
company will provide free maintenance or replacement.
Users need to satisfy the following conditions:
● Notify our company in writing within 14 days after the
defect is found
● The defect of this product will help to find out the
deficiency in design, material and technology of our
product.
● The product should be sent back to our company at
the buyer's expense.
● The product should be under warranty.
Our company is only responsible for the defective products
which are used in the occasions that meet the technical
requirements of the product. Our company makes no
warranties or written representations regarding the use of
its products in special application occasions.
At the same time, the company does not make any
commitment to the reliability of the products applied to
products or circuits.
©
Copyright 2018 , ASAIR® .
AHT10 Technical Manual
Other manuals for AHT10
1
Table of contents
Other ASAIR Measuring Instrument manuals