manuals.online logo
Brands
  1. Home
  2. •
  3. Brands
  4. •
  5. Casio
  6. •
  7. Calculator
  8. •
  9. Casio ALGEBRA FX User manual

Casio ALGEBRA FX User manual

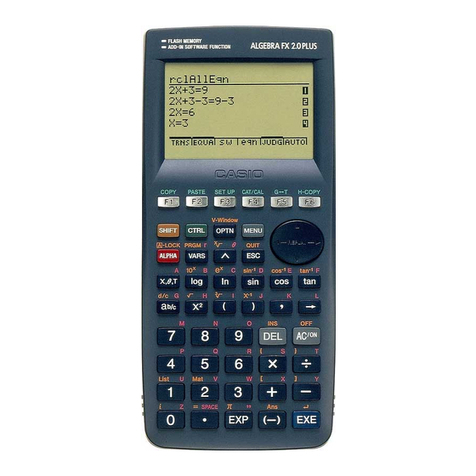
ALGEBRA FX 2.0 PLUS
FX 1.0 PLUS
User’s Guide 2
(
Additional Functions
)
Ehttp://world.casio.com/edu_e/
CASIO ELECTRONICS CO., LTD.
Unit 6, 1000 North Circular Road,
London NW2 7JD, U.K.
Important!
Please keep your manual and all information handy for
future reference.
20010101
•••••••••••••••••••
•••••••••••••••••••
•••••••••••••••••••
•••••••••••••••••••
•••••••••••••••••••
•••••••••••••••••••
•••••••••••••••••••
•••••••••••••••••••
•••••••••••••••••••
•••••••••••••••••••
•••••••••••••••••••
•••••••••••••••••••
•••••••••••••••••••
•••••••••••••••••••
•••••••••••••••••••
•••••••••••••••••••
•••••••••••••••••••
•••••••••••••••••••
ALGEBRA FX 2.0 PLUS
FX 1.0
PLUS
(Additional Functions)
20010101
Contents
Chapter 1 Advanced Statistics Application
1-1 Advanced Statistics (STAT) .............................................................. 1-1-1
1-2 Tests (TEST) .................................................................................... 1-2-1
1-3 Confidence Interval (INTR)............................................................... 1-3-1
1-4 Distribution (DIST) ............................................................................ 1-4-1
Chapter 2 Financial Calculation (TVM)
2-1 Before Performing Financial Calculations ........................................ 2-1-1
2-2 Simple Interest ................................................................................. 2-2-1
2-3 Compound Interest ........................................................................... 2-3-1
2-4 Cash Flow (Investment Appraisal) .................................................... 2-4-1
2-5 Amortization ..................................................................................... 2-5-1
2-6 Interest Rate Conversion.................................................................. 2-6-1
2-7 Cost, Selling Price, Margin ............................................................... 2-7-1
2-8 Day/Date Calculations ...................................................................... 2-8-1
2-9 Depreciation ..................................................................................... 2-9-1
2-10 Bonds ............................................................................................. 2-10-1
2-11 TVM Graph ..................................................................................... 2-11-1
Chapter 3 Differential Equations
3-1 Using the DIFF EQ Mode ................................................................. 3-1-1
3-2 Differential Equations of the First Order ........................................... 3-2-1
3-3 Linear Differential Equations of the Second Order ........................... 3-3-1
3-4 Differential Equations of the Nth Order ............................................ 3-4-1
3-5 System of First Order Differential Equations .................................... 3-5-1
Chapter 4 E-CON
4-1 E-CON Overview .............................................................................. 4-1-1
4-2 EA-100 Setup ................................................................................... 4-2-1
4-3 Setup Memory .................................................................................. 4-3-1
4-4 Program Converter ........................................................................... 4-4-1
4-5 Starting a Sampling Operation ......................................................... 4-5-1
Index
1
Contents
20010101
Advanced Statistics Application
1-1 Advanced Statistics (STAT)
1-2 Tests (TEST)
1-3 Confidence Interval (INTR)
1-4 Distribution (DIST)
1
Chapter
20010101
1-1 Advanced Statistics (STAT)
uu
uu
uFunction Menu
The following shows the function menus for the STAT Mode list input screen.
Pressing a function key that corresponds to the added item displays a menu that lets you
select one of the functions listed below.
•3(TEST) ... Test (page1-2-1)
•4(INTR) ... Confidence interval (page1-3-1)
•5(DIST) ... Distribution (page1-4-1)
SORT and JUMP functions are located in the TOOL menu (6(g)1(TOOL)).
uu
uu
uCalculation of the Coefficient of Determination (r2) and MSE
You can use the STAT Mode to calculate the coefficient of determination (r2) for quadratic
regression, cubic regression, and quartic regression. The following types of MSE
calculations are also available for each type of regression.
•Linear Regression ...
MSE =
Σ
1
n– 2i=1
n
(yi– (axi+b))2
•Quadratic Regression ...
MSE =
Σ
1
n– 3
i=1
n
(y
i
– (ax
i
+bx
i
+c))
2
2
•Cubic Regression ...
MSE =
Σ
1
n– 4i=1
n
(yi– (axi3+bxi +cxi+d ))2
2
•Quartic Regression ...
MSE =
Σ
1
n– 5
i=1
n
(y
i
– (ax
i4
+bx
i3
+cx
i
+dx
i
+e))
2
2
1-1-1
Advanced Statistics (STAT)
20010101
•Logarithmic Regression ...
MSE =
Σ
1
n– 2i=1
n
(yi– (a +b ln xi ))2
•Exponential Repression ... MSE =
Σ
1
n– 2i=1
n
(ln yi– (ln a +bxi ))2
•Power Regression ...
MSE =
Σ
1
n– 2
i=1
n
(ln y
i
– (ln a +b ln x
i
))
2
•Sin Regression ...
MSE =
Σ
1
n– 2i=1
n
(yi– (a sin (bxi +c)+d ))2
•Logistic Regression ...
MSE =
Σ
1
n– 21+ ae
-bx
i
C
i=1
n
y
i
–
2
uu
uu
uEstimated Value Calculation for Regression Graphs
The STAT Mode also includes a Y-CAL function that uses regression to calculate the
estimated y-value for a particular x-value after graphing a paired-variable statistical
regression.
The following is the general procedure for using the Y-CAL function.
1. After drawing a regression graph, press 6(g)2(Y-CAL) to enter the graph selection mode,
and then press w.
If there are multiple graphs on the display, use fand cto select the graph you want, and
then press w.
•This causes an x-value input dialog box to appear.
2. Input the value you want for xand then press w.
•This causes the coordinates for xand yto appear at the bottom of the display, and moves the
pointer to the corresponding point on the graph.
3. Pressing vor a number key at this time causes the x-value input dialog box to reappear
so you can perform another estimated value calculation if you want.
1-1-2
Advanced Statistics (STAT)
20011101
20010101
4. After you are finished, press ito clear the coordinate values and the pointer from the
display.
·The pointer does not appear if the calculated coordinates are not within the display range.
·The coordinates do not appear if [Off] is specified for the [Coord] item of the [SETUP] screen.
·The Y-CAL function can also be used with a graph drawn by using DefG feature.
uu
uu
uRegression Formula Copy Function from a Regression Calculation Result
Screen
In addition to the normal regression formula copy function that lets you copy the regression
calculation result screen after drawing a statistical graph (such as Scatter Plot), the STAT Mode
also has a function that lets you copy the regression formula obtained as the result of a regression
calculation. To copy a resulting regression formula, press 6(COPY).
kk
kk
kTests, Confidence Interval, and Distribution Calculations
The STAT Mode includes functions for performing tests, and confidence interval and distribution
calculations. You can find explanations of each of these functions in the following sections: 1-2
Tests, 1-3 Confidence Interval, and 1-4 Distribution.
uu
uu
uParameter Settings
The following describes the two methods you can use to make parameter settings for test,
confidence interval, and distribution calculations.
• Selection
With this method, you press the function key that corresponds to the setting you want to
select from the function menu.
• Value Input
With this method, you directly input the parameter value you want to input. In this case,
nothing appears in the function menu.
·Pressing ireturns to the list input screen, with the cursor in the same position it was at
before you started the parameter setting procedure.
· Pressing !i(QUIT) returns to the top of list input screen.
· Pressing wwithout pressing 1(CALC) under “Execute” item advances to calculation
execution.To return to the parameter setting screen, press i, A, or w.
1-1-3
Advanced Statistics (STAT)
20010101
uu
uu
uCommon Functions
• The symbol “■” appears in the upper right corner of the screen while execution of a
calculation is being performed and while a graph is being drawn. Pressing Aduring this
time terminates the ongoing calculation or draw operation (AC Break).
• Pressing ior wwhile a calculation result or graph is on the display returns to the
parameter setting screen. Pressing !i(QUIT) returns to the top of list input screen.
· Pressing Awhile a calculation result is on the display returns to the parameter setting screen.
• Pressing u5(G↔T) after drawing a graph switches to the parameter setting screen
(G↔T function). Pressing u5(G↔T) again returns to the graph screen.
· The G↔T function is disabled whenever you change a setting on the parameter setting screen, or
when you perform a u3(SET UP) or !K(V-Window) operation.
• You can perform the PICT menu's screen save or recall functions after drawing a graph.
· The ZOOM function and SKETCH function are disabled.
The TRACE function is disabled, except for the graph display of two-way ANOVA.
The graph screen cannot be scrolled.
• After drawing a graph, you can use a Save Result feature to save calculation results to a
specific list. Basically, all items are saved as they are displayed, except for the first line title.
·Each time you execute Save Result, any existing data in the list is replaced by the new results.
1-1-4
Advanced Statistics (STAT)
20011101
20010101
1-2 Tests (TEST)
The ZTest provides a variety of different standardization-based tests. They make it possible
to test whether or not a sample accurately represents the population when the standard
deviation of a population (such as the entire population of a country) is known from previous
tests. Ztesting is used for market research and public opinion research, that need to be
performed repeatedly.
1-Sample ZTest tests for the unknown population mean when the population standard
deviation is known.
2-Sample ZTest tests the equality of the means of two populations based on independent
samples when both population standard deviations are known.
1-Prop ZTest tests for an unknown proportion of successes.
2-Prop ZTest tests to compare the proportion of successes from two populations.
The tTest tests the hypothesis when the population standard deviation is unknown. The
hypothesis that is the opposite of the hypothesis being proven is called the
null hypothesis
,
while the hypothesis being proved is called the
alternative hypothesis
. The t-test is normally
applied to test the null hypothesis. Then a determination is made whether the null hypothesis
or alternative hypothesis will be adopted.
1-Sample tTest tests the hypothesis for a single unknown population mean when the
population standard deviation is unknown.
2-Sample tTest compares the population means when the population standard deviations
are unknown.
LinearReg tTest calculates the strength of the linear association of paired data.
χ
2Test tests hypothesis concerning the proportion of samples included in each of a number
of independent groups. Mainly, it generates cross-tabulation of two categorical variables
(such as yes, no) and evaluates the independence of these variables. It could be used, for
example, to evaluate the relationship between whether or not a driver has ever been involved
in a traffic accident and that person’s knowledge of traffic regulations.
2-Sample FTest tests the hypothesis for the ratio of sample variances. It could be used, for
example, to test the carcinogenic effects of multiple suspected factors such as tobacco use,
alcohol, vitamin deficiency, high coffee intake, inactivity, poor living habits, etc.
ANOVA tests the hypothesis that the population means of the samples are equal when there
are multiple samples. It could be used, for example, to test whether or not different
combinations of materials have an effect on the quality and life of a final product.
One-Way ANOVA is used when there is one independent variable and one dependent
variable.
Two-Way ANOVA is used when there are two independent variables and one dependent
variable.
1-2-1
Tests (TEST)
20011101
20010101
The following pages explain various statistical calculation methods based on the principles
described above. Details concerning statistical principles and terminology can be found in
any standard statistics textbook.
On the initial STAT Mode screen, press 3(TEST) to display the test menu, which contains
the following items.
•3(TEST)b(Z) ... ZTests (p. 1-2-2)
c(T) ... tTests (p. 1-2-10)
d(χ2) ... χ2Test (p. 1-2-18)
e(F) ... 2-Sample FTest (p. 1-2-20)
f(ANOVA) ... ANOVA (p. 1-2-22)
kk
kk
kZTests
uu
uu
uZTest Common Functions
You can use the following graph analysis functions after drawing a graph.
•1(Z) ... Displays zscore.
Pressing 1(Z) displays the zscore at the bottom of the display, and displays the pointer at
the corresponding location in the graph (unless the location is off the graph screen).
Tw o points are displayed in the case of a two-tail test. Use dand eto move the pointer.
Press ito clear the zscore.
•2(P) ... Displays p-value.
Pressing 2(P) displays the p-value at the bottom of the display without displaying the
pointer.
Press ito clear the p-value.
uu
uu
u1-Sample ZTest
This test is used when the population standard deviation is known to test the hypothesis. The
1-Sample ZTest is applied to the normal distribution.
Z= o–
0
σ
µ
n
o: mean of sample
µ
o: assumed population mean
σ
: population standard deviation
n: size of sample
# The following V-Window settings are used for
drawing the graph.
Xmin = –3.2, Xmax = 3.2, Xscale = 1,
Ymin = –0.1, Ymax = 0.45, Yscale = 0.1
#Executing an analysis function automatically
stores the zand p values in alpha variables Z
and P, respectively.
1-2-2
Tests (TEST)
20011101
20010101
Perform the following key operations from the statistical data list.
3(TEST)
b(Z)
b(1-Smpl)
The following shows the meaning of each item in the case of list data specification.
Data ............................ data type
µ
.................................. population mean value test conditions (“G
µ
0” specifies
two-tail test, “<
µ
0” specifies lower one-tail test, “>
µ
0”
specifies upper one-tail test.)
µ
0................................. assumed population mean
σ
.................................. population standard deviation (
σ
> 0)
List .............................. list whose contents you want to use as data (List 1 to 20)
Freq ............................. frequency (1 or List 1 to 20)
Save Res ..................... list for storage of calculation results (None or List 1 to 20)
Execute ....................... executes a calculation or draws a graph
The following shows the meaning of parameter data specification items that are different
from list data specification.
o.................................. mean of sample
n.................................. size of sample (positive integer)
After setting all the parameters, align the cursor with [Execute] and then press one of the
function keys shown below to perform the calculation or draw the graph.
•1(CALC) ... Performs the calculation.
•6(DRAW) ... Draws the graph.
1-2-3
Tests (TEST)
20011101
20010101
Calculation Result Output Example
µ
G11.4
........................
direction of test
z.................................. zscore
p.................................. p-value
o.................................. mean of sample
x
σ
n-1 ............................. sample standard deviation
(Displayed only for Data: List setting.)
n.................................. size of sample
# [Save Res] does not save the
µ
condition in
line 2.
1-2-4
Tests (TEST)
20010101
uu
uu
u2-Sample ZTest
This test is used when the standard deviations for two populations are known to test the
hypothesis. The 2-Sample ZTest is applied to the normal distribution.
Z= o
1
– o
2
σ
n
1
1
2
σ
n
2
2
2
+
o1: mean of sample 1
o2: mean of sample 2
σ
1: population standard deviation of sample 1
σ
2: population standard deviation of sample 2
n1: size of sample 1
n2: size of sample 2
Perform the following key operations from the statistical data list.
3(TEST)
b(Z)
c(2-Smpl)
The following shows the meaning of each item in the case of list data specification.
Data ............................ data type
µ
1................................. population mean value test conditions (“G
µ
2” specifies two-
tail test, “<
µ
2” specifies one-tail test where sample 1 is
smaller than sample 2, “>
µ
2” specifies one-tail test where
sample 1 is greater than sample 2.)
σ
1................................. population standard deviation of sample 1 (
σ
1> 0)
σ
2................................. population standard deviation of sample 2 (
σ
2> 0)
List(1) .......................... list whose contents you want to use as sample 1 data
(List 1 to 20)
List(2) .......................... list whose contents you want to use as sample 2 data
(List 1 to 20)
Freq(1) ........................ frequency of sample 1 (1 or List 1 to 20)
Freq(2) ........................ frequency of sample 2 (1 or List 1 to 20)
Save Res ..................... list for storage of calculation results (None or List 1 to 20)
Execute ....................... executes a calculation or draws a graph
The following shows the meaning of parameter data specification items that are different
from list data specification.
1-2-5
Tests (TEST)
20011101
20010101
o1................................. mean of sample 1
n1................................. size (positive integer) of sample 1
o2................................. mean of sample 2
n2................................. size (positive integer) of sample 2
After setting all the parameters, align the cursor with [Execute] and then press one of the
function keys shown below to perform the calculation or draw the graph.
•1(CALC) ... Performs the calculation.
•6(DRAW) ... Draws the graph.
Calculation Result Output Example
µ
1G
µ
2........................... direction of test
z................................... z score
p.................................. p-value
o1................................. mean of sample 1
o2................................. mean of sample 2
x1
σ
n-1 ............................ standard deviation of sample 1
(Displayed only for Data: List setting.)
x2
σ
n-1 ............................ standard deviation of sample 2
(Displayed only for Data: List setting.)
n1................................. size of sample 1
n2................................. size of sample 2
# [Save Res] does not save the
µ
1condition in
line 2.
1-2-6
Tests (TEST)
20010101
uu
uu
u1-Prop ZTest
This test is used to test for an unknown proportion of successes. The 1-Prop ZTest is
applied to the normal distribution.
Z= n
x
n
p
0
(1– p
0
)
– p
0
p0: expected sample proportion
n: size of sample
Perform the following key operations from the statistical data list.
3(TEST)
b(Z)
d(1-Prop)
Prop ............................ sample proportion test conditions (“Gp0” specifies two-tail
test, “< p0” specifies lower one-tail test, “> p0” specifies upper
one-tail test.)
p0................................. expected sample proportion (0 < p0< 1)
x.................................. sample value (x>0 integer)
n.................................. size of sample (positive integer)
Save Res ..................... list for storage of calculation results (None or List 1 to 20)
Execute ....................... executes a calculation or draws a graph
After setting all the parameters, align the cursor with [Execute] and then press one of the
function keys shown below to perform the calculation or draw the graph.
•1(CALC) ... Performs the calculation.
•6(DRAW) ... Draws the graph.
Calculation Result Output Example
PropG0.5 .................... direction of test
z................................... z score
p..................................p-value
ˆp .................................. estimated sample proportion
n..................................size of sample
# [Save Res] does not save the Prop condition
in line 2.
1-2-7
Tests (TEST)
20011101
20010101
uu
uu
u2-Prop ZTest
This test is used to compare the proportion of successes. The 2-Prop ZTest is applied to the
normal distribution.
Z= n
1
x
1
n
2
x
2
–
p(1– p)n
1
1
n
2
1
+
x1: data value of sample 1
x2: data value of sample 2
n1: size of sample 1
n2: size of sample 2
ˆp : estimated sample proportion
Perform the following key operation from the statistical data list.
3(TEST)
b(Z)
e(2-Prop)
p1................................. sample proportion test conditions (“Gp2” specifies two-tail
test, “< p2” specifies one-tail test where sample 1 is smaller
than sample 2, “> p2” specifies one-tail test where sample 1
is greater than sample 2.)
x1................................. data value (x1>0 integer) of sample 1
n1................................. size (positive integer) of sample 1
x2................................. data value (x2>0 integer) of sample 2
n2................................. size (positive integer) of sample 2
Save Res ..................... list for storage of calculation results (None or List 1 to 20)
Execute ....................... executes a calculation or draws a graph
After setting all the parameters, align the cursor with [Execute] and then press one of the
function keys shown below to perform the calculation or draw the graph.
•1(CALC) ... Performs the calculation.
•6(DRAW) ... Draws the graph.
Calculation Result Output Example
1-2-8
Tests (TEST)
20011101
20010101
p1>p2............................ direction of test
z.................................. zscore
p.................................. p-value
ˆp1................................. estimated proportion of sample 1
ˆp2................................. estimated proportion of sample 2
ˆp .................................. estimated sample proportion
n1................................. size of sample 1
n2................................. size of sample 2
# [Save Res] does not save the p1condition in
line 2.
1-2-9
Tests (TEST)
20010101
kk
kk
ktTests
uu
uu
utTest Common Functions
You can use the following graph analysis functions after drawing a graph.
•1(T) ... Displays tscore.
Pressing 1(T) displays the tscore at the bottom of the display, and displays the pointer at the
corresponding location in the graph (unless the location is off the graph screen).
Tw o points are displayed in the case of a two-tail test. Use dand eto move the pointer.
Press ito clear the tscore.
•2(P) ... Displays p-value.
Pressing 2(P) displays the p-value at the bottom of the display without displaying the pointer.
Press ito clear the p-value.
# The following V-Window settings are used for
drawing the graph.
Xmin = –3.2, Xmax = 3.2, Xscale = 1,
Ymin = –0.1, Ymax = 0.45, Yscale = 0.1
#Executing an analysis function automatically
stores the tand p values in alpha variables T
and P, respectively.
1-2-10
Tests (TEST)
20010101
uu
uu
u1-Sample tTest
This test uses the hypothesis test for a single unknown population mean when the population
standard deviation is unknown. The 1-Sample tT est is applied to t-distribution.
t= o–
0
µ
σ
x
n–1
n
o: mean of sample
µ
0: assumed population mean
x
σ
n-1 : sample standard deviation
n: size of sample
Perform the following key operations from the statistical data list.
3(TEST)
c(T)
b(1-Smpl)
The following shows the meaning of each item in the case of list data specification.
Data ............................ data type
µ
.................................. population mean value test conditions (“G
µ
0” specifies two-
tail test, “<
µ
0” specifies lower one-tail test, “>
µ
0” specifies
upper one-tail test.)
µ
0................................. assumed population mean
List .............................. list whose contents you want to use as data (List 1 to 20)
Freq ............................. frequency (1 or List 1 to 20)
Save Res ..................... list for storage of calculation results (None or List 1 to 20)
Execute ....................... executes a calculation or draws a graph
The following shows the meaning of parameter data specification items that are different
from list data specification.
o.................................. mean of sample
x
σ
n-1 ............................. sample standard deviation (x
σ
n-1 > 0)
n.................................. size of sample (positive integer)
After setting all the parameters, align the cursor with [Execute] and then press one of the
function keys shown below to perform the calculation or draw the graph.
• 1(CALC) ... Performs the calculation.
• 6(DRAW) ... Draws the graph.
1-2-11
Tests (TEST)
20011101

This manual suits for next models

2

Other Casio Calculator manuals

Casio ClassPad 330 User manual

Casio

Casio ClassPad 330 User manual

Casio CFX-9850G PLUS Instruction and safety manual

Casio

Casio CFX-9850G PLUS Instruction and safety manual

Casio JZ-12W User manual

Casio

Casio JZ-12W User manual

Casio FX-9860G SD User manual

Casio

Casio FX-9860G SD User manual

Casio fx-68 User manual

Casio

Casio fx-68 User manual

Casio memory-8R Y-811 User manual
Casio

Casio memory-8R Y-811 User manual

Casio CFX-9850G PLUS User manual

Casio

Casio CFX-9850G PLUS User manual

Casio FX-9750G User manual

Casio

Casio FX-9750G User manual

Casio fx-570ES User manual

Casio

Casio fx-570ES User manual

Casio fx-115ES Technical document

Casio

Casio fx-115ES Technical document

Casio FX-100B User manual

Casio

Casio FX-100B User manual

Casio SF-4400 Troubleshooting guide

Casio

Casio SF-4400 Troubleshooting guide

Casio fx-82MS User manual

Casio

Casio fx-82MS User manual

Casio FX-D400 Troubleshooting guide

Casio

Casio FX-D400 Troubleshooting guide

Casio fx-3650P II Operating instructions

Casio

Casio fx-3650P II Operating instructions

Casio Financial Consultant FC-200V User manual

Casio

Casio Financial Consultant FC-200V User manual

Casio HR-100RC User manual

Casio

Casio HR-100RC User manual

Casio DX-12S User manual

Casio

Casio DX-12S User manual

Casio CFX-9850G PLUS User manual

Casio

Casio CFX-9850G PLUS User manual

Casio fx-9750G PLUS User manual

Casio

Casio fx-9750G PLUS User manual

Casio D-120F User manual

Casio

Casio D-120F User manual

Casio FX-9750G User manual

Casio

Casio FX-9750G User manual

Casio fx-115WA User manual

Casio

Casio fx-115WA User manual

Casio fx-50F User manual

Casio

Casio fx-50F User manual

Popular Calculator manuals by other brands

Sharp EL-5100S Service manual

Sharp

Sharp EL-5100S Service manual

Canon P23-DHV G instructions

Canon

Canon P23-DHV G instructions

Olympia LCD-8510S user guide

Olympia

Olympia LCD-8510S user guide

Citizen SLD-7055 instruction manual

Citizen

Citizen SLD-7055 instruction manual

Citizen CX-126II instruction manual

Citizen

Citizen CX-126II instruction manual

HP HP-67 manual

HP

HP HP-67 manual

Sharp CS-4194H Operation manual

Sharp

Sharp CS-4194H Operation manual

Victor 1280-7 user manual

Victor

Victor 1280-7 user manual

Citizen SDC-810 II Operation instructions

Citizen

Citizen SDC-810 II Operation instructions

Citizen CT-600J instruction manual

Citizen

Citizen CT-600J instruction manual

Calculated Industries 4054 Pocket reference guide

Calculated Industries

Calculated Industries 4054 Pocket reference guide

Victoria GVA260 operating instructions

Victoria

Victoria GVA260 operating instructions

Datexx DD-832 user guide

Datexx

Datexx DD-832 user guide

Sharp EL-T100A Operation manual

Sharp

Sharp EL-T100A Operation manual

HP 39gs Resetting guide

HP

HP 39gs Resetting guide

Sharp CS-2635RH Operation manual

Sharp

Sharp CS-2635RH Operation manual

Canon TS-1200TG instructions

Canon

Canon TS-1200TG instructions

Sharp el-9950 manual

Sharp

Sharp el-9950 manual

manuals.online logo
manuals.online logoBrands
  • About & Mission
  • Contact us
  • Privacy Policy
  • Terms and Conditions

Copyright 2025 Manuals.Online. All Rights Reserved.