Funk Amateur FA-VA4 User manual

Construction and User Manual
Kit for an easy to use
ector antenna analyzer
for use in the frequency range
100 kHz to 100 MHz.
Vector Antenna Analyzer
FA-VA4

BX-240 • 1© Box 73 Amateurfunkservice GmbH 2017
Radio Amateur who build their own antenna , appreciate the value of a vector antenna analyzer. The appa-
ratu pre ented here a a kit, i characteri ed by high accuracy, mall dimen ion and ea y handling.
It allow
one port mea urement in the frequency range 100 kHz to 100 MHz with a y tem impedance of 50 Ohm .
Vector Antenna Analyzer FA -VA4
Experimenting with antennas is an essen-
tial part of the hobby for many radio ama-
teurs. Measuring SWR and determining
impedance values are inseperable. The
first can be estimated with the transmitters
SWR meter, however, better and more ac-
curate data can be obtained by using an an-
tenna analyzer. ood devices are expen-
sive with less expensive models being
somewhat less accurate.
The FA -VA4 closes this gap. It was devel-
oped by Michael Knitter, D 5MK and is
presented in [1]. This is a fully fledged
vector antenna analyzer for use in the
frequency range 100 kHz to 100 MHz
(Table 1).
Vector measurement means that in con-
trast to a scalar measurement, not only is
the SWR determined and displayed but al-
so the value of the base point impedance
along with the sign based imaginary part.
The so called SOL compensation from the
professional field is used to calibrate the
device and allows precise measurements
in different configurations.
The FA-VA4 kit consists of an SMD
mounted circuit board, the graphics dis-
play with backlighting, as well as some
mechanical components such as some
connectors, push buttons, sliding switches
and battery holder along with a fully ma-
chined and printed housing. The micropro-
cessor on the board comes pre programmed.
The requirements for construction can be
easily handled by beginners if clean work-
ing practices and adherence to the instruc-
tion manual are followed.

2 • BX-240 © Box 73 Amateurfunkservice GmbH 2017
For construction, the following tools and
equipment will be required.
– Temperature regulated 60 … 80 W sol-
dering iron with a fine (pencil) tip, 0.5 …
1 mm solder with flux,
– 100 W soldering iron with flat (chisel)
tip,
– Electronics side cutters,
– Flat nose pliers,
– Slot screwdriver,
– Cross head (Phillips) screwdriver.
– Two 1.5 V batteries type AA for power
supply.
Before mounting the board the contents of
the kit should be checked against the parts
list provided.
nMounting the board
Fig. 2 shows the layout plan with the few
components still to be soldered. hese are
to be mounted exclusively on the upper
side where the six pin mounting strip for
the programmable interface is already lo-
cated.
First of all the sliding switch S4 should be
mounted on the face of the board. It should
rest with its underside on the circuit board
with the slider able to move horizontally
able 1: echnical data
Frequency range 0.1 … 100 MHz
(1 Hz resolution)
Accuracy ≤ 2 % (f≤ 50 MHz)
Measurements Complete impedance
values
Measurement range s≤ 100,
limits* Z≤ 1000 Ohms
Input 50 Ohms, BNC
Output voltage Peak to peak = 1 V
at 50 Ohms
Power supply 2 ¥1.5 V AA batteries
Current drain 49 mA** (110 mA)
Case dimensions 137 mm ¥90 mm ¥
25 mm (L ¥W ¥H)
Weight 290 g, incl. batteries
*out of limits less accurate results
** Average value without illumination at
100 MHz and 50 Ohms load resistance, peak
value shown in brackets.
Fig. 1: View of a finished FA -VA4
in a switched off state.
Building instructions

BX-240 • 3© Box 73 Amateurfunkservice GmbH 2017
(Fig. 3). The simplest way to do this is to
make a provisional solder connection us-
ing one solder tag on the switch thus al-
lowing for correct alignment whilst heat-
ing the solder. When it is in the correct
position all the connector tags for the
switch along with the two for the housing
may be soldered.
Disp ay
An LED backlit LCD screen is used to dis-
play measured values. These components
are joined together as a single unit and re-
quire partial soldering. To do this, the dis-
play must be placed on the LED backlight
so that there is no gap. All six connections
of the two 3 pin display contacts must be
soldered to the top of the LED backlight
along with the two outside pins of the 20
pin connector strip (Figs. 6 and 7). It is
advisable to use an appropriate support
under the display when soldering to the
LED backlight unit to fix both compo-
nents in the correct position.
The protective film on the display glass
screen should be removed before assem-
bly.
To finish, the three socket assemblies are
fixed to the contact points on the underside
of the display. The upper edge of each
socket must sit flush with the back of the
Fig. 3: lider switch soldered in correct posi-
tion
Fig. 4: The three plug connectors for display
connection
Fig. 2: FA -VA4 layout plan with soldered parts

4 • BX-240 © Box 73 Amateurfunkservice GmbH 2017
display after which the whole assembly,
display and sockets, must be placed onto
the board. The thin ends of the solder tags
are pushed fully into their respective holes
taking care not to press too hard and that
the tags aren't pushed too deep into their
holes. Now all three sockets can be sol-
dered on the underside of the board. The
display is to be carefully removed while
the remaining components are mounted
and is then subsequently re-attached. The
three mounted socket assemblies are
shown in Fig. 4.
After which the three pushbuttons and
both the battery holders should be installed.
All must have the underside of their hous-
ings on the circuit board (Fig. 5). When
soldering, some form of compensating
support must be used as the socket con-
nections are higher.
The battery holders must be connected to
the correct polarity, the spring connection
is the negative pole (Fig. 5). The battery
holder solder tags are made from spring
steel, please use correspondingly robust
sidecutters to shorten them.
To finish, the BNC socket must be sol-
dered to the board, set up and aligned hor-
izontally at right angles to the boards edge.
The two earth pins should be soldered to
the underside of the board using the 100 W
soldering iron. The solder must flow well
in order to avoid cold spots while at the
same time soldering iron usage must be
kept to a minimum in order to avoid dam-
aging the insulation on the interior of the
socket through overheating.
Fig. 5: Mounted pushbuttons and battery holders

BX-240 • 5© Box 73 Amateurfunkservice GmbH 2017
Function Test
Before mounting the circuit board into its
case a brief test is required. So next first of
all, the three caps should be pushed onto
the push button switch and the now
mounted display plugged into the corre-
sponding sockets. The slider switch should
be in the off position (Fig. 8). Lastly two
1.5 V batteries should be attached, making
sure of the correct polarity, and the device
may be powered up using the slider
switch.
The display will briefly show the greetings
text, then the FA-VA4 switches to measur-
ing mode. Should the display remain blank
then all the previous soldering must be
checked and reworked if necessary. When
everything is working correctly the slider
switch should be turned off and the batter-
ies removed from their holder. The fully
built board can be seen in Fig. 9.
Assemb y into the case
First of all the four rubber feet from the
underside of the case are to be fitted, it
may help to use some flat nosed pliers to
pull on the thin rubber nipple from the in-
side while slightly twisting the foot into
place, after which the excess rubber inside
the case should be trimmed with side cut-
ters to around 2 to 3 mm so that it doesn’t
interfere when the board is screwed into
the case.
The board is now inserted, with the socket
to the front, into the case sub assembly and
loosely fixed with four M3¥4 cylinder
screws in the corners. Then the BNC sock-
et should be fixed using the supplied nut
and toothed washer after which the assem-
bly screws may be tightened.
After installation, with due diligence to
correct polarity, of the batteries, the case
cover should be put on and fixed with four
countersunk M3¥4 screws. Lastly, the
supplied label should be stuck to the un-
derside of the device.
Your FA-VA4 is ready now and can be
used in an uncalibrated measuring mode.
Fig. 6: Display with backlight; shown here the
side with the six connections
Fig. 7: View of the 20 pin display contact strip
after assembly
8: lider switch in off position

Genera Notes on Use
The FA -VA4 can be used as a measuring
device immediately after assembly, it then
operates in an uncalibrated mode and the
results displayed may be more prone to er-
ror than would be the case after correct
calibration. This mode can also be selected
later from the Setup menu, for example if
doubts arise about the validity of stored
calibration data.
The FA -VA4 is a sensitive measuring de-
vice. No RF energy must be allowed to
reach the measuring socket so as not to
destroy the input components. This could
happen if for example an antenna in the im-
mediate vicinity transmits. Likewise, static
charges should be kept as far away as pos-
sible from the measuring socket. Insulated
antenna structures must therefor be earthed
before connecting to the device for example
by shorting to earth.
Rechargeable batteries should not be
used in the FA -VA4 as no deep discharge
nor charging circuitry is available. Deep
discharge can render the rechargeable bat-
teries unuseable or even destroy them. Leak-
ing batteries can likewise severely damage
the equipment.
The FA- VA4 is optimally designed to use
1.5 V AA cells. Used cells must be re-
moved from the device.
For the longest battery life it is recom-
mended to only use the backlight when the
display cannot be read. With daylight or
outside the display doesn't usually needs
backlight illumination.
The number of measurement display cy-
cles should only be as many as are needed
to ensure a sufficient repetition rate for
the measurement in question. Both param-
eters have a considerable influence on cur-
rent consumption and therefore on battery
life expectancy, they can be changed in the
Setup menu.
BNC plugs should be carefully twisted af-
ter connecting to ensure no ‘unexpected’
incorrect measurements.
6 • BX-240 © Box 73 Amateurfunkservice GmbH 2017
Fig. 9: Completed FA- VA4 board

BX-240 • 7© Box 73 Amateurfunkservice GmbH 2017
Although the FA -VA4 has a relatively
wide range of functions, its operation is
fairly intuitive therefore the following
guide has the character of a reference
book, however the general operating in-
structions from the previous section are to
be considered in each case.
The device cannot be destroyed by incor-
rect button pressing but may display in-
correct, unexpected results. It is recom-
mended therefore that the inexperienced
user starts with data from a known mea-
sured object and then explores the antenna
analyzer step by step, testing different mea-
surement and display modes, and refer to
these instructions as necessary.
For precision measurements the subject of
calibration (SOL compensation) is impor-
tant and is covered in its own separate sec-
tion.
The antenna analyzer operates according
to the following measuring principles: an
internal oscillator generates a signal with
a defined frequency, this signal is then
passed to the test object (e. g. antenna) via
the output socket of the device. Due to the
electrical properties of the object under
test, the signal will be changed in both am-
plitude and phase. This change is evaluat-
ed to determine the impedance of the test
object. All other measured values (e. g.
SWR) are mathematically derived from
the impedance by the microprocessor.
nControls and connectors
The only connection to the analyzer is the
test socket. For operation there are three
pushbuttons and an on/off switch.
All selected parameters are saved, so that
at switching on the device will have the
same settings as when it was switched off.
The three pushbuttons have different func-
tions depending on the actual measuring
or operating mode. In most cases a func-
tion or other selection is called up with the
left hand button, the middle and right but-
tons serve to increase or decrease values
through the menulists. The current function
is displayed on the display above the but-
tons.
When in measurement mode a longer press
of the left button will call up the menu.
The middle and right buttons then allow
you to select a menu item which may then
be selected or activated using the left but-
ton. Other functions of the buttons are ex-
plained in a later paragraph.
Switching on the Ana yzer
After switching on the FA -VA4 a greetings
message will appear on the display under
which also the firmware version and to the
right of that the battery voltage. The de-
fault menu language is En lish.
Directions for use

nCalibration ( OL compensation)
Every extra plug and additional piece of
cable influences the impedance measure-
ment of the test object. This unwanted in-
fluence can be completely compensated
for by the Short Open Load method (short-
ened to SOL method).
First of all, instead of the test object, three
reference elements are measured; Short
represents a short circuit, Open, an open
cable end, and Load, a resistance in the
magnitude of the system impedance (in
our case 50 Ohms.) These reference mea-
surements can be easily obtained with ac-
ceptable accuracy using three 50 Ohms
BNC co ax plugs.
In the case of the Short element the inner
connector and the plug housing are short
circuited, for the Open element the inner
pin remains unconnected, for the Load el-
ement there is a small 50 Ohm metal film
resistor between the inner connector and
the housing. If the materials aren’t to hand
further information on the reference ele-
ments (shown in Fig.10) is available at [2].
After calibration has been completed the
calculated values are automatically stored
in the analyzer so that the correct im pe -
dance is determined when the test object
is measured.
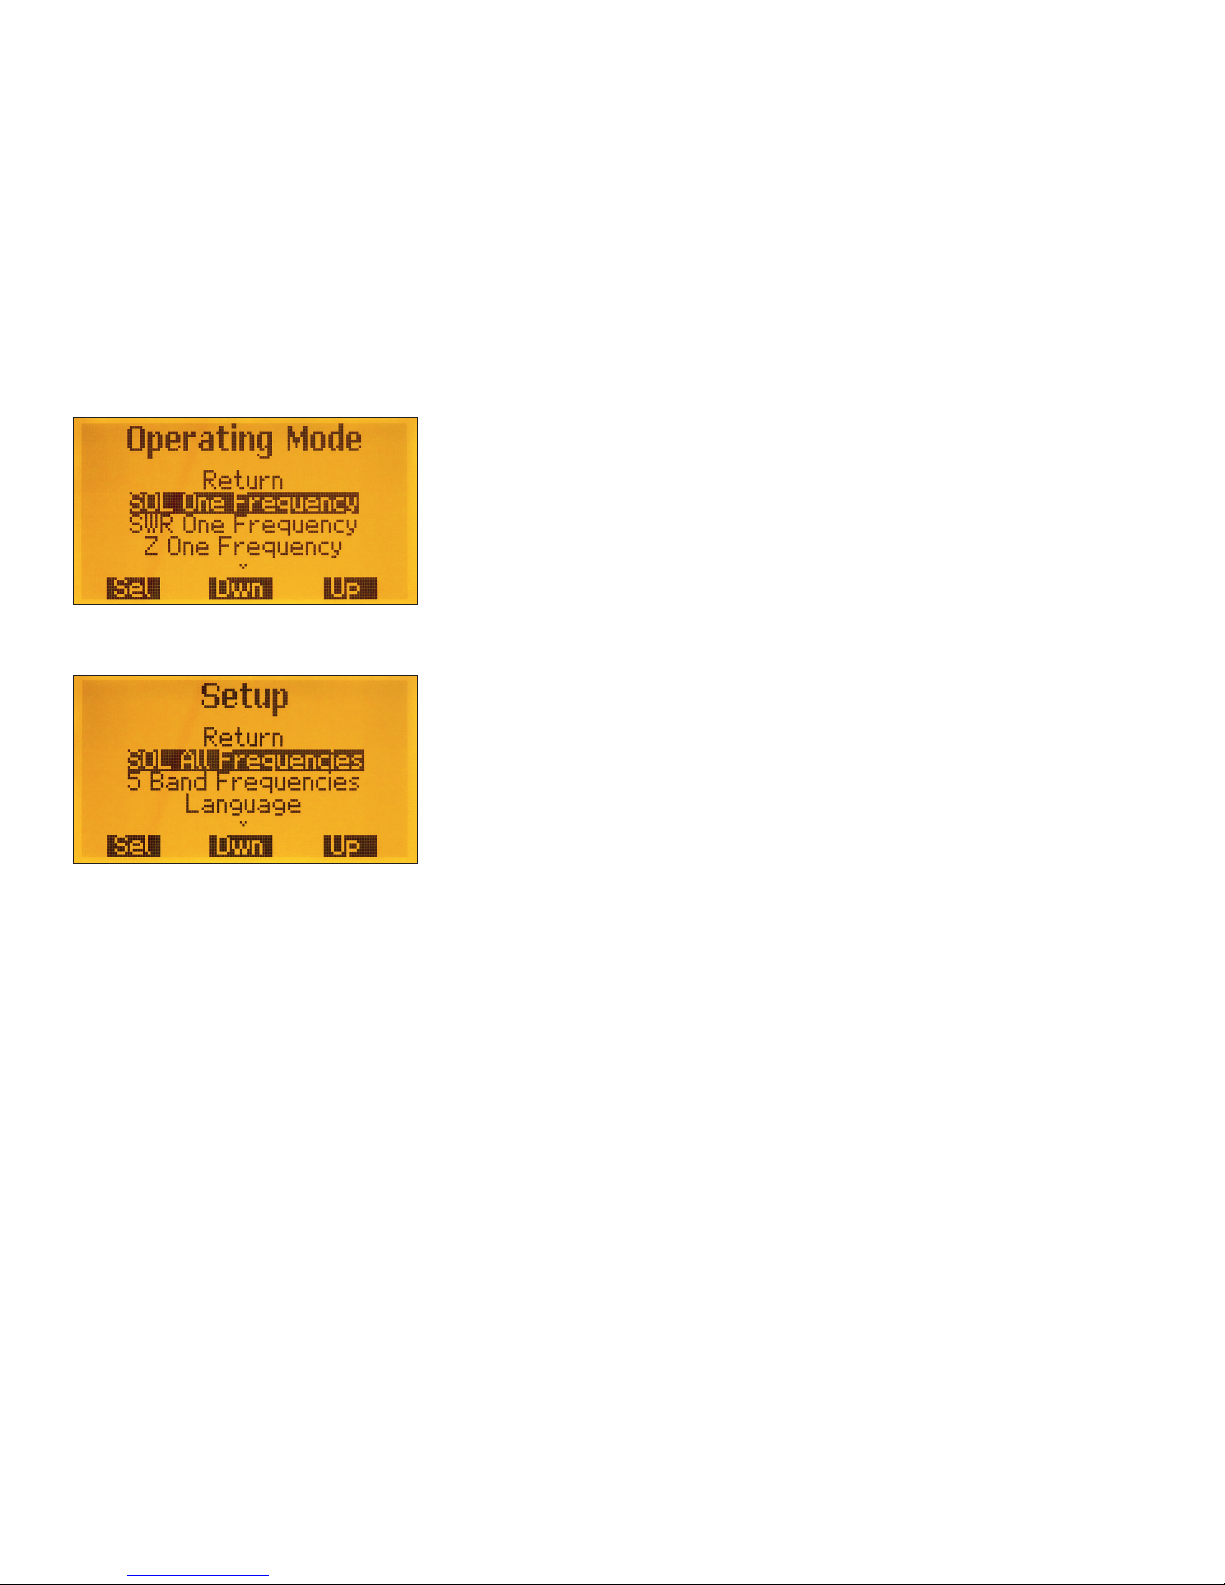
The analyzer knows two different modes
of SOL compensation.
SOL for a frequencies
It is possible to permanently save SOL ref-
erence values for the entire measuring
range. In this case, with the Short refer-
ence element connected, the analyzer runs
through the entire frequency range and
stores the determined measured values.
The same procedure is to be carried out
for connected Open and Load elements. It
is recommended to carry out this compen-
sation routine once, after commissioning,
for the built in plug, any permanently at-
tached cable or measuring device and in
between times as required. Thereafter the
measurement of a test object is possible at
any time without further compensation.
The analyzer then uses these reference
values as a standard (master compensa-
tion), in particular for multi frequency
measurements. This function can be ac-
cessed via the Operatin Mode ÆSetup
ÆSOL All Frequencies (Fig. 12).
Please note: the entire process takes sev-
eral minutes but may be cancelled, in this
case however the resulting measurements
will be inaccurate and the calibration pro-
cedure should be recommenced at the first
opportunity.
8 • BX-240 © Box 73 Amateurfunkservice GmbH 2017
Fig. 10: The optional kit for the reference
elements BX-240- OL [2] contains a 50 Ohm
termination resistor (middle) along with two
BNC co ax plugs for the Short and Open refer-
ence elements.

BX-240 • 9© Box 73 Amateurfunkservice GmbH 2017
SOL for an individua frequency
For all individual frequency measure-
ments it is possible to run through SOL
compensation for the actual frequency,
(Operatin Mode ÆSOL One Frequency,
see Fig. 11).
The procedure is the same as described
above but only applies to the currently set
frequency and therefore runs very quickly.
This makes it possible to quickly and eas-
ily compensate for temporary changes in
the measurement setup or parameters as a
result of temperature changes or other in-
terference.
For particularly high accuracy it is recom-
mended to perform such compensation be-
fore each measurement.
Important: if the measured frequency of
the analyzer is changed, the determined
SOL reference values for the current fre-
quency are indicated as invalid and the
standard values of the master compensa-
tion will be used instead for the next mea-
surement. The display shows which refer-
ence values are currently being used. For
example in Fig. 18 the master calibration is
used to measure SWR, which can be seen
as a small solM to the right of the bar on
the right hand side of the display. In case
of single frequency calibration the display
will show solf, in case of no calibration at
all it will show sol-.
Fig. 11: Menu item for OL one frequency
Fig. 12: The Master OL compensation (for
all frequencies) is started in the Setup sub -
menu.

10 • BX-240 © Box 73 Amateurfunkservice GmbH 2017
nExplanation of the menus
A long press on the left hand button will
call up the menu mode. This offers the set-
up possibilities contained in Tables 2 and
3 (Figs. 13 to 17).
nOperating mode
The operating mode makes it possible to
select the measuring and display modes
most commonly used in practice.
Sing e frequency SWR measurement
The indicators become the actual measure-
ment frequency, the standing wave
ratio (SWR), the effective impedance re-
sistance (Formula Z), the impedance reac -
tance (+j/ j), the SWR shown as a bar graph
along with the currently used reference val-
ues of the SOL compensation, (solM for
master calibration, solf for calibration on
an actual frequency, or sol- for uncalibrat-
ed operation).
able 2: Possible adjustments in the FA V-A4 operating mode
Menu item Meaning
Return Return to the previous mode
SOL One Frequency SOL compensation of the actual frequency
SWR One Frequency SWR measurement of the actual frequency
Z One Frequency Impedance measurement of the actual frequency
SWR Single Sweep Single run of SWR measurement in the specified frequency range
Z Single Sweep Single run of impedance measurement in the specified frequency range
SWR 5 Band SWR measurements of 5 frequencies (5 band measurement)
SWR Cycling Sweep Cyclic SWR measurement run
Z Cycling Sweep Cyclic run of impedance measurement
Frequency enerator RF generator mode
Captured Screens View of saved measurement results (display contents)
Setup Call up the setup menu (see Table 3.)
able 3: FA- VA4 Setup mode
Menu item Meaning
Return Return to measurement mode
SOL All Frequencies SOL compensation over entire frequency range (master calibration)
5 Band Frequencies Setting the frequency values for 5 band measurements
Language Select the menu language
Backlight Mode Settings for the backlight
Delta Frequency Calibration of the internal frequency
Display Update Cycle Setting the measurement repeat rate
Reset Reset all settings to factory default
Options in the menu Setup

BX-240 • 11© Box 73 Amateurfunkservice GmbH 2017
The actual measurement frequency can be
set using the three push buttons. The left
button (D/S) selects the decimal place in-
dicated by an underscore line. With the
middle or right hand button the values
may be increased (+) or decreased (–).
For an eventual compensation (SOL One
Frequency) the corresponding function in
the operation mode menu must be select-
ed, (see paragraph Calibration). After
recording the reference values the analyz-
er returns to the current measurement
mode (Fig. 18).
Fig. 13: Operating mode, first screen
Fig. 14: Operating mode, second screen
Fig. 16: etup mode, first screen
Fig. 17: etup mode, second screen
Fig. 15: Operationg mode, third screen Fig. 18: ingle frequency WR measurement

12 • BX-240 © Box 73 Amateurfunkservice GmbH 2017
Sing e frequency impedance
measurement
Displayed are the actual measurement fre-
quency (freq.) the complex impedance af-
ter effective resistance and reactance, the
total impedance resistance (|Z|), the corre-
sponding Inductance/Capacitance of the
test object, the SWR and the currently
used reference values of the SOL compen-
sation (see paragraph Calibration).
With regards to the SOL compensation,
the sections on individual frequency SWR
measurement apply (Figs. 19, 21).
Sing e SWR measurement run
All multi frequency measurements have
three different modes which are indicated
by a symbol in the upper left corner of the
display.
1. <(small sign): overview and adjust-
ment of the central frequency. The SWR
is displayed above the frequency. In ad-
dition a small rectangle indicates the
marker position (see Mode M). The
central vertical line corresponds to the
centre of frequency (here 7950 kHz).
The operational range extends both left
and right according to the selected fre-
quency range (here + or 3200 kHz). Us-
ing the middle and right buttons the
centre frequency can be increased or de-
creased by some 100 kHz. At the same
time, each button press triggers a new
measurement cycle over the defined fre-
quency range.
2. >(large sign): overview, marker val-
ues and frequency range selection. The
SWR is again shown above the frequen-
cy. Additionally the small rectangle on
the SWR curve indicates the position of
the marker (see Mode M). Using the
middle and right buttons the frequency
range may be increased or decreased by
a factor of two (within the available fre-
quency/measurement range). At the same
time, at each button press a new mea-
surement cycle over the defined frequen-
cy range is started. The measured value
of the marker frequency is shown in the
bottom right hand corner of the display.
3. M(Marker sign): View and adjust the
marker values over the previous fre-
quency range. The selected frequency
of the marker and the corresponding
SWR are displayed (without boundary
value limitations). The marker itself is
again represented by a small rectangle
on the SWR curve. Using the middle
and right buttons the marker can now
be moved along the previously mea-
sured curve in a total of 100 steps. In
Fig. 19: ingle frequency impedance mea-
surement
Fig. 20: ingle run of impedance measure-
ment

BX-240 • 13© Box 73 Amateurfunkservice GmbH 2017
contrast to the <and >mode, no new
measurement cycle is triggered by but-
ton pressing, only the changed marker
position, including the corresponding
measured value, is displayed. The mea-
sured values determined before switch-
ing to mode Mhave been ‘frozen’ and
can now be ‘traced’ using the marker. A
new measurement value is only taken
again when switching to mode <or >.
The combination of these three modes
makes it easy to ‘target’ certain frequency
ranges during measurements, to intercept
values at specific points.
For internal SOL compensation, the unit
always uses the reference values from the
master calibration.
Sing e run for impedance
measurement
The active resistance (solid curve) and the
reactance (dashed curve) are shown above
the frequency. All further displays and op-
erating possibilities correspond to the ver-
sions in the previous section.
SWR measurement on five
frequencies (5 band measurement)
Five SWR values are displayed in the bar
graph for five different frequencies. Their
values can be defined via the Setup menu.
In this measuring mode no other options
are available. But you can simultaneously
observe the practical effects of any
changes with multi band antennas.
The internal SOL compensation is always
performed using reference values from
SOL All Frequencies (Fig. 23).
Fig. 23: WR measurement on 5 frequencies
Fig. 22: Marker on 7900 kHz
Fig. 21: ingle run of WR measurement

14 • BX-240 © Box 73 Amateurfunkservice GmbH 2017
Cyc ic continuity for SWR or
Impedance measurement
Here the previously described measuring
runs are repeated continuously with no
need for user intervention. The operation
is the same for the single run for measur-
ing SWR and impedance.
HF Generator
The FA-VA4 now operates as an RF gen-
erator with a square wave signal output at
the measuring socket, with a peak to peak
voltage of 1 VSS at 50 Ohms. The current
signal frequency is displayed (Fig. 24).
The setting is done by means of the three
buttons (select the decimal place to be
changed with D/S, decrease the value
with – increase the value with +).
View saved resu ts
All measurement modes allow you to save
a view of the current display (display con-
tent), to do this briefly press both the left
and right buttons simultaneously.
In the subsequent menu, one of five (0…
4) memory locations may be chosen using
the middle (Dwn) and right (Up) buttons
and selected with the left button (Sel).
The saving to memory takes a few seconds
as each pixel is transferred to the
EEPROM. Previously stored view data in
the selected memory location will be over-
written.
To display these views select Captured
Screens (Operation Mode ÆCaptured
Screens) and use the plus and minus but-
tons to select the display memory. On the
upper right edge of the display C0 to C4
allows identification of the image. Unoc-
cupied memory locations are displayed
completely empty. The left button D/S al-
lows you to return to the previous test
mode (Fig. 25).
Fig. 25: tored display view; top right is the
memory location number (here C1).
Fig. 24: Display view using the FA -VA4 as sig-
nal generator; the frequency is selected us-
ing the three pushbuttons

BX-240 • 15© Box 73 Amateurfunkservice GmbH 2017
netup Mode
The following settings options are includ-
ed in a separate menu as they are rarely
used in practice. They are accessible via
Operatin Mode ÆSetup. The middle and
right buttons are used to set up the re-
quired option, the left one is used to con-
firm the selection. After changing a pa-
rameter, the analyzer automatically returns
back to the last test mode.
SOL A Frequencies
This menu item has already been covered
in the calibration section (SOL compensa-
tion).
Frequency va ues for 5 band
measurement
After selecting the menu item (Operatin
Mode ÆSetup Æ5 Band Frequencies),
the first of the five frequencies is available
for an input or a change (f1). To do this use
the left (D/S) button to set the position in-
dicator to the position of the frequency
value to be changed and the plus and mi-
nus buttons to correct. By jumping from
the last point on the left to
the first point on
the right (1 Hz) the abbreviation ENT for
‘enter’ (input) appears. Pressing the plus or
minus key now stores the set value for f1
and jumps to the frequency input for f2.
This is repeated up to frequency f5(Fig.
26).
Having confirmed the last frequency the
analyzer returns to the previous test mode.
Language
This option allows the use of erman or
English for the menus and measurement
displays (Fig. 27).
Fig. 26: etting the frequency f1, to the right
the abbreviated ENT can be seen; pressing
the plus or minus button the frequency value
for f2is displayed and can be altered and so
on for f3.
Fig. 27: Menu language setting possibilities

16 • BX-240 © Box 73 Amateurfunkservice GmbH 2017
Disp ay Lighting
The possibilities are On, Off, and Auto.
With the automatic option the lighting will
turn off after a time, turning on again after
some user action (button press). It is rec-
ommended to use the device without light-
ing or, at least, in automatic mode as the
current consumption for a graphic display
is quite high (Fig. 28).
Correction of the frequency
generator
All the internal frequency values are de-
rived from a 27 MHz Quartz crystal. A
variation of about a hundred Hertz is not
uncommon and can be compensated for
using software. To do so a frequency of
27.000000 MHz should be set in the Fre-
quency Generator mode. A calibrated fre-
quency counter should be connected to the
analyzer output socket and the difference
between the measured and adjusted fre-
quency determined. After selecting the
menu item Delta Frequency press the left
button. The value for dfis then adjusted
using the middle and right buttons to the
determined difference (27.000000 MHz
less measured frequency). Press the D/S
button again to select the decimal place.
Repeated pressing of this button will dis-
play the abbreviation ENT. If the plus or
minus button is pressed now, the FA-VA4
will take the set value as the frequency
correction amount. Now the frequency of
the analyzer output signal should corre-
spond exactly to the set value. Naturally,
in the course of this, changes in tempera-
ture may lead to deviations of the quartz
frequency, a frequency correction here is
at the limits of quartz oscillator stability.
In the case of antenna measurements,
however, a deviation of a few hundred
Hertz or even a kiloHertz is usually non -
critical, so the described correction may
only be necessary in rare cases (Fig. 29).
Fig. 28: ettings for display lighting
Fig. 29: Input possibilities for the frequency
correction factor

BX-240 • 17© Box 73 Amateurfunkservice GmbH 2017
Disp ay Update Cyc e
For individual frequency measurements
there are three options available, Slow,
Medium and Fast. The selection has no
influence on the measuring accuracy but
very much on the energy demands of the
device. Outside of the measuring time,
the oscillator and other components are
switched off and the microprocessor
clocked at a lower frequency. A longer dis-
play duration (selection Slow) therefore
results in a lower energy requirement (Fig.
30).
Reset
After selection and confirmation of the
menu item, all parameters are reset to the
factory settings. The master calibration
and all stored display views are cleared
from the EEPROM (Fig. 31).
Forced Reset (without menu item)
In the unlikely event of the device becom-
ing unresponsive even when switched off
and on again, a forced reset can be carried
out without recourse to the menu.
To do this the analyzer must be switched
off. Then all three buttons should be
pressed and held, then if the power is
switched on all parameters should reset to
factory default settings and the device
work again as per normal. If necessary the
language, lighting and frequency settings
must be corrected.
However, the forced reset does not clear
existing master calibration values nor
stored display views. Any existing master
calibration values must be declared as
valid, to do this select On under Operatin
Mode ÆSetup ÆSOL.
Fig. 30: The display update cycle speed may
be selected, fast, medium, slow.
Fig. 31: This menu item allows a complete
reset to factory default settings.

18 • BX-240 © Box 73 Amateurfunkservice GmbH 2017
nTips on measurements in
practice
The application possibilities of measuring
a complex impedance are very diverse.
The measurement examples listed below
can therefore only be used to a certain ex-
tent. Further explanation of the physical
and mathematical contexts can be found
in the relevant technical literature.
It is assumed that a master calibration
(SOL All Frequencies) has been carried
out with or without connected cables (de-
pending on the measurement setup). If the
setup is later changed e. g. by changing the
cable, then the compensation must be car-
ried out again.
On Measurements in Genera
One must be aware when measuring on
antennas, that the FA -VA4 is an ‘active’
device that generates RF energy and de-
livers it to the antenna. The power at the
BNC socket is about 3dBm.
And is sufficient to cause interfer-
ence to other stations, therfore the
duration of all measurements should
be kept as short as possible and tests
on frequencies outside of the Ama-
teur Radio bands should be avoided.
Mu ti Frequency Measurement of
Impedance and SWR of an Antenna
The antenna is connected directly to the
base point or via a cable previously inte-
grated into the calibration by means of
SOL compensation and the analyzer. An
overview of the SWR or impedance pro-
file can be generated using the multi fre-
quency measurement. The centre frequen-
cy and the frequency range must be set to
the range to be measured. A minimum
SWR can be ‘targeted’ via the Marker
Mode.
For high quality antennas (e. g. magnetic),
increased attention is necessary when tak-
ing a measurement. Under certain circum-
stances, depending on the chosen frequen-
cy range the maxima and minima are so
narrow that they are not displayed. Here
the measurement frequency can only be
further limited and the span reduced ac-
cordingly.
Measurement of Antenna Impedance
and SWR for a sing e frequency
The antenna is connected directly to the
analyzer or via a cable. It is to be decided
whether the whole system of antenna and
cable or just the antenna is to be measured.
If the latter is connected then any cable
(usually plug in connectors) must be dis-
connected. The analyzer must be set to a
fre quency to measure SWR and or Im pe -
dance. The target frequency is then en-
tered. Via the menu item SOL One Fre-
quency (see paragraph Calibration), the
cable is again included for the actual fre-
quency under measurement by successive-
ly connecting the test elements (instead of
the antenna) as described above. Lastly the
cable is connected to the antenna and the
actual antenna SWR or impedance is dis-
played.
The method of tuning an antenna for opti-
mal SWR or resonance depends on the an-
tenna type. For a monoband dipole with
Balun this may be achieved by shortening
or lengthening the antenna elements. For
an antenna with negative reactance (ca-
pacitive) the elements are too short, in the
case of positive reactance (inductive) then
the elements are too long. The aim is to
achieve an effective resistance of 50 Ohms
with zero impedance (at resonance).

BX-240 • 19© Box 73 Amateurfunkservice GmbH 2017
Measurement of Capacitance and
Inductance
When using on shortwave the manufacture
of a simple adapter of 2.54 mm pin con-
nectors and matching sockets serves to
conserve the SOL reference elements (see
paragraph Calibration). For measurement
the mode Z One Frequency is used. For the
existing measurement setup the target fre-
quency must be set and calibration carried
out from the menu item SOL One Frequen-
cy. The object to be measured is connected
directly to the selected setup and the ca-
pacitance or inductance at the target fre-
quency can be read on the display.
FA -VA4 as a Dip Meter
If a signal generating source (in our case
the analyzer) is loosely coupled in parallel
to a resonant circuit, a different energy ab-
sorption will be shown through the circuit
both at and outside of the oscillators reso-
nant frequency. This change also causes a
change to the displayed SWR value.
The loose circuit coupling is usually made
inductively; it is sufficient to place the an-
alyzer, with a coil (a wire) connected, close
to the resonant circuit. If using a ferrite ring
then the wire should be passed through the
core, at very low frequencies (f< 1MHz) a
test with several windings is helpful.
The SWR multi frequency measurement
must be set so that the expected resonant
frequency is set as the centre frequency. In
order to read the resonant frequency with
the highest degree of accuracy the mea-
surement interval should be reduced step
by step, this will be indicated by a clear
minimum SWR.
It is not always easy to find this minimum
as with high Q circuits the margins are
very narrow.
Determination of cab e resonance
and resonant cab es
The analyzer makes it easy to determine
points of resonance in coax and other RF
cables. Connecting an unknown cable to
the analyzer, the other end may be open or
short circuited. When the cable end is
open, points of resonance occur at 1/4, 3/4
etc. of the wavelength of the resonant fre-
quency. With the cable shortcircuited the
resonant points are at 1/2, 1, 3/2etc. of the
wavelength of the resonant frequency.
Resonance means that the reactance of the
impedance is equal to zero, so here we
must use the ‘Z multi frequency’ measure-
ment. For shortwave it makes sense to
start with a centre frequency of 15 MHz
and a maximum measuring interval. The
resonances are indicated at the points at
which the reactance crosses the x- axis (ab-
solute zero). This frequency can be easily
manipulated in Marker Mode. This
method can also be used to make cable
resonators for a specific frequency. Thus
using the method set out in the following
paragraph a rough estimate of the physical
length can be made. A slightly long cable
may be trimmed until the target frequency
resonance is reached.
Determination of cab e ength and
shortening factor
Wavelength and physical length of a reso-
nant cable are linked by the shortening fac-
tor. Similar would be comparing the speed
of light velocity of a wave in free space to a
wave on a cable, the wave on the cable
propagates more slowly than in a vacuum.
For example R 58 co ax cable has shorten-
ing factor of 0.66 so the propagation speed
is only 198 000 km/s instead of 300 000
km/s.
Length, propagation speed and resonant fre-
quency are linked by the formula
v
l= ––– · N .
f
N is a factor of 1/4, 1/2, 3/4, and so on, de-
pending on which resonance point is con-
sidered and whether the cable is open or
short circuited at the other end. If the res-
Table of contents
Other Funk Amateur Measuring Instrument manuals