GUIDANCE MARINE Artemis Mk6 FAT Manual

Doc No 93-0491-4 UNCONTROLLED COPY ONCE PRINTED
PAGE 1 OF21
Go To Contents
Artemis Mk6 FAT Initial Setup
PREPARED ON BEHALF OF
GUIDANCE MARINE BY PaulWoods
Name of author
COPYRIGHT STATEMENT
This document and the information contained therein is the property of Guidance Marine Ltd. It must not be
reproduced in whole or part or otherwise disclosed without prior written consent of the Guidance Marine Ltd
Quality Manager or Quality Director.

Doc No 93-0491-4 UNCONTROLLED COPY ONCE PRINTED
PAGE 2 OF21
i Contents
iContents....................................................................................................................................................2
ii References................................................................................................................................................2
iii Term Definitions & Acronyms..................................................................................................................2
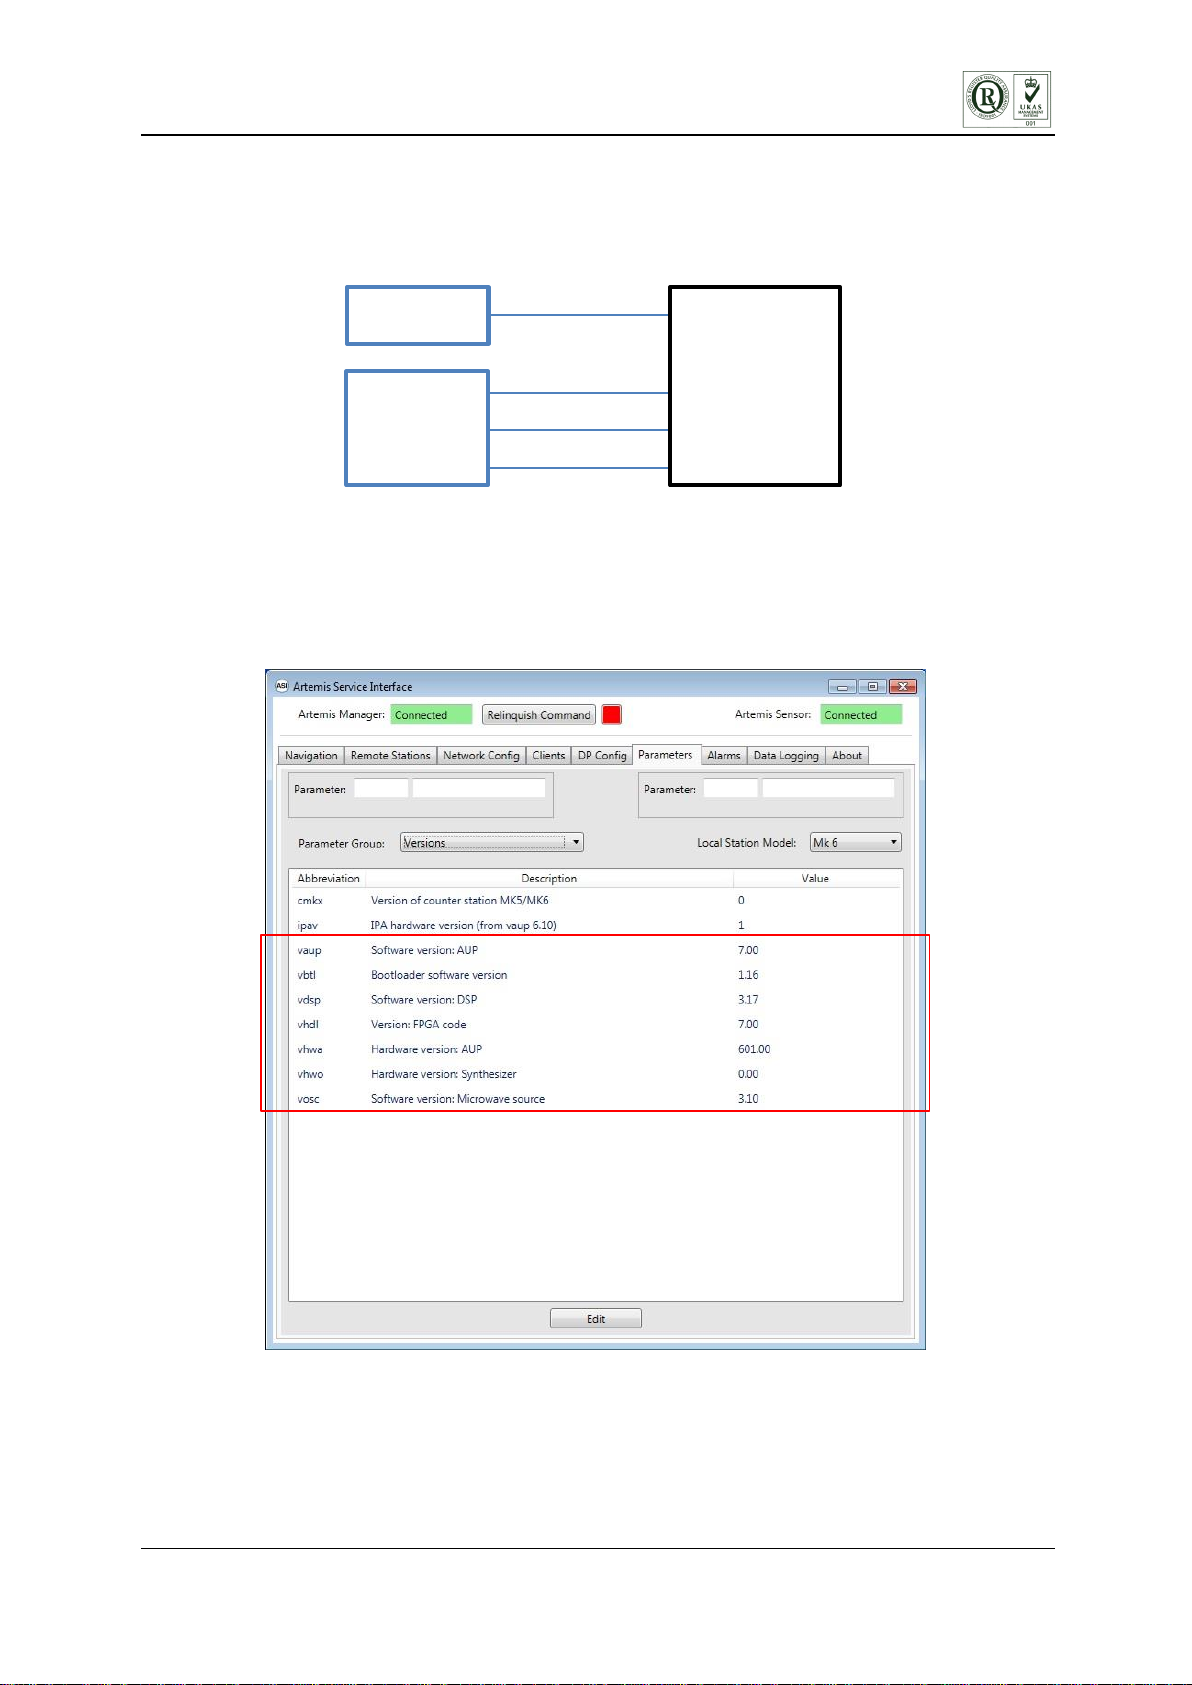
1. Artemis Software Versions.......................................................................................................................3
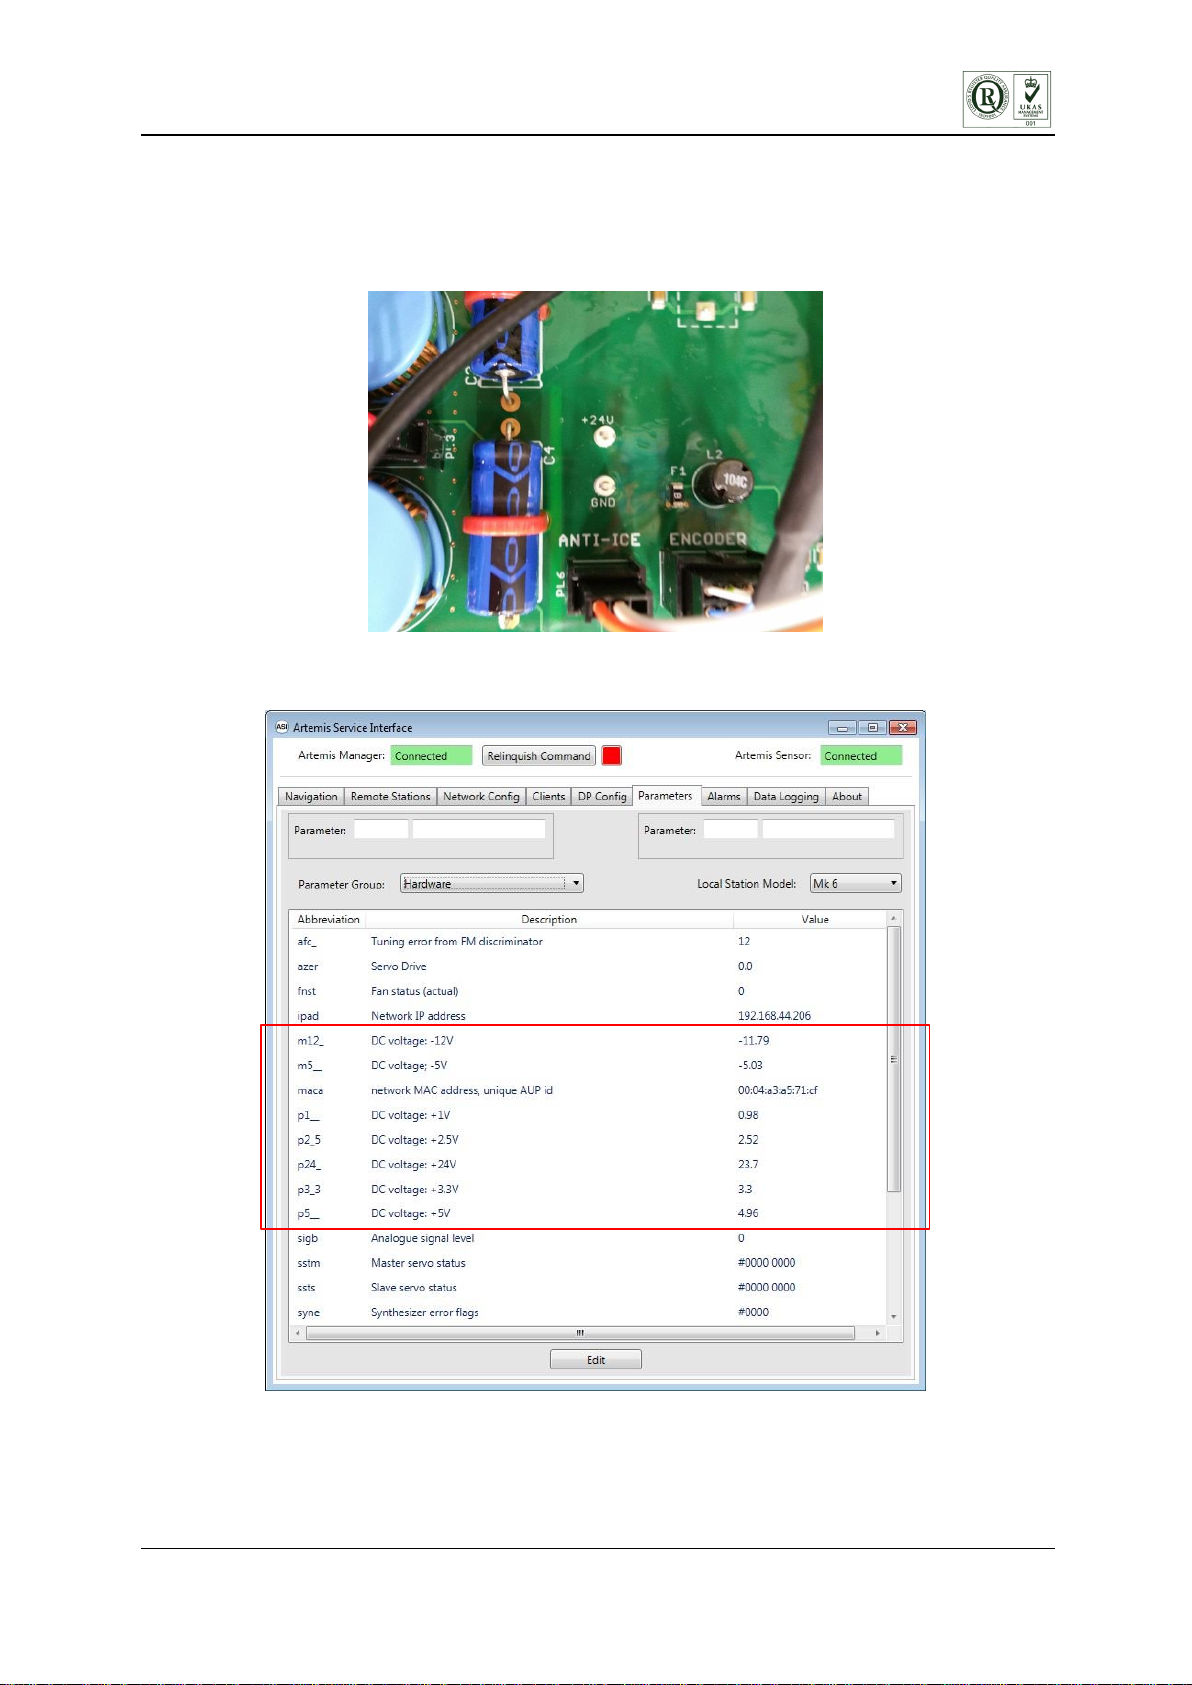
2. Voltage Measurements............................................................................................................................4
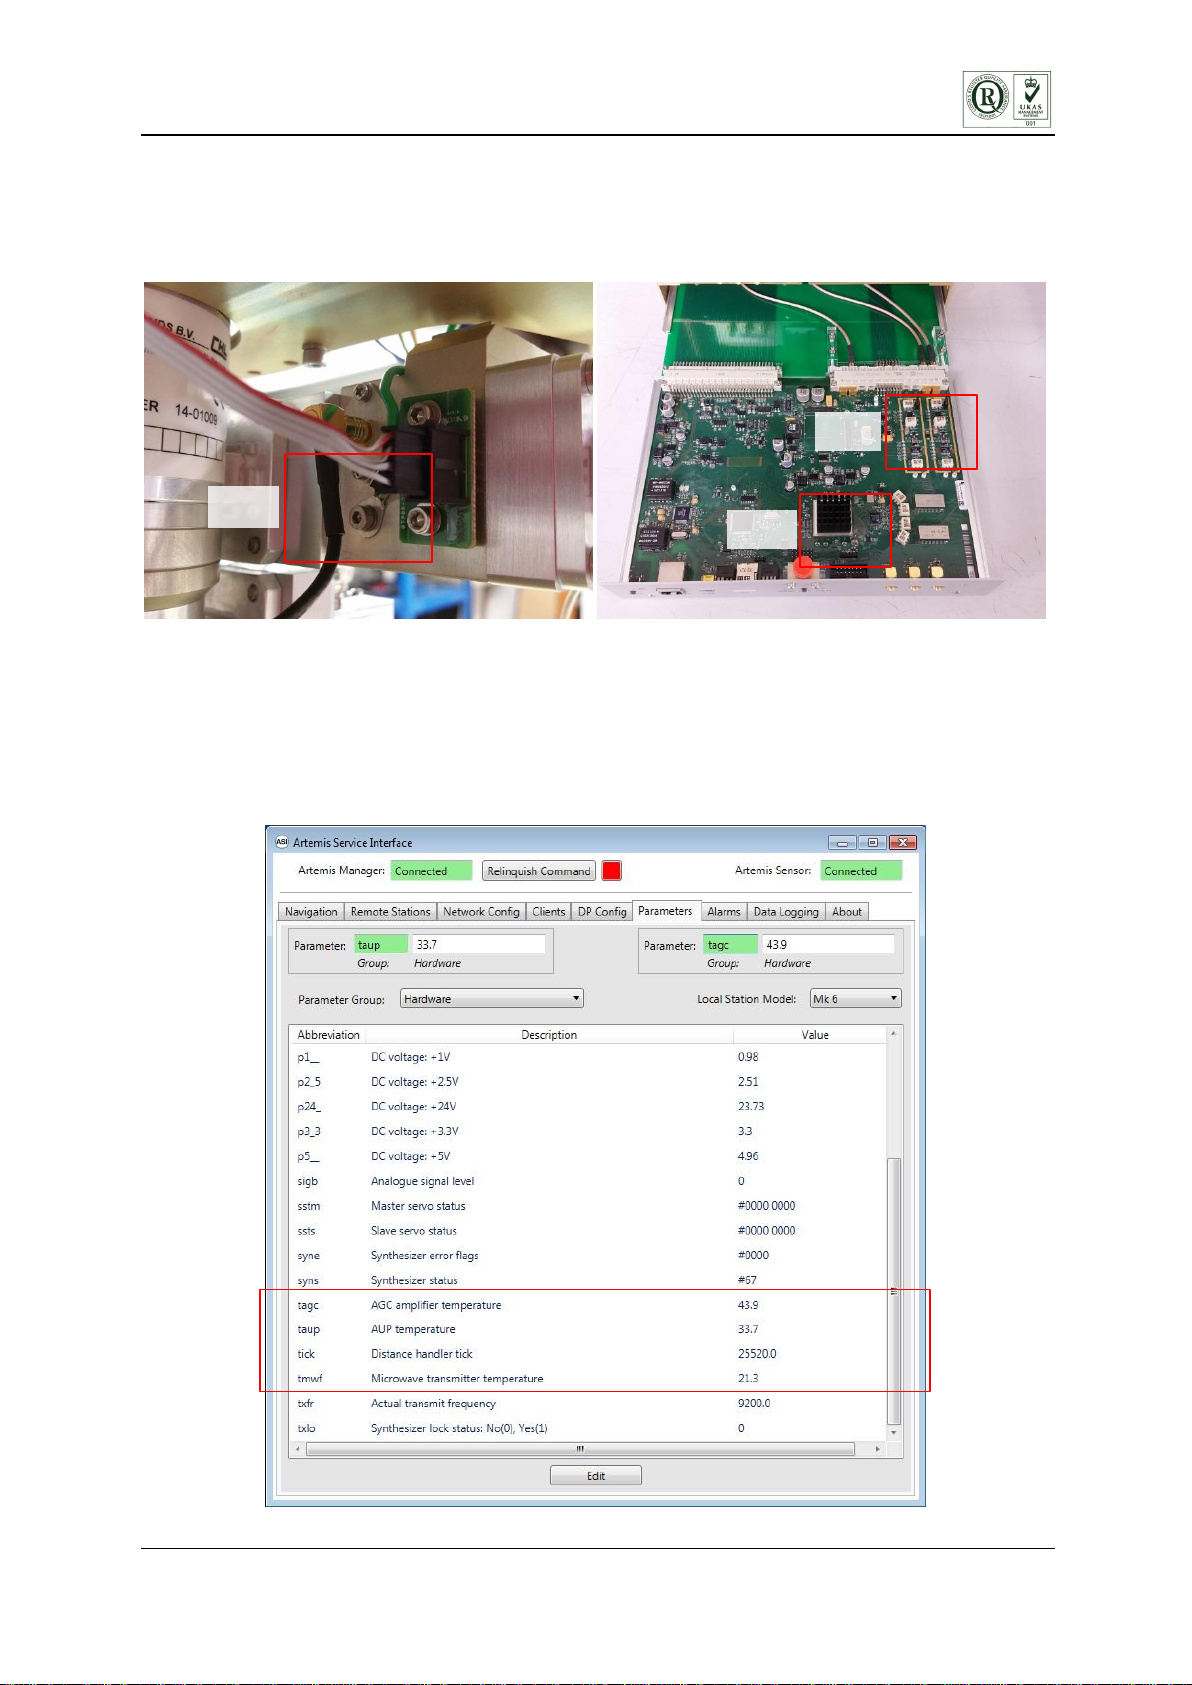
3. Temperature Sensors..............................................................................................................................5
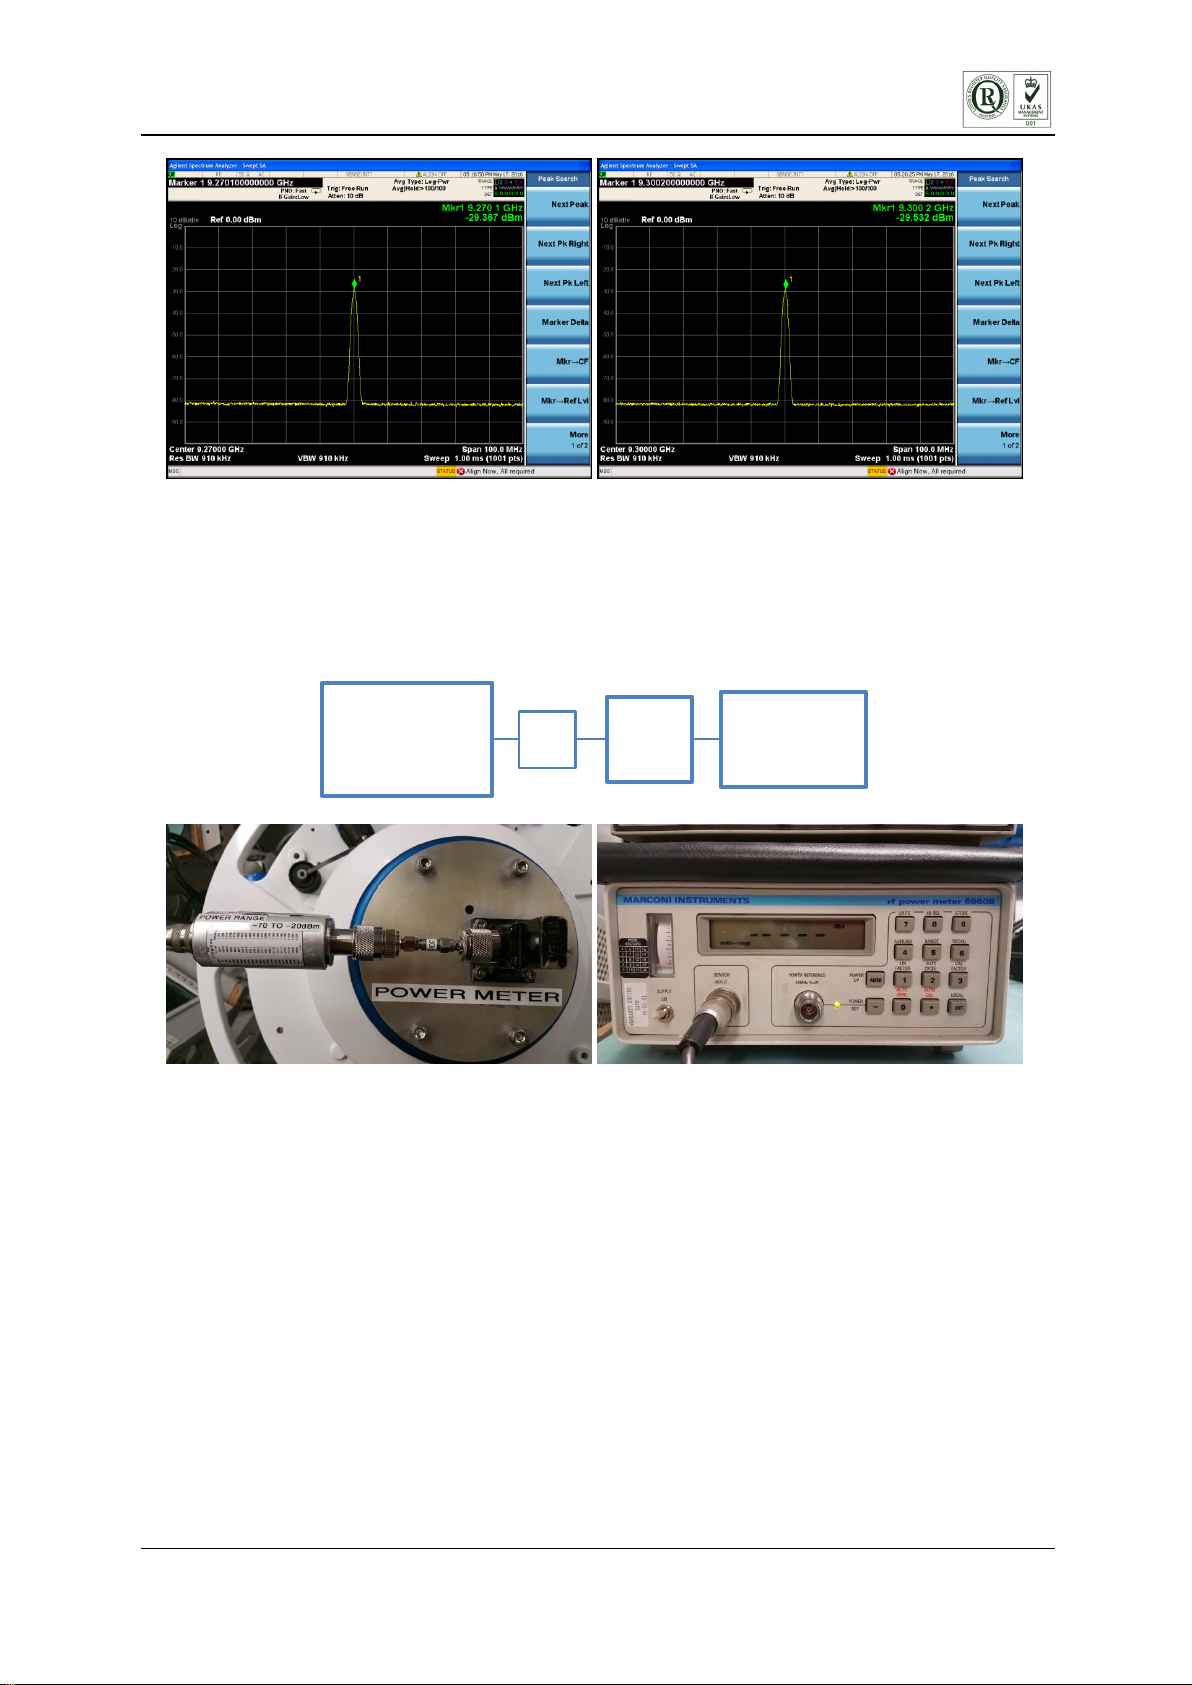
4. Microwave Output Characteristics...........................................................................................................6
5. IF Pre-Amp Gain and Noise Measurement............................................................................................8
6. AGC Amplifier.........................................................................................................................................10
7. Fixed Delay Adjustment.........................................................................................................................15
8. Anti-Icing.................................................................................................................................................18
9. Phase and Servo Test............................................................................................................................19
10. Encoder Readout ...................................................................................................................................21
ii References
WI G2 ESD Equipment Testing and Recording
Refer to production works order for latest revision of parts.
iii Term Definitions & Acronyms
Term Definition
ASI Artemis Service Interface (software)
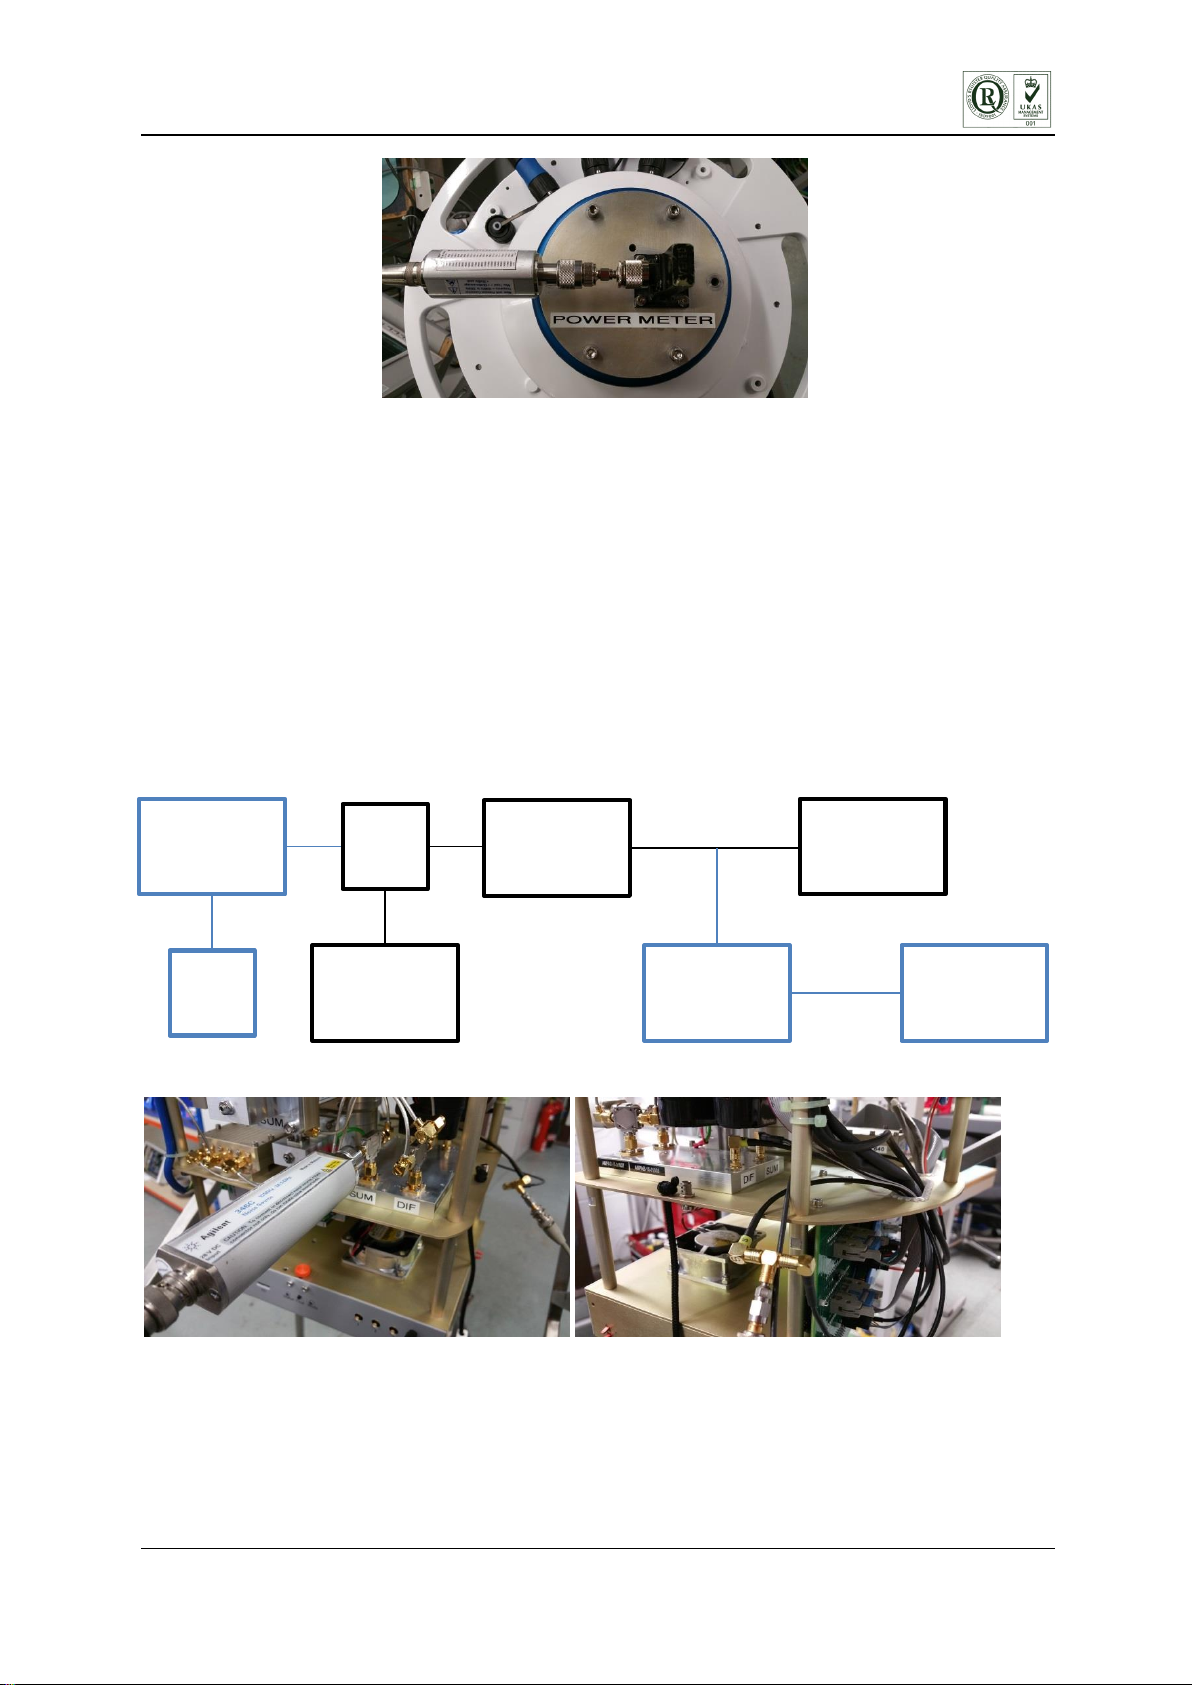
Test setup block diagrams –Black boxes are part of the Artemis build, Blue boxes
are attached test equipment.

Doc No 93-0491-4 UNCONTROLLED COPY ONCE PRINTED
PAGE 3 OF21
1. Artemis Software Versions
Connect up the Artemis as shown:
If the AUP is not programmed, use the programming document 93-0465-4 to program the Artemis with the
latest production release of software.
Open the ASI software and connect to the Artemis.
The installed version of software is found under the parameter settings –Versions.
Record the Versions in section 2 of the build record.
Note: vhwa and vhwo are not recorded.
Test PC /
Laptop
Artemis
Serial Data Cable
240Vac
Mains Power
Programming Cable
Synth Data Cable

Doc No 93-0491-4 UNCONTROLLED COPY ONCE PRINTED
PAGE 4 OF21
2. Voltage Measurements
Connect a calibrated DVM across the GND and +24V test points on the Interconnect board. Record the
reading in section 4.1 of the build record.
The AUP voltage measurements are in the parameter settings –hardware in the ASI software.
Record the values in section 4.1 of the build record.

Doc No 93-0491-4 UNCONTROLLED COPY ONCE PRINTED
PAGE 5 OF21
3. Temperature Sensors
There are 3 temperature sensors on the Artemis to check. The microwave front end sensor that is mounted
to the PIN module, this is the tmwf temperature reading.
The taup and the tagc temperature sensors are on board the AUP. Remove the AUP and slot in the AUP
breakout board. To test these you don’t need to remove the top cover of the AUP enclosure (Picture shows
areas to spray) and spray each of the sensor areas with freezer spray for a fraction of a second (prolonged
spraying can cause thermal damage) watch the temperature on the ASI drop and recover by a few degrees.
The ambient temperature measurements are in the parameter settings –hardware in the ASI software.
Record the values in section 4.2 of the build record.
taup
tagc
tmwf

Doc No 93-0491-4 UNCONTROLLED COPY ONCE PRINTED
PAGE 6 OF21
4. Microwave Output Characteristics
Mount the power meter adaptor plate to the Artemis antenna flange. Connect the spectrum analyser to the
Artemis with a 30 dB in line attenuator.
Set the spectrum analyser to following settings:
Centre Frequency: 9250MHz
Span: 150MHz
Amplitude: Ref level 0dBm
Bandwidth: Auto (This is usually 910KHz)
Trace Detector: Trace Average (100/100)
Set the Artemis as a Mobile unit using the ASI software, select F0 frequency pair. Set the unit into operating
mode.
Attenuator
30
Spectrum
Analyser
Antenna flange
to power meter
adaptor
F0
F2

Doc No 93-0491-4 UNCONTROLLED COPY ONCE PRINTED
PAGE 7 OF21
Select the remote stations in the ASI for F2, F3 and F1 and move the centre frequency on the spectrum
analyser to suit. You will see the above output power peaks at each frequency setting, use peak search on
the spectrum analyser to measure each frequency.
Record the frequency values in section 4.3 of the build record.
Connect the power head to the 30dB attenuator on the Artemis.
Set the power meter up (If using TE500, power head 6920):
LIN FACTOR: 6.7
CAL FACTOR: 107
dB REL -46.8dB Note: this is the loss of the waveguide adaptor + the attenuator
then AUTO ZERO. Check the power head for any changes to values to the LIN or CAL factor.
In the ASI software –set txpm to Manual transmit power, then set txpw to high power.
Run through the remote stations for F0 to F3 and log results in section 4.3 of the build record.
Set txpw to low power adjust iatt (default value is 0.5) to get the suppression between high and low power to
20dB on F0, then check across F1 to F3 and adjust again if needed to get the best match across all
frequencies.
Suppression is calculated by ‘high power – low power’
Log the results in section 4.3 of the build record. Allowed tolerance is ± 1dB.
F3
F1
Power
Head
Attenuator
30
Power
Meter
Antenna flange
to power meter
adaptor

Doc No 93-0491-4 UNCONTROLLED COPY ONCE PRINTED
PAGE 8 OF21
Place in Standby, remove 30dB attenuator and connect the power meter directlyto the power meter adaptor
plate. Set dB REL to -16.8dB on the power meter, this is the loss of the waveguide adaptor only.
Run through the remote stations for F0 to F3 in the ASI and log the standbyresults in section 4.3 of the build
record.
The suppression is the difference between the high power output and standby. For example +20dB high
power output and -25dB standby power would be a suppression of 45dB. This is the final calculation for
section 4.3 of the build record.
5. IF Pre-Amp Gain and Noise Measurement
Connect up the Artemis as shown below:
Artemis
ICB/AUP
SUM channel
HP 8447A
20dB Gain
Amplifier
Artemis
IF Pre-Amp
SUM channel
Spectrum
Analyser
Synthesizer
28Vdc
PSU
SUM
Mixer
Input
Output
Agilent 346C
Noise Source

Doc No 93-0491-4 UNCONTROLLED COPY ONCE PRINTED
PAGE 9 OF21
DisconnecttheSMAcablefromtheSUMmixerandattachtheNoiseSourceandlock-offwithaSMAspanner.
Disconnect the SMB SUM channel output to ICB cable and attach to one side of the ‘T’ piece adaptor. Place
the SMB to SMB test lead from the ‘T’ piece adaptor to the SUM channel output. Connect the ‘T’ piece adaptor
to the input of the HP8447A, connect the output into the spectrum analyzer.
Set the spectrum analyser to following settings:
Centre Frequency: 30MHz
Span: 20MHz
Amplitude: Ref level -50dBm / Amplitude 5dB per division
Bandwidth: 1MHz
Trace Detector: Trace Average (100/100)
Marker: 30MHz
Power up the Artemis unit and put into operating mode, Selecting F0 remote station.
With the noise source powered off, you will get a flat filter response shown above. If the filter response is not
flat then there is something wrong in the build.
Note down the signal level (-75.268dB). Power up the noise source and note down the signal level (-
65.112dB)
Noise Source - Off
Noise Source - On

Doc No 93-0491-4 UNCONTROLLED COPY ONCE PRINTED
PAGE 10 OF21
Open the IPA gain and noise configuration spreadsheet and enter the noise source signal values and it will
work out the noise figure and gain for you. Enter this into section 4.4 of the build record.
Repeat again for remote station F1.
Power down the unit and swap the noise source over to the DIF side, reconnecting the SUM into the
system.
Power up the Artemis unit and put into operating mode. Repeat the test that was carried out on the SUM
channel and enter the results into section 4.4 of the build record.
Power down the Artemis and remove the noise source from the system.
6. AGC Amplifier
Power down the Artemis and remove the AUP, then remove the two jumper links on the AUP and then fit
back into the Artemis.
Connect up the Artemis as shown below:
HP 8116A
Pulse/Function
Generator
Spectrum
Analyser
Attenuator
20
SUM Channel
ICB/AUP
Input Cable
DIF Channel
ICB/AUP
Input Cable
Jumper

Doc No 93-0491-4 UNCONTROLLED COPY ONCE PRINTED
PAGE 11 OF21
Disconnect the SMB SUM channel output to ICB cable and attach to one side of the ‘T’ piece adaptor
Disconnect the SMB DIF channel output to ICB cable and attach to one side of the ‘T’ piece adaptor.
Connect a 20dB attenuator onto the output of the HP 8116A Pulse / Function generator. Connect a ‘T’ piece
adaptor to the 20dB attenuator. Connect the spectrum analyzer to the Function generator ‘T’ piece. Connect
the SUM / DIFF ‘T’ piece to the Function generator ‘T’ piece.
Set the spectrum analyser to following settings:
Centre Frequency: 30MHz
Span: 50MHz
Amplitude: Ref level 0dBm / Amplitude 10dB per division
Bandwidth: 1MHz
Trace Detector: Trace Average (100/100)
Marker: 30MHz
Use thespectrum analyzer to set-upthe function generator (thespectrum analyzer will mostlikelybetheonly
calibrated piece of test equipment)
Set the function generator to sine wave, change the frequencytill the peak of the output is at 30MHz. As you
can see in the picture the function generator is set to 31.7MHz to get the 30MHz output, the numbers and
output don’t quite tie up which is why the calibrated spectrum analyzer is used to check / setup the output.
Once the frequency is set adjust the AMP setting to adjust the output power to -20dBm.
Power up the Artemis, then using the ASI software set to operating mode.
Open the parameters tab and in the two parameter boxes type ‘suml’and ‘difl’
These should be approximately the same value but the limits for both are slightlydifferent.
The SUM channel is 10,000 ± 1% (9900 to 10100)
The DIF channel is 10,000 ± 5% (9500 to 10500)
Note down the SUM and DIF levels in section 4.5 of the build record.

Doc No 93-0491-4 UNCONTROLLED COPY ONCE PRINTED
PAGE 12 OF21
Change the attenuator from 20dB to 30dB and repeat. Do the same with 40dB, 10dB and no attenuator.
Eachtimeyouchangetheattenuatorcheck onthespectrumanalyzerthatthesignaliscorrect.Asyouchange
the attenuators the signal strength will follow suit, the frequencywill always be at30MHz. When all attenuator
values have been done, return to the original -20dB attenuator.
Note down the suml and difl output values in section 4.5 of the build record.

Doc No 93-0491-4 UNCONTROLLED COPY ONCE PRINTED
PAGE 13 OF21
Inthe ASI software under the parameters tab, change the phc0, phc1, phc2 and phc3 values to ‘0’
Then in the parameter boxes type ‘iaze’ and ‘qpha’
This is used to work out the SUM DIF Phase difference.
𝑃ℎ𝑎𝑠𝑒 𝑑𝑖𝑓𝑓𝑒𝑟𝑒𝑛𝑐𝑒 = 𝑞𝑝ℎ𝑎
𝑖𝑎𝑧𝑒
So the above values give 143 / 7216 = 0.0198°
Note this down in section 4.5 of the build record.
Return phc0, phc1, phc2 and phc3 to the value of 170.
Remove the DIF cable from the ‘T’ piece adaptor and leave it floating.

Doc No 93-0491-4 UNCONTROLLED COPY ONCE PRINTED
PAGE 14 OF21
Type ‘slev’ into the parameter box of the ASI software.
Note down the signal level with the 20dB attenuator inline. Change the attenuator from 20dB to 30dB and
repeat. Then 30dB to 40dB, 40dB to 10dB, 10dB to no attenuator, checking on the spectrum analyzer that
the signal level is correct. Then the signal level correction is readyto be worked out.
The targetsignal level is:
Attenuator Value
Target Signal level
40dB
-58
30dB
-48
20dB
-38
10dB
-28
0dB
-18
Adjust the value of ‘levc’ and check each of the attenuator values to make sure that the target signal level has
been gained.
If the overall difference in signal level is +9dB across all the target signal levels, then type -9.0 into the ‘levc’
parameter.
Note this down in section 4.5 of the build record.

Doc No 93-0491-4 UNCONTROLLED COPY ONCE PRINTED
PAGE 15 OF21
Power down the unit and remove the AUP from the Artemis and place the two jumper links back onto the
AUP, refit the AUP. Remove the ‘T’ piece adaptor and place the SUM and DIF cables back onto the IF Pre-
amp.
7. Fixed Delay Adjustment
Remove the power meter adaptor plate from the antenna flange and fit the TDC fixed delay meter, making
sure it is securely bolted down.
Power up the Artemis and using the ASI software set the following parameters.
stty: Fixed Station
txpm: Manual
simu: Open Loop
txpw: Normal (high power)

Doc No 93-0491-4 UNCONTROLLED COPY ONCE PRINTED
PAGE 16 OF21
Then select remote station F0
Connect the power to the TDC fixed delay meter, +12V, 0V and -12V and power up. The fixed delay meter
should already be on F0, if not, use the ▲ and ▼ arrow keys till the display states 0: 9200 MHz
There will be fixed delay value written on the display of approx. 489nS (this is the target value across F0, F1,
F2 and F3)
Make sure that the returned signal level across all frequencies is set at -48dB. To do this select the remote
station F0, check the signal level, Select F1 remote station and press the arrow keys on the TDC Fixed delay
meter till you see 1: 9300MHz. Then you get a timing written on screen (that’s when you know it is connected)
Check the signal level… Do this for all four frequencies. Any adjustment required to be carried out can be
done by turning the adjustable attenuator pot on the TDC Fixed delaymeter.
Once you have -48dB across all frequencies look at the time delay on the TDC Fixed delay meter. There are
two adjustment parameters in the ASI software to set-up the delay time, ‘fdll’ and ‘fdls’. ‘fdll’ is a course
adjustment and ‘fdls’ is a fine adjustment. The likelihood is that only the ‘fdls’ will require adjustment to get the
correct time delay.

Doc No 93-0491-4 UNCONTROLLED COPY ONCE PRINTED
PAGE 17 OF21
‘fdll’ default is 14 (10 to 15 range) ‘fdls’ default is 5000 (4000 - 6000 range), adjusting the value up will result
in the time delay increasing and adjusting the value down will result in the time delay decreasing.
As you can see from the photos you will not get 489.0nS on every frequency but you can get very close.
Note this down in section 4.6 of the build record along with the ± x.x nS jitter value. Then from all 4 readings
you can work out the average time delay.

Doc No 93-0491-4 UNCONTROLLED COPY ONCE PRINTED
PAGE 18 OF21
8. Anti-Icing
This test can be carried out using the same settings as the fixed delayadjustment.
Using a calibrated multimeter set to AC voltage, probe across the heater contacts on the antenna flange and
you will see 0VAC. Turn on the anti-icing using the ASI software ‘aion’ to Auto (On) and the anti-icing will turn
on. Probing across the heater contacts will show a voltage of 33 –36VAC, then return ‘aion’ to ‘Off’

Doc No 93-0491-4 UNCONTROLLED COPY ONCE PRINTED
PAGE 19 OF21
9. Phase and Servo Test
Using the ASI software change the parameter ‘simu’ from Open Loop to Closed Loop.
Fit the phase / servo tester (nicknamed the ‘horses head’) to the antenna flange.
Turn ‘On’thehorses head anditshould start to rotate.Usingthe delta phaseand 180 phase adjustments you
can get the horses head to rotate both clockwise and anticlockwise. This will take a bit of playing with to find
the best adjustment place for maximum output.

Doc No 93-0491-4 UNCONTROLLED COPY ONCE PRINTED
PAGE 20 OF21
Type into the parameter box ‘azer’ this is the servo voltage measurement.
Adjust the phase shifter on the horses head till you hit the maximum negative output voltage on ‘azer’. The
negative voltage,shown above,is theheadrotating anticlockwise.
Note down the voltage in section 4.8 of the build record, the build record is filled in mV so -0.313 is -313mV.
Change theservo loopgain ‘slgn’ from 5 to 4 and note down the voltage again. Repeat with ‘slgn’ set at 3 and
2.
Adjust the phase shifter on the horses head till you hit the maximum positive output voltage on ‘azer’. The
positive voltage, shown below, is the head rotating clockwise.
Note down the voltage in section 4.8 of the build record, the build record is filled in mV so 0.318 is 318mV.
Change the servo loop gain ‘slgn’ from 5 to 4 and note down the voltage again. Repeat with ‘slgn’ set at 3 and
2.
Table of contents