Jelight JEL-2400 User manual

ELIGHT
OPERATING INSTRUCTIONS
JEL-2400
RADIOMETER/PHOTOMETER
Rev X
J
Jelight Company, Inc.
2 Mason, Irvine CA 92618 USA
Tel: +1-949-380-8774
Fax: +1-949-768-9457
http://www.jelight.com
e-mail:[email protected]

Page 2
Table of Contents
1. System Includes 3
2. System Specifications 3
3. Quick Reference Guide 3
4. Internal Battery Pack 7
5. Sensor Connector and Wiring 7
6. USB Ports 8
7. Display 8
8. Current Measurement and Limitations 9
9. Sample Time and Limitations 10
10. Reverse Bias 10
11. Home Screen 10
12. Display Style Selection 10
13. Display Content 11
14. Feature Buttons 12
15. Settings 13
16. Files 18
17. Light Calc 19
18. Sleep 19
19. Survey 19
20. Info 20
21. Upgrades 20
22. Care and Handling 21
23. Warranty 22
24. Calibration 22

Page 3
1. System Includes:
A. Meter - 8 decade auto ranging meter.
B. USB Cable - Micro and Mini USB cables for charging, software control and data
retrieval.
C. Case - Protective carrying/shipping case.
D. Electrical Calibration Certificate –N.I.S.T. Traceable/ISO17025 accredited.
E. Sensor/Detector (separate purchase required/sold separately).
2. System Specifications:
A. Dynamic Range: 1 pA to 1 mA, Calibrated Range: 50 pA to 1 mA
B. Display: 4.3", 480x272, TFT Color LCD, touch enabled, backlit
C. Operating Temperature: 0 Deg C to 40 Deg C
D. Storage Temperature: -10 Deg C to 45 Deg C
E. Memory: 4GB microSD
F. USB Current Draw: Typical: 500mA Max:900mA (USB 3.0)
G. Bias: Programmable reverse 5V bias
H. Time:
H1. Sample Time: Select from 100 milliseconds –5 seconds or use Auto (based on
light level)
H2. Recording Interval: Select from 1 second up to 1 hour, or use “Sample” to match
the “Sample Time” for faster speeds.
H3. Chart Update Time (Trend): Select from 3 times per second up to once per hour.
I. Dimension: 3 x 6 x 1.5”
J. Weight: 8 lbs
3. Quick Reference Guide:
3A. Front:
The front panel of the JEL-2400 is a full color 4.3" capacitive TFT touch screen display. The
display is a sensitive electronic device. It should not be exposed to sharp objects, harsh
environments, chemicals, liquids etc.
3B. Rear:
The JEL-2400 has a stand at the back which is opened by grasping at the two finger slots
and gently lifting the stand up. The stand has small posts that slide along the housing to
open and close. No force should be applied to the stand during opening and closing. When
the stand is in use, no pressure should be applied to the meter as this can bend the small
post holding the stand into the housing.
Page 4
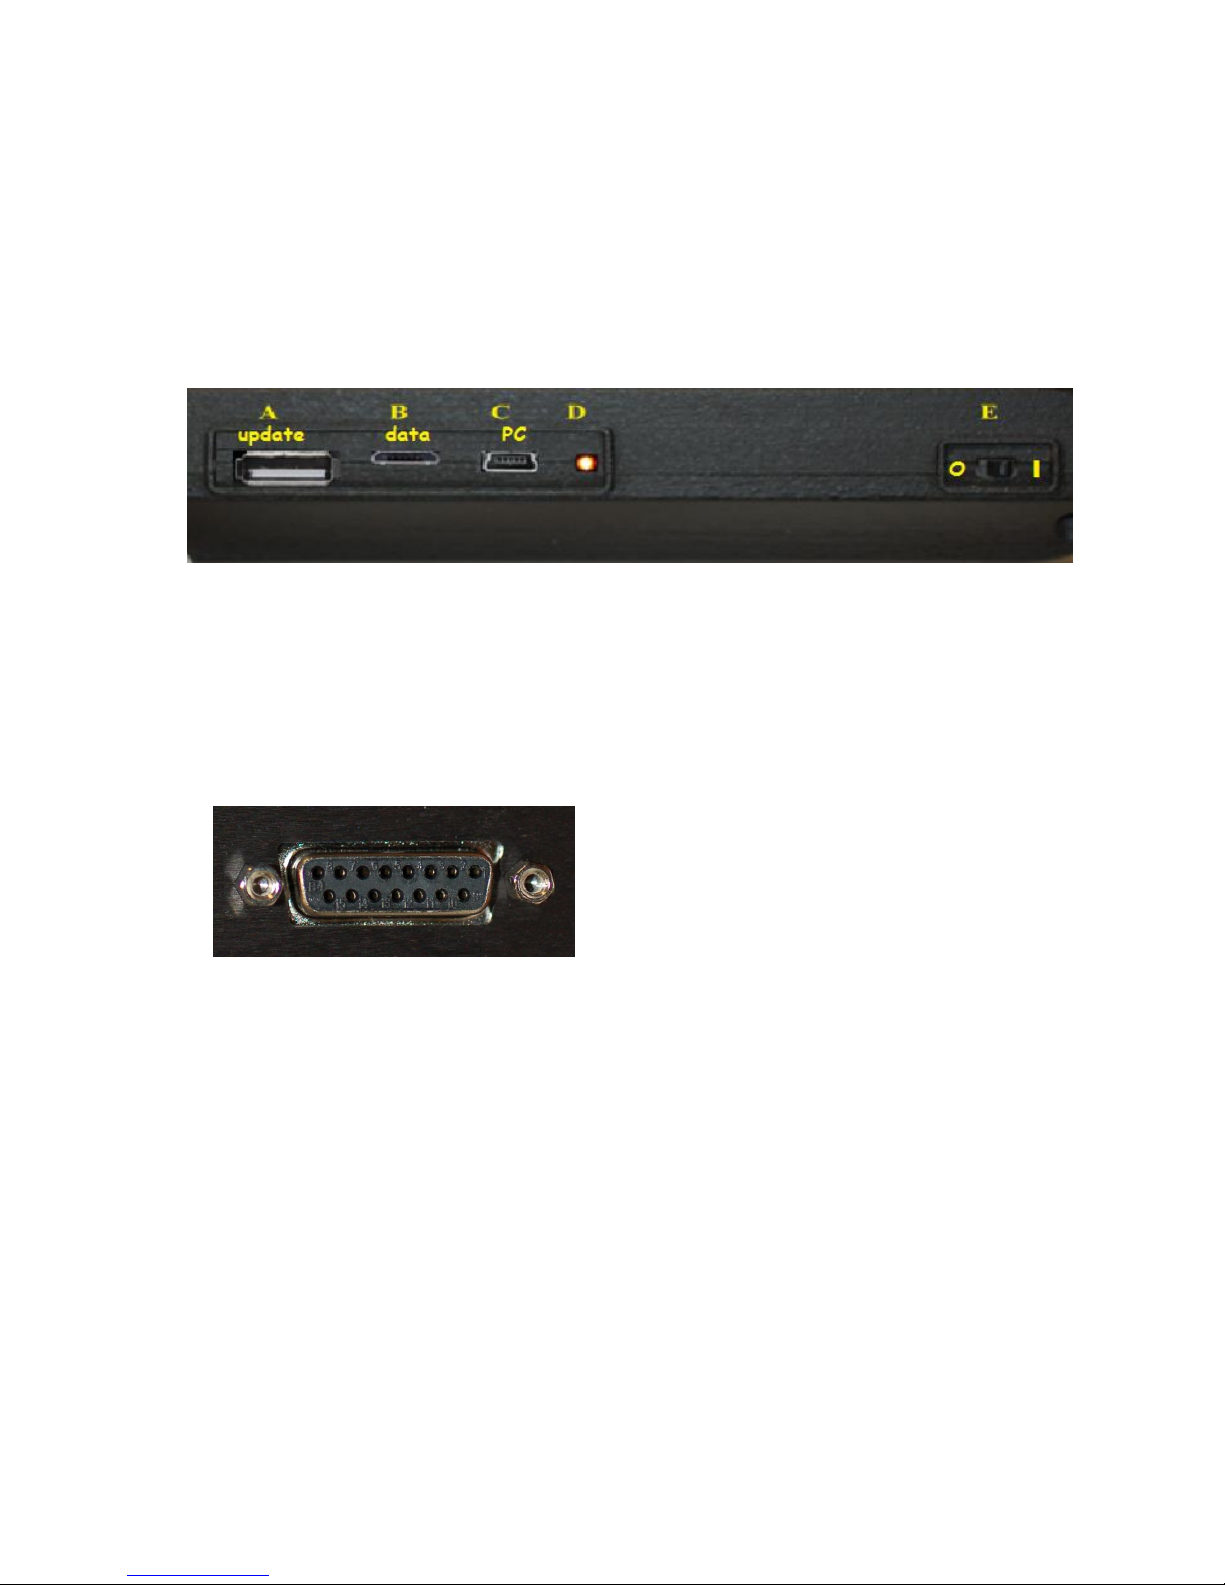
3C Side:
The right side of the meter includes:
A. USB A female port –For firmware and system updates (requires a USB stick).
B. Micro USB female port –For charging and extraction of saved data.
C. Mini USB female port –For charging the battery & running external Datalight II
software.
D. Charging LED –Light when device is charging (off when not charging)
E. On/Off –Fast Charge: Turns meter on for use. Turn off to conserve battery or for
faster charging.
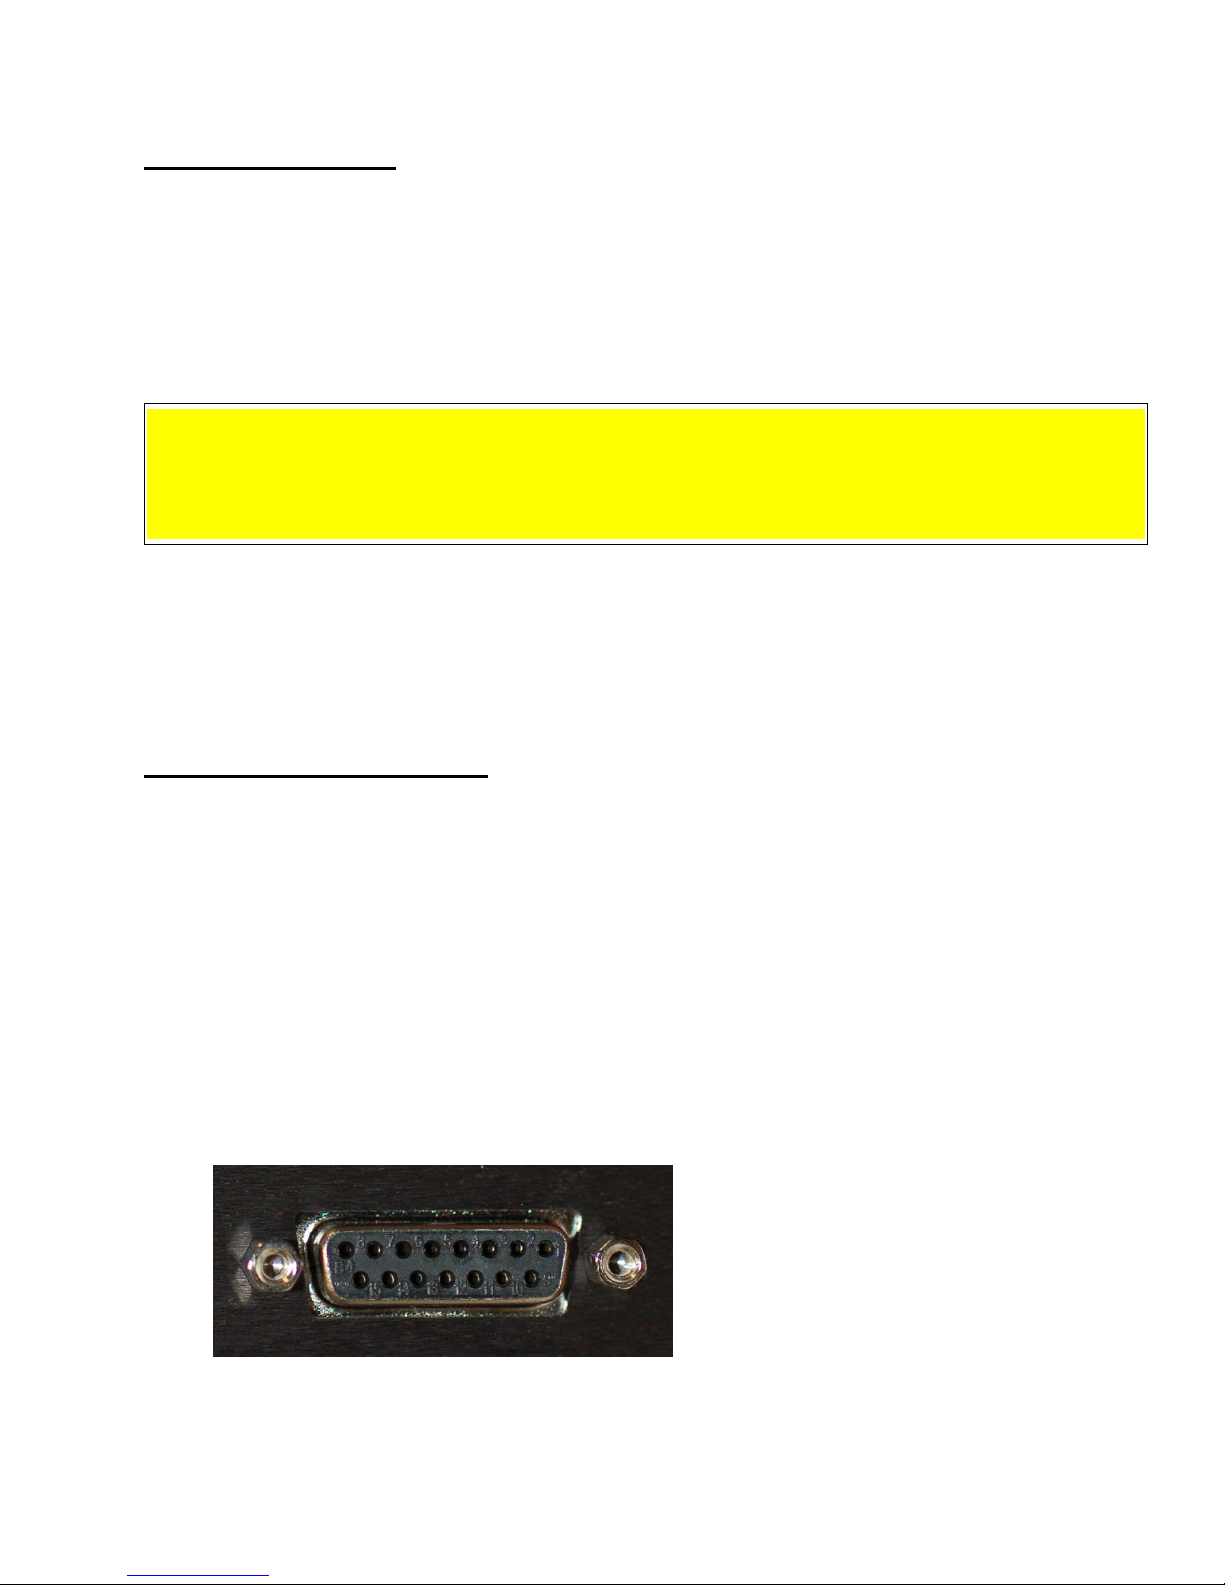
3D. Top:
Contains the sensor mount, a 15-Pin D-Sub connector and posts for securing the sensor
to the device. The JEL-2400 is backwards compatible with all “D” style sensors with the
exception of PMT's and SHD Low light level sensors. To connect the sensor, align the
sensor’s male 15 pin connector to the meter’s female connector and apply slight
pressure to insert. To assure proper connection is maintained during testing, tighten
screws on each side of sensor connector.
3E. Quick Setting Guide:
If your meter and sensor were purchased together along with optical calibrations, your
device(s) will arrive with factory pre-programmed optical calibration factors. (See 15B
Manage Calibration Factors for self-programming of calibration factors as needed)
i. Turn on the meter by pushing the On/Off button down into the ( I ) position.
ii. After a short start up menu the Home Screen will appear.
iii. Connect the Sensor/Detector to the top of the meter and secure (See 3D above)
iv. Check the power monitor window in the upper right hand corner to assure
batteries have enough charge to complete testing (see Section 4B for charging
instructions)
v. Select your display style based on user preference (touch ICON to select)
Meter: Larger numerical values and no graph.
Trend: Smaller control buttons with optional bar or line graph (see 15Ito
change chart type).
Tall: Portrait mode (USB ports and on/off switch on the right).
Wide: Landscape mode (USB ports and on/off switch on the top).

Page 5
vi. To change the display style, use the home button and touch the preferred
display style icon.
vii. The reading window will open in current mode and begin displaying
measurements in amps. Users can program their own settings to allow the
window to open with the preferred display.
viii. The display will darken after a few minutes of inactivity to conserve battery
power. Touching the screen will return the screen to full brightness based on the
brightness settings (see 15N & 15O to change display dimming/off settings).
3F. Quick Start –Common Problems:
The two most common causes of error are incorrect calibration factor use and improper
zero. It is a good practice to verify the correct calibration factor is in use before taking
measurements. It is equally as important to assure a proper zero has been performed.
3F1. Calibration Factor Verification.
Locate the calibration factor on the detector calibration certificate below the model
and serial number fields in the top third of the report.
i. From the home screen select settings, scroll to the second setting window
labeled Factor Number.
ii. Verify the sensitivity factor and factor units are correct. If not touch the selection
window and a scroll menu will appear, select a new channel until you find the
correct sensitivity factor as noted on your certificate (if you do not locate your
calibration factor and units from the certificate, go to 15B to learn about
adding/changing calibration factors)
Touch the back button to return to the home screen.
3F2. Zero:
There are two kinds of zero that can be used to improve accuracy. A dark zero is
used to remove small ambient noise caused from the environment. With the sensor
plugged in and covered with an opaque object, press the zero button. This reading
will be subtracted from all future readings to provide a zero reading. An ambient
zero is used to subtract small background light levels that are not coming from the
test source. With the test source off or blocked and the sensor exposed to the
environment/ambient light, press zero (an example of an ambient zero source is a
computer display that is needed during testing) Place the un-covered sensor in the
test location. Cover the test light source, or turn it off. Press Zero. The JEL-2400 will
take a measurement and subtract that value from all future readings until zero is
pressed again.
3G. Quick Start Feature Overview:
3G1. Display resolution:
The <-and ->buttons below the display will allow the user the control how many
digits are displayed i.e. 0.11 changes to 0.1111.
3G2. Display Units:
Toggles between the available fields; Current, Light Level, OD, and % Trans. To take
calibrated light level readings, press display units until Light Level is selected.

Page 6
Note: If light level is selected prior to selecting a calibration/sensitivity factor, an error
message Set Factor will appear in place of light level readings (see 15Q for selecting
factors). If OD and % Trans, are selected and no baseline 100% value has been set and
error Set 100% will appear see 3G8 below to learn more about setting 100%)
3G3. Integrate:
(Requires Display Units set to light level) Summation of data, records exposure/dosage
(i.e. W/cm2 becomes J/cm2 in integrate mode).
3G4. Min-Max:
Holds the display at the present value until a new minimum (lower reading) or new
maximum (higher reading) is measured, then updates the display accordingly.
Note: Min-Max also serves as a Peak FW. See section 15F Min/Max (and FW Peak)
3G5. Record:
Starts and stops (toggles between) continuous recording of readings and creates a new
file with time, instantaneous, min, max and average measurements.
3G6. Zero:
Takes a measurement and creates a zero value by subtracting the zero measurement
reading from all future readings (see 3F2 above to learn more about assuring an
accurate zero).
3G7. Hold:
Freezes the numerical display value on screen.
3G8. 100%:
Takes a measurement and saves it as the 100% baseline for Transmission and OD.
3G9. Capture:
Takes a single measurement. Captured measurements are appended to the single
sample file.
3G10. Quick Start Care and Handling:
i. Always store the meter in the carrying case when not in use and only ship in a
carrying case with protective packing to prevent shock and damage. No items
should be placed above or below the meter inside the carrying case.
ii. Do not expose meter to direct sunlight or high heat sources as the internal
temperature can rapidly increase and cause erroneous readings and damage.
iii. Standard operating temperature is rated at 0 Deg C to 40 Deg C.
iv. Do not apply any force to the display.
v. Do not apply pressure to extended stand.
vi. Opening the housing voids warranty. Housing is not water-tight; avoid moisture,
liquids and chemicals.
Page 7
4. Internal Battery Pack:
4A. About:
The JEL-2400 contains a 3.7V 5500mAh rechargeable lithium-polymer battery pack. A
new, fully charged battery pack will typically provide 4-8 hours of continuous use
(depending on display brightness settings and other feature settings).
4B. Charging:
Charging the battery is done through the USB 3.0 mini or micro port.
WARNING: The battery pack in the JEL-2400 is expected to last for many years (up to 500 charge
cycles). Batteries should only be charged, stored and used in temperature between 0 Deg C to 45
Deg C, or expansion and damage can occur. Battery packs should only be replaced by trained
personnel. Changing of the battery pack by end user voids the warranty and can cause damage to
the pc board.
The power source can be supplied from a computer, a power bank, a charging hub, a
wall-wart or any USB 2.0 or 3.0 device. A full charge is obtained in approximately 12 - 14
hours. Meter will charges the fastest when the power button is in the off position. The
JEL-2400 circuit is design to prevent over charge. The JEL-2400 has a low power
indicator that will advise when the battery needs recharging.
5. Sensor Connector and Wiring:
The 15 pin D Sub miniature connector on the top of the JEL-2400 was selected to allow
backwards compatibility with existing D sensors. Future JEL-2400 sensors will be
supplied with an internal memory chip inside the D-sub connector that includes the
model and serial number of the sensor as well as calibration information. The JEL-2400
will have the ability to read the smart detector information and apply the proper
calibration factor to be used during testing.
The D-sub not only receives the current generated by the sensor after exposure to light,
it also supplies reverse 5 or 9 volt bias to sensors requiring bias for power and/or to
improve response time. The D sub connector is not limited to only measuring devices
manufactured by Jelight. Any solid state device that generates current from 50 pA to 1
mA can be connected to the JEL-2400 for measurement of current. Please see wiring
diagram below:

Page 8
Wiring diagram for D sub Connector
Pin
Description
Pin
Description
Pin1:
-9 Volts
Pin9:
Shield
Pin2:
I2C SCL
Pin10:
SODIMM_85
Pin3:
I2C SDA
Pin11:
SODIMM_97
Pin4:
3.3Volts
Pin12:
PWM_B
Pin5:
GND
Pin13:
External Analog In 1
Pin6:
Det. Cathode
Pin14:
External Analog In 2
Pin7:
Det. Anode
Pin15:
N/C
Pin8:
5 Volts
Warning: please consult with a technician before connecting a current generating device that
could exceed 1 mAof current to prevent risk of damage to the sensitive measurement circuitry.
6. USB Ports:
There are three USB ports on the side of the JEL-2400 device.
UPDATE: Is used for code updates and requires the use of a memory stick. (not
included)
DATA: Accesses the internal 4 Gb memory device where data is saved and to charge
the battery. The Micro USB is used to download stored data and to erase data from the
memory device. This port can also be used the charge the battery.
PC: The Mini USB port is used to connect to a computer and to charge the battery.
7. Display:
The Display is a full color 4.3" Capacitive TFT Touch screen display. Contact with sharp
objects will damage the display. A stylus or finger is recommended for changing settings on
the display. Care should be taken when packaging and storing the meter to assure no
pressure is applied to the surface of the display.
Do not expose the Heat Sources, Strong UV Sources, liquids or Chemicals.

Page 9
8. Current Measurement and Limitations:
The JEL-2400 provides accurate/calibrated measurements in the 50 pico-amp (pA) to 1
milli-amp (mA) range and can be manually fixed to a specific range, or automatically
change to the correct range as the light level changes, using the auto range feature.
8A. Low Level Current Measurement:
Though the system can measure as low as 1 pA of current with a resolution of 0.61 pA,
measurements in this range will have a much greater uncertainty and should
considered as relative measurements due to the potential for noise and instability. To
determine the current range prior to or during test, user can select current in the
Display Units feature (see 14). To determine the current range post measurement, user
can multiply the reading by the calibration factor to calculate the current level used.
Important Note: When measuring below 100 pA customer should:
i. Use the “User Dark” (aka “Zero”) function to ensure the unit is properly zeroed in
the same environment where measurements will be taken.
ii. Allow extended settling time.
iii. Limit noise and temperate changes in the environment.
8B. Saturation:
The JEL-2400 provides an autorange mechanism allowing it to measure over 8 decades
of current and/or light levels. While autoranging the JEL-2400 can experience
saturation. When this condition occurs the display will provide a “SATURATION”
warning. To prevent saturation, neutral density filters or apertures can be added to the
sensor, or a greater distance between the sensor and the source can be used.
Note:“D” type sensors have been designed to assure a safe current value is supplied
to the JEL-2400 so no damage will occur to the meter during saturation.
8C. Dynamic / Measurement Range:
The JEL-2400 can measure current from 1 pA to 1 mA however the recommended
range for calibrated readings is 50 pA to 1 mA. This range does not take into account
the range of current the sensor is capable of supplying to the meter. Not all sensors
allow linear calibrated measurements over this range.
To determine the operating range for a specific sensor when used with the JEL-2400,
the formula is to divide the Min and Max current measurement ranges, as noted above,
by the sensors calibration factor from the calibration certificate (see 15B for information
on calibration factors). For example:
JSED240/TD is a vacuum Phototube with a working current range of 50 pA to 1 µA
(micro-amp) and a typical calibration factor of 1.21 e-3.
Min current of 50 pA / cal factor 1.21 e-3 (A)(cm2)(W-1) = min reading of 4.13E-08
W/cm2.
Max current range of 1 µA / cal factor 1.21 e-3 (A)(cm2)(W-1) = max reading of
8.26E-04 W/cm2.
Page 10
9. Sample Time and Limitations:
There are multiple factors that affect the sampling time including the sensor’s rise time,
software selection, software settings and the method used to store, transfer or display the
data and the light levels.
The JEL-2400 can take readings as fast as 10 µsec. When using the internal computer and
display, the device can update as fast as 50 samples per second assuming the light
intensity is strong enough to allow valid measurements at the fastest settings.
10. Reverse Bias:
The JEL-2400 can supply -5V or -9V to the detector through the D sub connector. The 5V
bias can be used on silicon sensors to increase the response time. Bias voltage is required
to supply the necessary voltage to sensors containing Photomultipliers, and Vacuum
Phototubes. See settings to learn more about applying the bias.
WARNING: Sensors can provide inaccurate readings or be damaged if inadvertently biased.
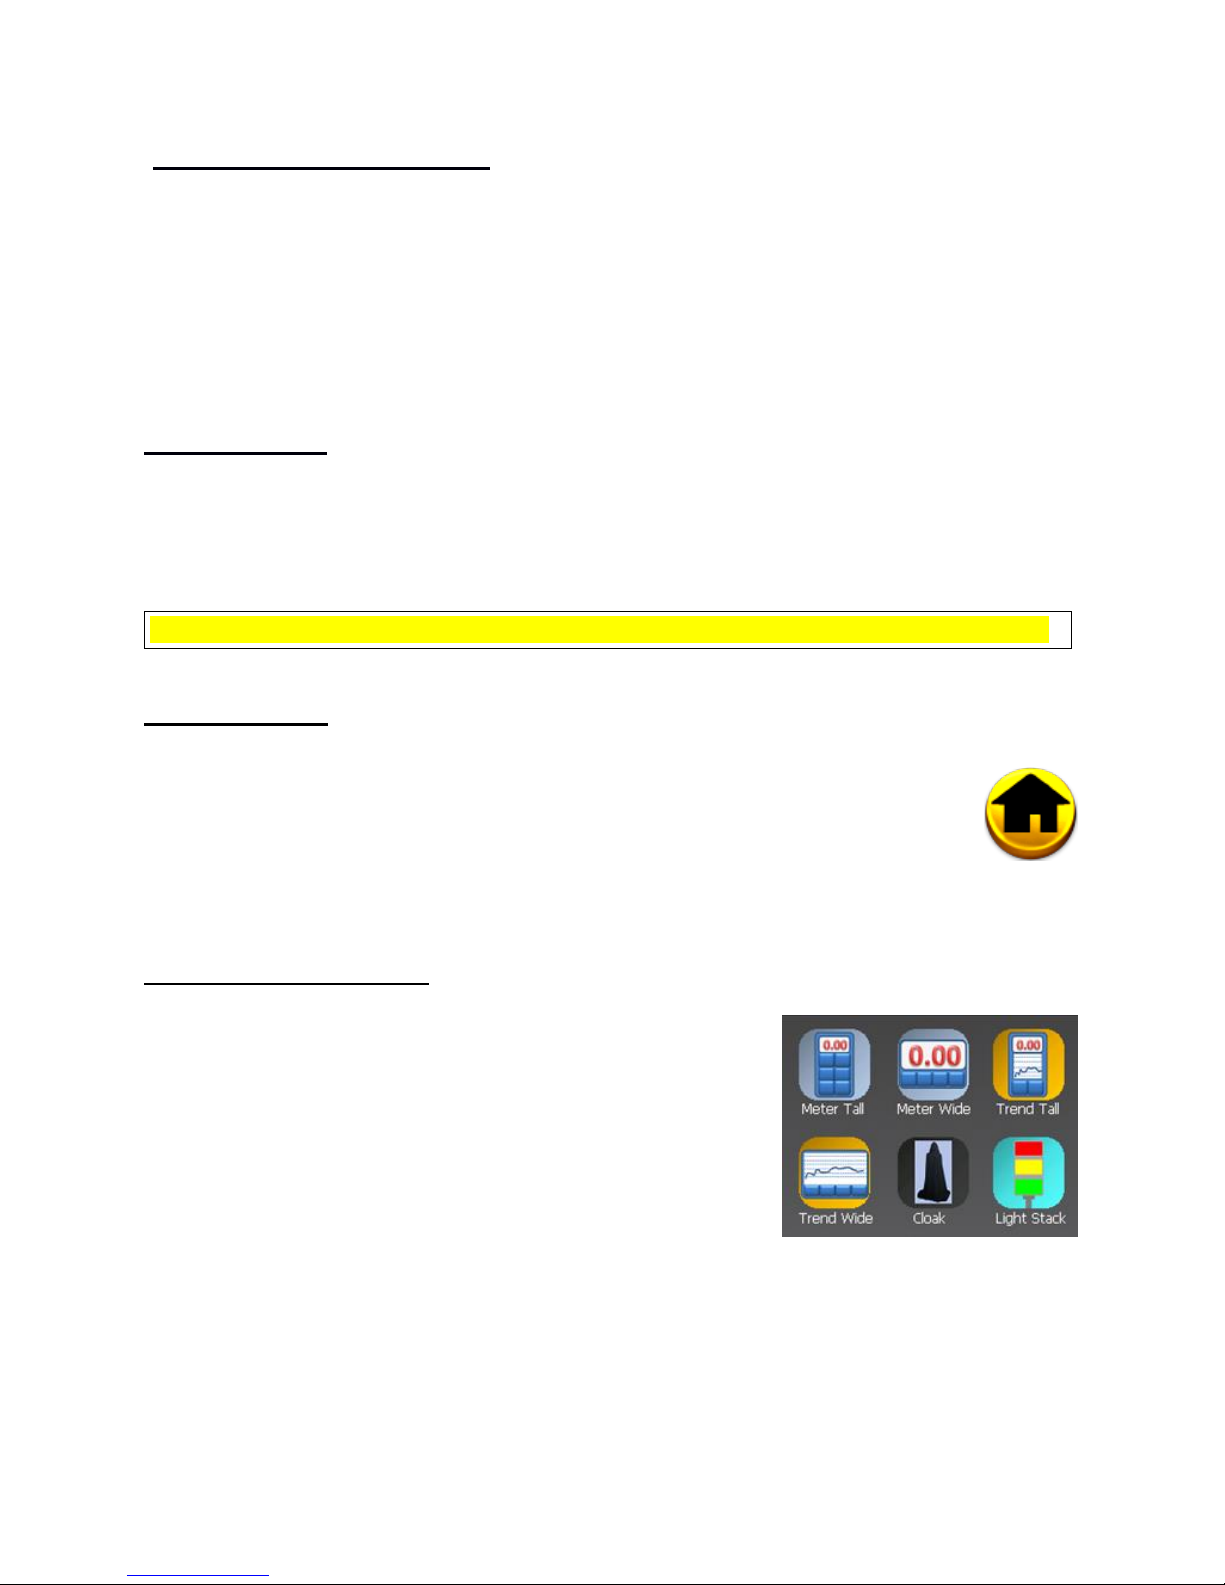
11. Home Screen:
When the meter is turned on it will take a few moments for the software
to initialize. Upon completion the home screen will be displayed. To return to
the home screen at any time, simply touch on the < Back arrow in the top left of
the display in settings screens, or touch on the home icon within a
measurement screen (note: it is possible skip the home screen by changing the
start-up app in settings)
12. Display Style Selection:
Select your display style based on user preference:
Meter Tall: Meter displays the data in numerical format
with NO GRAPH. Tall sets the display to Portrait mode
(USB ports on the right).
Meter Wide: Meter displays the data in numerical
format with NO GRAPH. Wide sets the meter to
landscape mode (USB ports on the top).
Trend Tall: Trend displays the data in numerical format
along with a chart containing a bar or line graph (see
15I & 15J to make changes to the chart settings). Tall sets the display to Portrait mode
(USB ports and on off switch on the right).
Trend Wide: Trend displays the data in numerical format along with a chart containing a
bar or line graph. (see 15I & 15J to make changes to the chart settings). Wide sets the
meter to landscape mode.

Page 11
Cloak: Cloak provides a black and white low intensity display setting to minimize light
output into the environment. This was designed to prevent light from the JEL-2400
display being included in the light level measurement. Cloak has a very large data
capture button to allow the user to easily capture and store a single reading in the dark.
Cloak does not have the feature buttons. Before entering cloak use Meter Tall for
settings (see 14 below). For example go to meter tall, click on display units for light level,
then hit the home button and select cloak. Captured measurements are appended to the
“single_sample_file”, in the format date/time, instantaneous value.
Light Stack: Light stack fills the majority of the display with a color indicator.
RED is typically used to indicate an error-unacceptable level that does not meet the
customer’s requirements. For hazard measurements, this level could be when the
light level recorded is unsafe. In other cases the level can be used as a go/no go
level indicating the a risk of product failures when intensities are too low or too high.
YELLOW is typically used as a warning stage indicating the range has changed and
is approaching the “Red” error indicator level.
GREEN indicates the readings are in the desired range.
The light level display and buttons are much smaller in the Light stack to allow a greater
viewing area for the color indicators.
Note: for error message “Light Stack is not configured” see section 15K for set up.
13. Display Content and Controls:
13A. Indicator Line:
Indicates which program is running, i.e. Meter Tall, and the battery life condition in
percentage.
13B. Display content:
The content note, located above the display, indicates
which display units have been selected by the display
units button, followed by the units of calibration and on
the far right is the settings access icon.
13C. Resolution Adjustment:
The Left button <- .000 increases the number of digits shown in the numerical display
the right button ->.00 decreases the number of digits.
13D. Display Graph:
In trend, the graph displays the average light level since
the last reading. The graph continues to update even
when Hold is pressed. Graph can be set to update as fast
as .1 seconds or as slow as once per hour. Note: See
15I & 15J for setting bar or line graph.
Page 12
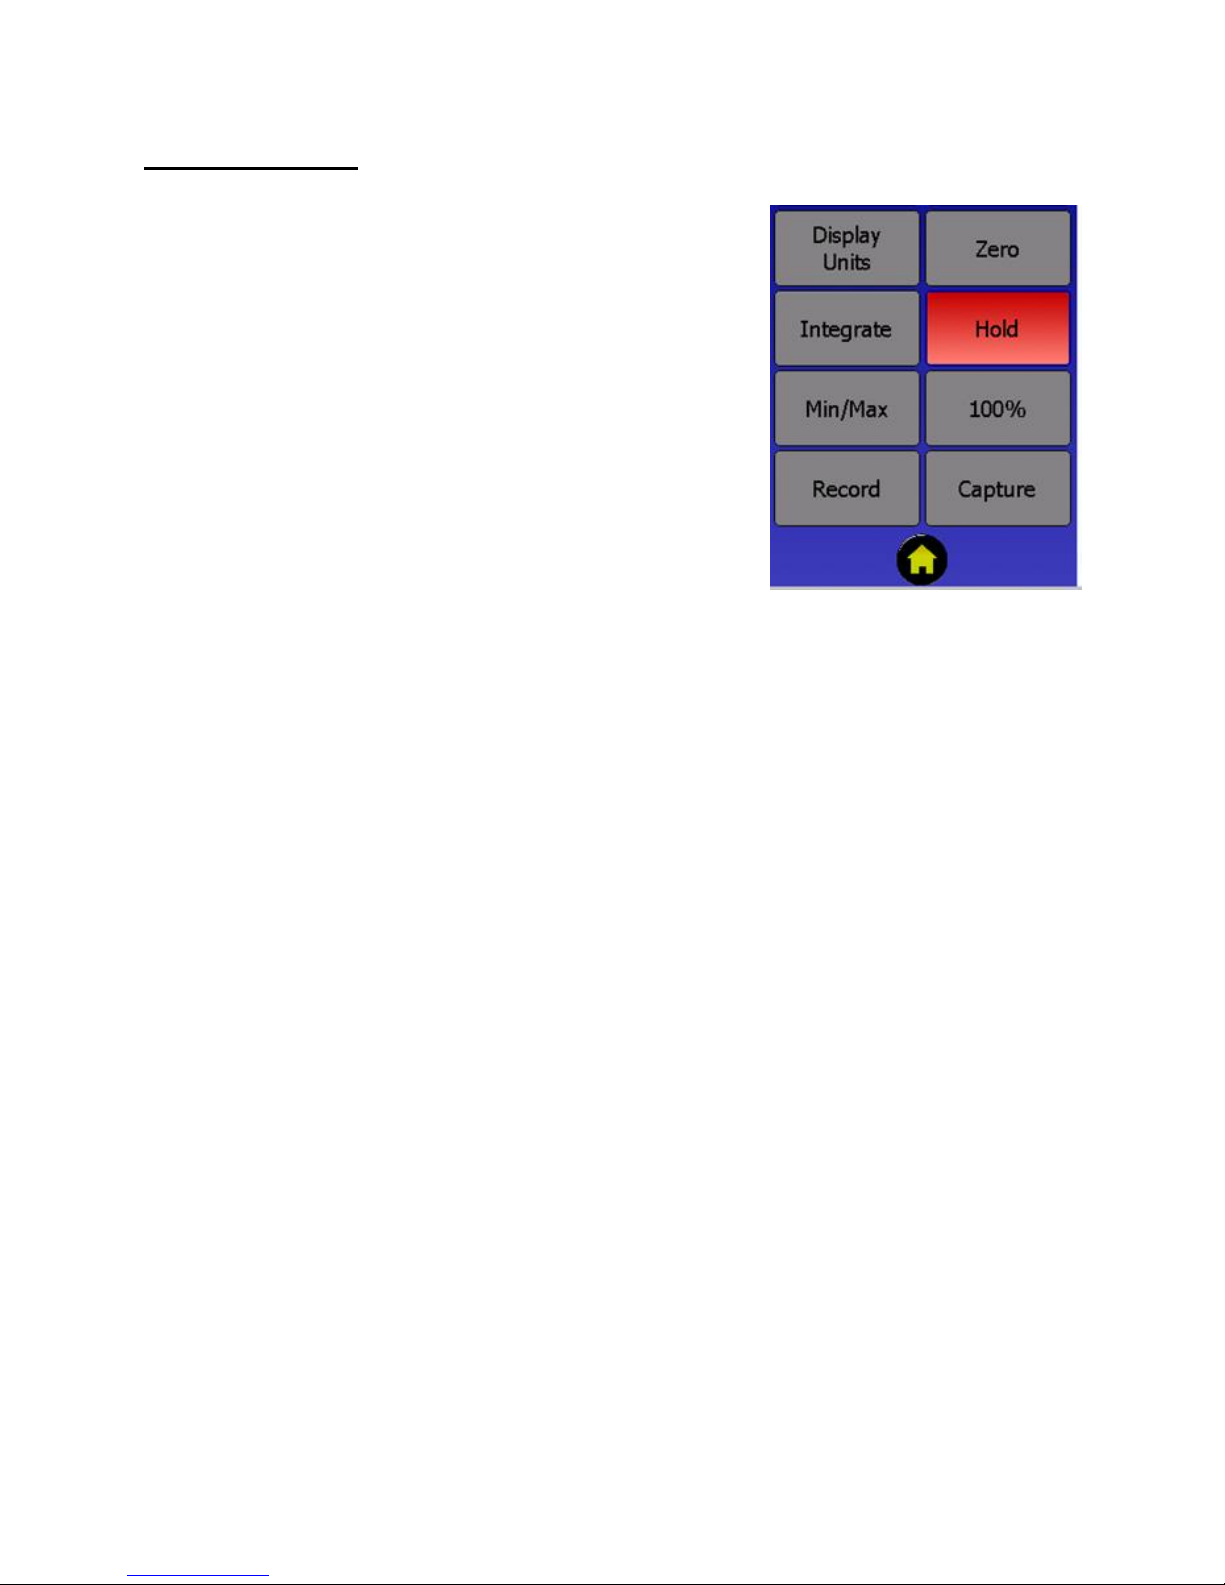
14. Feature Buttons:
14A. Display Units:
Toggles between the available fields;
Current (output is in amps).
Optical Density: compares the incoming signal
to the saved 100% reading to provide an OD
between 1 and 4.
Transmission: compares the incoming signal to
the saved 100% reading to provide a reading of
% transmission.
Light Level: converts the incoming current from
the sensor to calibrated readings in appropriate
units such as lux, fc, W/cm2, Watts etc. Based
on the user selected calibration factor (see 15B
for selecting calibration factors and 15Q for
adding/programming calibration factors).
14B. Zero:
Takes a reading in amps and subtracts that current value from all future readings. Any
value below the stored value will be shown as a Zero reading. When measuring small
light or current levels, it is a good practice to zero in the environment of the testing and
perform period zero validation or re-zero when the conditions in the environment
fluctuate (temperature, noise, ambient lighting).
14C. Integrate:
Is used to measure dosage or exposure. When toggled on, the JEL-2400 will take the
present reading and add it to the previous value, once per second, creating a sum of
light measurements over time. When in integrate mode the units of the readings change
to include *seconds. For example, Lux becomes lux*seconds, W/cm2 becomes
W/cm2*seconds or J/cm2, W/m2 becomes J/m2.
14D. Hold:
Freezes the value on the numerical display to allow manual recording (does not apply to
graph)
14E. Min/Max:
Toggles the numerical display to only record a value that is:
Min: less than the existing value on the display.
Max: greater than the existing value on the display.
14E.1 Min/Max:
Also doubles as a Peak FW button. Peak FW is similar to Max, except it pushes the
limits of the system’s rapid measurement capability and uses the firmware speed to
scan for changes that occur very fast.
14F. 100%:
Records the baseline value for 100%. This does not impact the display. To readout in
percentage you must use the Display Units button to select percentage.
Page 13
14G. Record:
Toggles Record to on and off. When on, the meter stores all readings internally. When
off the meter stops saving readings to the internal memory. Recorded measurements
generate a new file each time the record start button is touched. The format for naming
recorded files is day-mon-year. Record creates a five column .csv file with Time,
Instantaneous, min, max and average results.
14H. Capture:
Records a single reading at the time the Capture button is pressed. Captured
measurements are appended to the single sample file, in the format date/time,
instantaneous value.
14I. Home:
Returns to the home screen.
15 Settings:
The settings icons open the settings display which allows for user customization.
Settings can also be accessed by clicking on the setting drop down menu in the
display screens.
15A. Display Brightness:
Brightness selection ranges from 1-Dim with lowest battery consumption, to 10-Brightest
with highest battery consumption.
Radiometer Settings
15B. Calibration factors:
15B1. Meter Factor:
Selects calibration factors from the pre-programmed/available list ranging from 1 –
20. Factor selection allows readings in calibrated units such as W, W/cm2, Lux etc.
15B2. Smart Detector Factor:
Smart detectors can also store up to 20 calibration factors. In order to use, or create
cal factors that are saved in the sensor connector, Use Smart Detector Factor must
be enabled, in 15B3.
15B3. USE Smart Detector Factor: ON/OFF
ON enables use of the sensor’s cal factors. Off only allows customer to use factors
saved in the JEL-2400 meter.

Page 14
15C. Sample Time:
Allows the user to program how fast the meter takes a reading ranging from 100
milliseconds to 5 seconds with the default set to Auto.
i. Auto will review the incoming signals intensity and apply the best settings (faster
with higher light levels, slower for smaller signals for better averaging). As a general
rule, if current >= 1uA, 0.5sec is used, if current <1uA, 1.0sec.
ii. FAST samples at 20ms (50Hz).
Note: Using trend at fast speeds taxes the CPU with processing both measurements,
numerical updates and graph updates. This can be seen as a slight flicker on the
display. If this problem occurs, use meter (no graph) or connect to the computer and use
Datalight III Meter or Flash.
15D. Auto Gain Range:
On or off. The JEL-2400 has 3 relays that it cycles through when auto ranging from the
lowest signals in the Pico amp range to the higher signals in the micro amp to 1 milli-
amp range. Auto allows the software to control when the device will change from one
relay to the next to allow the most accurate results based on incoming current levels.
Auto Gain Range - off requires the user to set the range they will stay in during
measurement (see 15E below for information on setting the range.)
15E. Gain Range:
When Auto Gain Range is set to off in section D above, Gain Range becomes
accessible. The user can select the range based the max current to be measured i.e; 1
mA, 3uA or 300 nA. Each relay allows the JEL-2400 to measure approximately 3-4
decades with the max being the saturation point and noise become problematic as the
reading approaches .0005 from the max.
To determine the range of current that applies to a specific light level reading, the user
can select current in the display units (see section 14A for instructions) or multiply a
previous reading by the calibration factor used to obtain the reading i.e. 1mW/cm2 (1e-3
mW/cm2) with a calibration factor of 1e-3 (A)(cm2)(W-1) =.000001 amps, 1e-3 * 1e-3.
15F. Min/Max (and FW Peak):
The min-max settings allow the user to change the functionality of the min-max button.
When in Min/Max mode, the reading will only change for Max when a reading that is
higher than the displayed value is read, and for Min when a reading that is lower than
the displayed value is read.
When FW peak is displayed the Min/Max button will change to a FW Peak button. FW
Peak uses the fastest scanning speeds to see rapid changes in light intensity and uses
less averaging. For Very Fast moving light sources such as scanning lasers or pulses of
light, use FW peak. For better averaging we recommend using Min/Max when speed is
not a factor.

Page 15
15G. 5V Bias On or Off:
The default setting is off as there are numerous sensors that can be damaged or read
incorrectly if bias is applied. When turned on, the meter will supply reverse bias to any
sensor plugged into the device (see section 5 for pin out information pertaining to bias)
Silicon sensors such as the JSED033, JSED100, JSPD025Y, and the JXRL series can
be biased when measuring flashing or rapidly changing values to increase response
time. JSED240, JSED220 and JSED185 Vacuum phototubes require the bias to be
turned on to obtain the needed power.
WARNING: Sensors can provide inaccurate readings or be damaged if inadvertently biased.
Recording to File Settings
15H. Recording Interval:
Ranges from 1 second to 1 hour, or sample for faster speeds.
Sample: when selected, the record interval and sample time are synched i.e. if sample
time is set to .1, the meter will record a value every .1 seconds.
Trend Chart Settings
15I. Chart Type:
Select a bar graph or line graph.
15J. Update Interval:
Select the time between updates to the display from .1 sec to 1 hour.
Error and Warning Level Settings
15K. Light Stack Setting:
Settings for light stack will determine when the screen turns
Red, Yellow, and Green.
Trigger Type: triggers that will initiate a change in the
indicator color:
Not used: An error will appear if light stack is
selected when not used is applied.
Low: Used when a reduction in light output causes
an error i.e. phototherapy, under cure of product,
Display testing, QC.
High: Used when an increase in light output could
cause an error i.e. optical hazard, over curing,
photodegradation, LED lamps QC.
Range: For when a rise or fall of light level can be
problematic i.e. binning of LED's, lamp QC.
Warning Level: Threshold for turning the display Yellow.
Error Level: Threshold for turning the display Red.

Page 16
Set up error messages:
i. The target/warning/error levels need to be numbers.
ii. For Low trigger, the error level must be less than the Warning level i.e. target is 1
mW/cm2 or higher (1e-3), a warning level (5e-4) (display turns yellow) when the
light level decreases to .5mW/cm2 (5e-4) or less, and an Error Level (8e-5)
(display turns red) will occur when the light falls below .08 mW/cm2 (8e-5).
iii. For High and Range, the error level must be greater than the warning level i.e.
target is 1 mW/cm2 (1e-3) the warning must be larger than 1e-3 i.e. 3e-3 or 3 mW
and the error must be larger than the warning and target i.e. .5 mW/cm2.
Other Settings
15L. Start-Up App: Allows the user to change the display style from the default “Home
Screen” to Meter, Trend, Cloak, Survey or Light stack automatically when the device
turns on.
15M. Use Scientific Notation: ON / OFF
Select from Scientific notation on i.e. 1.06e-3 W/cm2 to Scientific notation off i.e. .001
W/cm2 (2e+2 lux becomes 200 lux)
Note: the Display on the JEL-2400 allows up to 3 digits after the decimal place. When
using scientific notation on, the device can display readings as low as e-13 with two
decimal places, ie 6.23e-13.
When scientific notation is off, it is not possible to display low values such as
.000000000000623.
In order to allow the display to show values that are smaller, the calibration factor must
be adjusted to include a the proper prefix (ie pico, nano, micro) and the exponent will
need to be changed to the proper range. For help understanding scientific notation: see
chart below.
Example: Sensor has a cal factor of 4.96 e-1 for readout in Watts with a measurement
range of 2-100 uW (.000002 to .0001). .000002 to .0001 cannot be displayed with
scientific notation turned off. If the calibration factor is changed so the units are µW(1e-
6) in place of W (1e+0) the calibration factor 4.96 e-1 W becomes 4.96e-7 uW, and the
measurement range is changed from .000002 - .0001 W to 2 - 100 uW.

Page 17
15N. Dim Display After time settings:
Sets the time in minutes before the display will dim to save on battery life. Times range
from 5 min - 60 min and also includes Never.
15O. Turn Off Display After time settings:
Sets the time in minutes before the display will shut off to save on battery life. Times
range from 5 min - 60 min and also includes Never.
Maintenance
15P. Set Date and Time:
Allows the user to set the date and time which are then used to create file names and
date/time stamps on the saved .csv files as discuss in 16 above.
15Q. Manage Calibration Factors > :
Creating calibration factors and use of customer generated factors can cause
errors in light level readings. The calibration factors listed in the Optical
Calibration Certificates included are N.I.S.T. traceable and are performed in our
ISO17025 accredited lab by trained and experienced technicians. Use of altered
calibration factors can void traceability.
15Q.1. Factor Number:
Numbers range from 1-20. The JEL-2400 stores up to 20 calibration factors which
are selected using Factor number as shown in section in 15B.
15Q.2. Factor Description:
Enter a nick name, component model&Serial number, or sensor stack i.e. lux sensor,
UVC#234. (Note: spaces are converted to a “-”).
15Q.3. Factor:
Units Enter the units for the readout i.e. lux (Note: Spaces are converted to a “-”).
15Q.4. Sensitivity Factor:
Enter sensitivity factor from the calibration certificate. 2.09e-09.
15Q.5. Resulting Light Level:
Allows the user to enter a known value for the light level under test and create a
calibration factor to force the meter to read the correct value.
i.e. LED with 40 lumens is measured. Enter 40, press set. A new calibration factor
will be created to read 40 and auto-range up and down through other light
intensities.
15Q.6. Factor Adjustment:
User can enter a value to alter the calibration factor by for example if adding a
neutral density filter with attenuation of 10, enter 10 and press set. A new calibration
factor, that has changed by 10, will be entered in the next available channel.

Page 18
15R.Firmware Update >:
•Insert USB stick with new firmware file ####.hex
•Use select File to read the file from the USB stick
•Click Update
Warning: be sure the device is connected to power or has at least 20% battery life prior to
performing an update. Do not disconnect the USB memory device until the update is complete.
Do not turn off during a firmware update.
15S. System Update > :
•Insert USB stick with new System Update file ####.bin
•Use select File to read the file from the USB stick
•Click Update (system will automatically re-boot)
Warning: be sure the device is connected to power or has at least 20% battery life prior to
performing an update. Do not disconnect the USB memory device until the update is complete.
Do not turn off during a system update.
15T. Save Settings:
Permanently saves all settings to memory (until Save Settings is pressed again). When
applied a box will appear around the button to indicate completion.
15U. Restore Defaults:
Returns all datalight software settings back to the factory default values.
(Restore does not erase or alter calibration factors or any save data within the device)
16. Files:
The .csv files saved in the Files folder can be accessed using both internal software which will
display a graph of the results or downloaded using the USB micro port.
16A. Viewing Stored Readings:
Click on the Files icon. The newest recording file will automatically open in the graph.
Use the drop down menu to select a different file. If the recording is still ongoing you can
click in and out of the file (view a different file then return the ongoing measurement file)
to update the graph results in the view window. To view files created using the survey
app, scroll down to survey_data_file, to view files created using capture, scroll down to
single_sample_file.

Page 19
16B. Downloading Stored Readings:
When the JEL-2400 is connected to the computer using the USB micro cable, the
computer will register the JEL-2400 as a device with removable storage, allowing
access into the Files folder. To access saved Files using a PC, click on Start, Computer
and then click double click on the “ Removable Disk ...” within “Devices with Removable
Storage”.
To open in excel, you will need to select tab or space delimited
16C. Deleting Stored Readings:
To delete files, access the files through the USB micro port. Selected the file to highlight
the then press delete.
17. Light Calc:
Includes some basic light measurement formulas for converting between units of
measurement such as foot-candles to lux, lux to candela, W/m2 to W/cm2 etc. i.e. enter
1.11 W/cm2 reading obtain a calculated reading of 1.11e+4 W/m2.
For lux to Candela, enter lux value and the distance in meters.
18. Sleep:
Manually sets the screen to dark to conserve battery. Simply touch the display at any
time to turn off sleep mode and re-illuminate the display.
19. Survey:
The built in survey application allows customers to apply an address or note, which will be
added to the date and time stamp for captured readings. Captured readings will be used to
create a .csv file which can be downloaded and used to create a light survey report.
i. To start a survey, touch the survey Icon. Survey opens in Portrait mode and
automatically displays readings based on user programmed parameters. (Similar to
Meter Tall).
ii. Touch the “Select Location” box to open the drop down selection window.
iii. To choose and existing address: Use the scroll bar to highlight the address. Touch the
address to apply. The address will not show in the Select Location box.
Note: Addresses can also be imported into the JEL-2400, by creating a custom Survey-
locations.txt and uploading through the USB micro port.
iv. To Add or Delete of the addresses list and touch Add/Delete location.
Page 20
v. To Delete: Touch inside the grey the drop down menu from the top box, move the
cursor to the location that is to be removed, touch the location to apply, with the box
showing the location, touch the “Del” delete button. The Delete buttons border will turn
blue to indicate completion. If you want to back out of Delete, scroll to the top and
select the blank line above the addresses.
vi. To Add: touch inside the white add box. Use the keyboard to add an address or a
note. Touch the Add. The add border will turn blue to indicate the new address has
been saved.
vii. When done adding and deleting addresses, touch the < Back button.
viii. To apply an existing location click in the Select location box. Use the scroll bar to
highlight the address. Touch the address to apply. The address will now show in the
Select Location box.
ix. To save reading(s) touch the capture button. Readings will be saved to the
Survey_data_file.csv file, accessible via the USB micro port.
20. Info:
Lists product and software settings including model no, serial no, calibration information,
software and firmware information and user programmable selections such as sample time,
range selection etc.
21. Upgrades:
Software and firmware upgrades can be completed by the end user, as needed.
1.Download the software onto a USB stick (not provided)
2.Turn the Meter on, allow initialization to complete and verify the battery life is above 20%
(no USB devices should be plug in during initialization)
3.Insert the USB stick into the USB A port on the side of the JEL-2400.
4.Click on Settings, and Scroll to the bottom of setting window.
5.Click on the firmware update box.
6.Select the file using the drop down arrow selection box.
7.Click the Update button and wait for the process to complete.
Table of contents


