KVANT SPECTRA User manual

SPECTRA
USER MANUAL

1
CONTENTS
COMPOSITION OF THE TEACHING AID 2
SPECIFICATION AND USE OF THE DEVICE 2
Technical Specifications 3
SOFTWARE INSTALLATION 3
HOW THE SPECTROMETER WORKS 3
CALIBRATION 5
USER INTERFACE 6
THE MAIN SCREEN 6
1SPECTRUM SETUP 6
2SPECTROMETER CONTROL 7
3GRAPH 8
4GRAPH SETTINGS 8
5SPECTROMETER CALIBRATION 11
MEASURING 14
EMISSION SPECTRUM 14
REFERENCE SPECTRUM, DIFFERENCE 15
REFERENCE SPECTRUM, RATIO 15
EMISSION SPECTRUM –calibration sources 16
SYSTEM REQUIREMENT 17
RECOMMENDED SYSTEM REQUIREMENTS 17
SOFTWARE (OPERATING SYSTEM) 17
HARDWARE 17
WARRANTY LETTER 17
WARRANTY PERIOD 17
WARNING 18
DATE OF SALE 18

2
COMPOSITION OF THE TEACHING AID
Spectra (High Resolution Spectrometer) in plastic box.
Set contains:
•spectrometer with USB power cable,
•optical fiber,
•lens,
•software Spectra v5.
SPECIFICATION AND USE OF THE DEVICE
The Spectrometer SPECTRA is an easy-to-use USB spectrometer, which allows the recording and evaluation
of spectral properties of sources, transparent and light-reflecting surfaces of various materials in the range of
wavelengths 380 - 900 nm. The device is supplied with an optical fiber with SMA connectors and a collimator.
The spectrometer does not need a separate power supply, it is powered via the USB port of a personal computer
and the SPECTRA v5 software controls it.

3
TECHNICAL SPECIFICATIONS
Sensor: 1/3" Color CMOS Sensor Graphics resolution: 1.3 M, 1280 x 720 pixels
Spectral range: 380 –900 nm Optical resolution: < 1.5 nm FWHM
S / N ratio: 45 dB (full signal) A/D resolution: 8-bit Frequency
SOFTWARE INSTALLATION
BEFORE YOU START INSTALLING THE PROGRAM, MAKE SURE THAT THE PERSONAL COMPUTER ON WHICH
THE PROGRAM IS GOING TO BE INSTALLED MEETS THE INSTALLATION REQUIREMENTS (CHAPTER SYSTEM
REQUIREMENTS).
1. Before installing the spectrometer, uninstall all previously installed versions of the application.
2. Download the installer from https://www.kvant.sk/apps/spektrometer/spectra.exe
3. Choose a location to store your application files, follow the on-screen instructions, and proceed with
the application installation.
4. Connect the spectrometer to the USB port (if it is not already connected).
5. When the spectrometer is connected to the computer, the system detects the new USB device and
configures it automatically.
HOW THE SPECTROMETER WORKS
Light enters the Spectrometer through the SMA connector or via a flexible fiber optics cable. The light passes
the entrance slit, grating and through an objective lens it hits the surface sensor of the USB camera. The
specially selected transmission grating with fine trimmed entrance slit guarantees the high resolution and good
reliability of the results.

4
The lens displays an entrance slit in the spectral components of the input light to the camera sensor. The camera
record can be used as a current source of information or for analysis without the use of a camera after saving
in image format. The height of the spectrum corresponds to the enlarged image of the entrance slit and it is the
same for each spectral component. The spectrum covers approximately 1/3 of the camera recording area. The
part of the record highlighted with a white strip is graphically evaluated. Its position and width can be selected
in the software (spectrometer control).
The SPECTRA spectrometer from KVANT is intended for teaching and qualitative analysis of spectral
properties of various types of substances and light sources.
As the light detector, a CMOS sensor with an RGB colour registration is used. It generates R, G, and B signals
with values between 0 and 255 (8-bit digitalization of the electrical signal level. The advantage is an acceptable
price and a suitable communication protocol for processing the measured data.
The graph below (the light intensity versus pixel number) shows the RGB outputs of the Spectrometer when
recording the spectrum of a white light source.
For creating a final spectrum, the total light output is interpreted as the maximum value of maxRGB components
R, G, and B. This may be seen as a limitation of this measurement technique because the final spectrum is not
smooth but has “valleys” as shown on the graph below. It can be removed by mathematical adjustment
(correction in the spectrometer control section).

5
The correction - the alignment of the RGB envelope is adjusted by the optimal polynomial.
The Spectrometer delivers a video image (1280 by 720 pixels) of the final spectrum. Each of the 1280 columns
of the record is assigned a wavelength by calibration. Light intensity (in a.u. units (arbitrary unit)) for a given
wavelength is calculated as the arithmetic mean of the values from the selected lines of the record.
CALIBRATION
Each Spectrometer device has its own specific 3-point
calibration written at the bottom of the device.
When the spectrometer is connected for the first time,
the system will ask you to enter calibration points. The
calibration points of the pair of px, nm written at the
bottom of the spectrometer are inserted into the dialog
window. Through these calibration points the calibration curve is translated to convert the pixels of the camera
record into wavelengths of light.
The calibration for the given device is remembered after clicking CALIBRATE and is saved for further use in
the file calData.txt, which is located in the default folder. After calibration, the spectrometer is ready for use.

6
USER INTERFACE
THE MAIN SCREEN
The main screen consists of several sections: 1Spectrum Setup, 2 Spectrometer Control, 3 Graph, 4 Graph
Settings, 5 Spectrometer Calibration.
Application user interface
1 SPECTRUM SETUP
On the left side of the application is a preview window where the current record from camera or folder is
displayed. The position and width of the selection for graphic display are visible.
Selected part of the current record with saturation signalization of graph is displayed at the top of the
application. When the signal is oversaturated, it changes colour to red.
1
3
2
5
4

7
You can select a spectrum source in two ways:
1. Select a spectrum from a file –image recording format, the path to the source file is displayed in a white
window with the name of the selected file.
2. Select a camera - current observation and graphical display of the output from the spectrometer camera.
To launch the spectrometer, follow these steps:
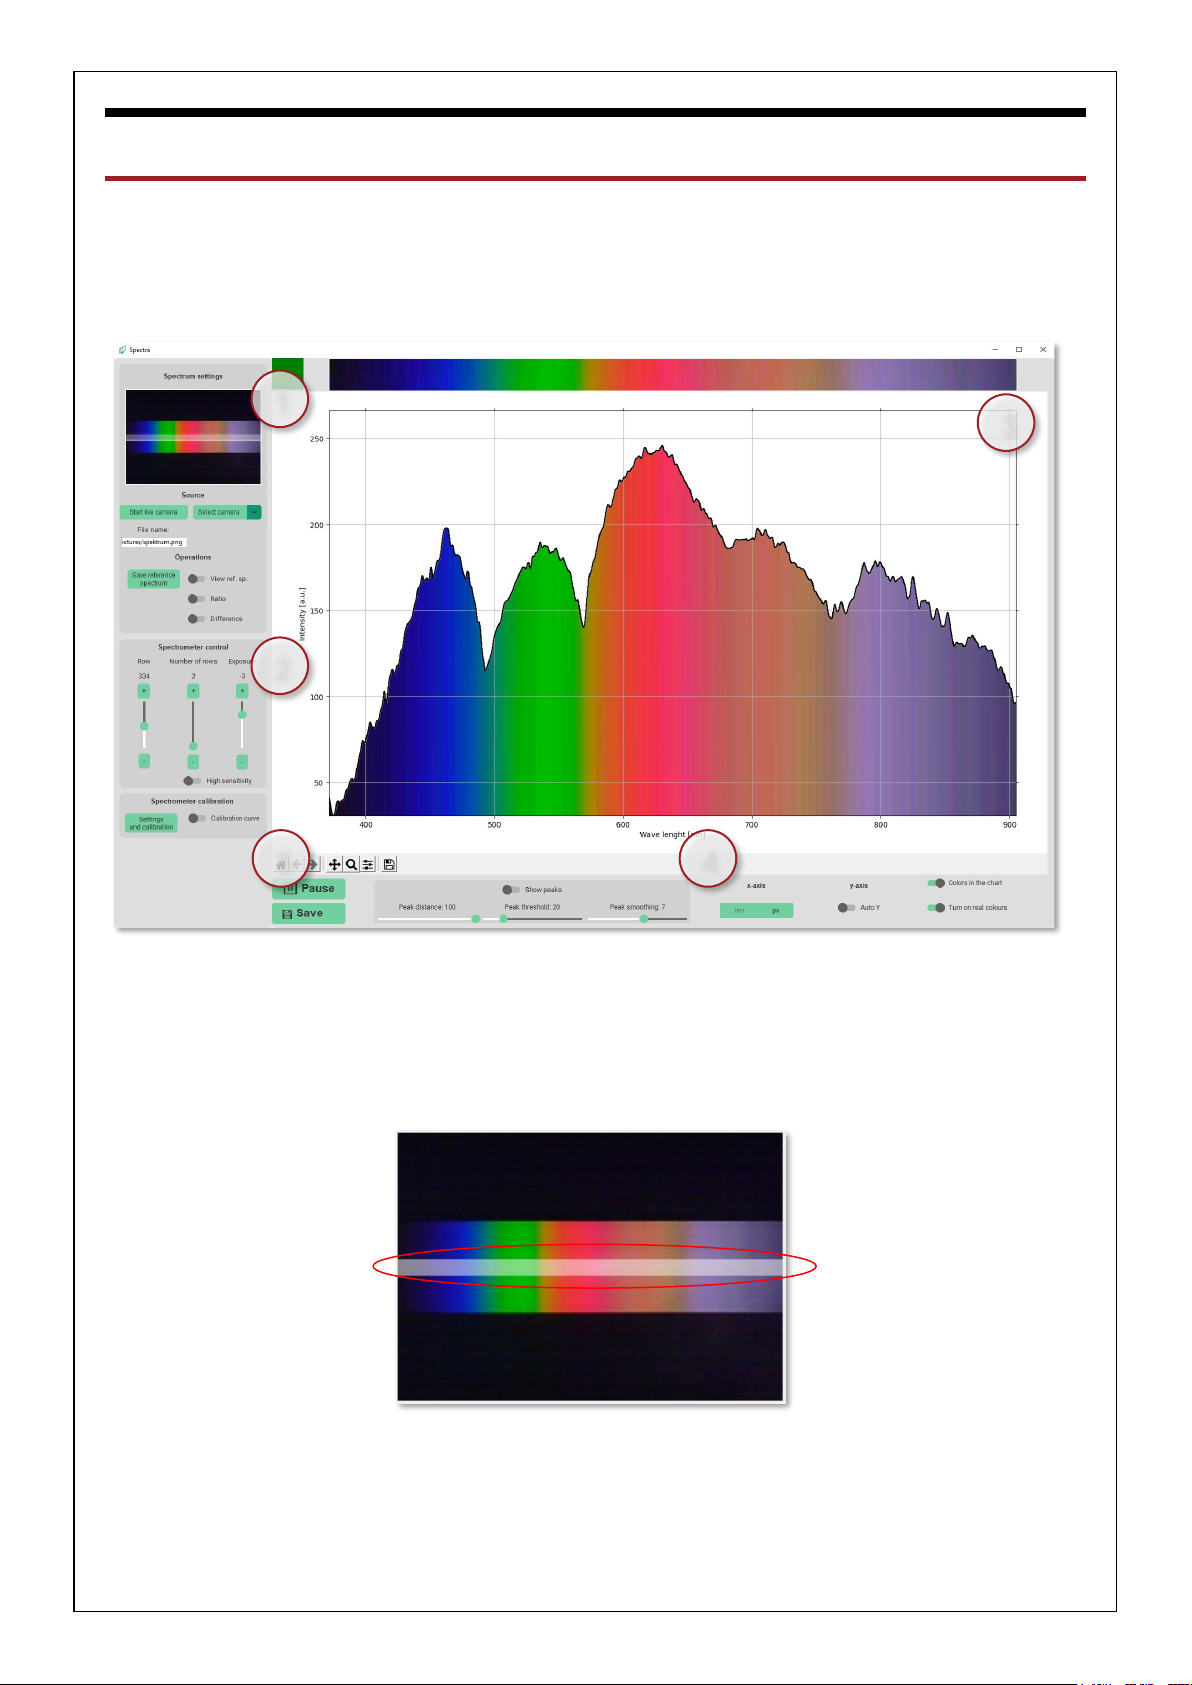
•Select a camera using the "Select Camera" button
•Current record is displayed in the upper left corner of the preview window.
•Proceed to Spectrometer Control.
OPERATIONS OF SPECTRUM SETUP PANEL
Operations with spectrum records are performed with the data displayed in the graph. The reference spectrum
is the currently displayed spectrum in the graph. The set of coordinates of the currently displayed graph is stored
in the internal memory. The ratio and difference is possible between the spectrum currently displayed in the
graph and the reference spectrum stored in the memory.
Save the reference spectrum –Save the currently displayed spectrum in the background as a reference
View ref. sp. –The reference spectrum can be displayed in one graph with the current spectrum. It will appear
in red with no inner padding when the option is turned on.
Ratio –Graphic information about proportion of current and reference spectrum.
Difference –Graphic information about difference between current and reference spectrum.
2 SPECTROMETER CONTROL
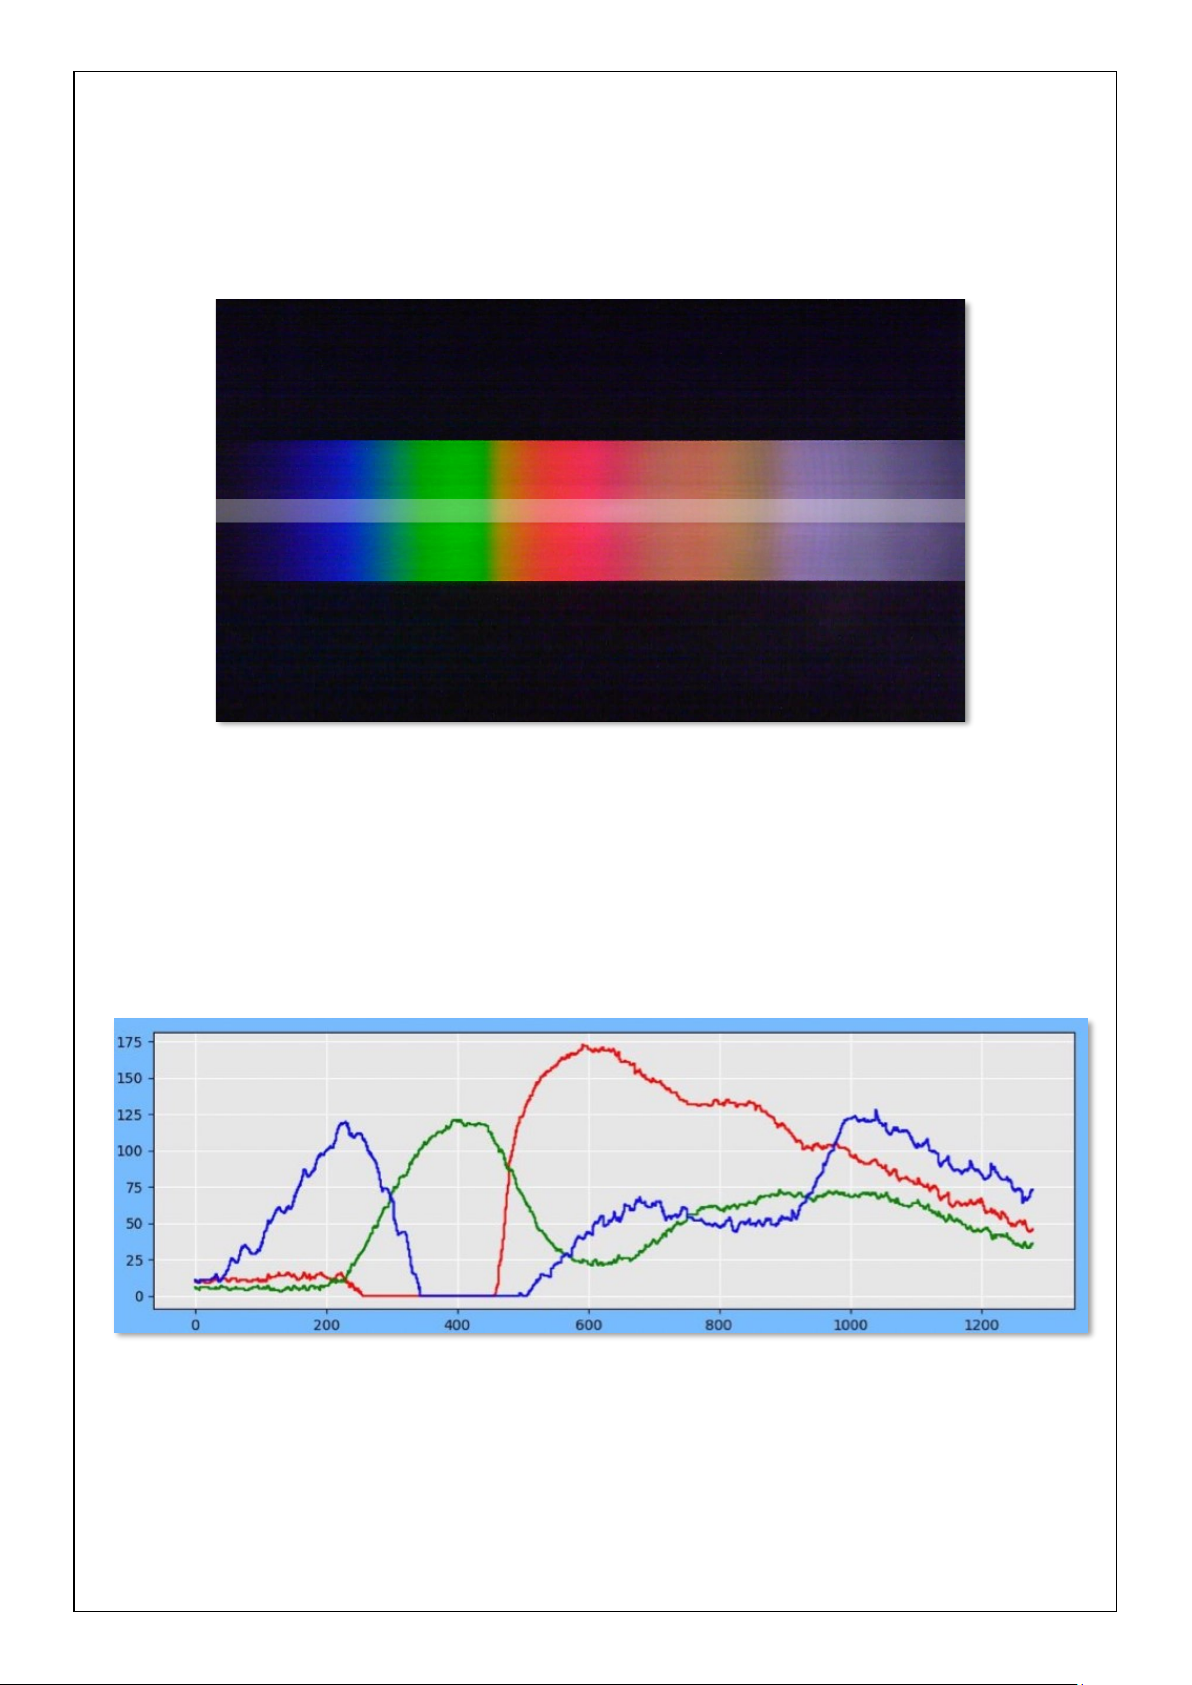
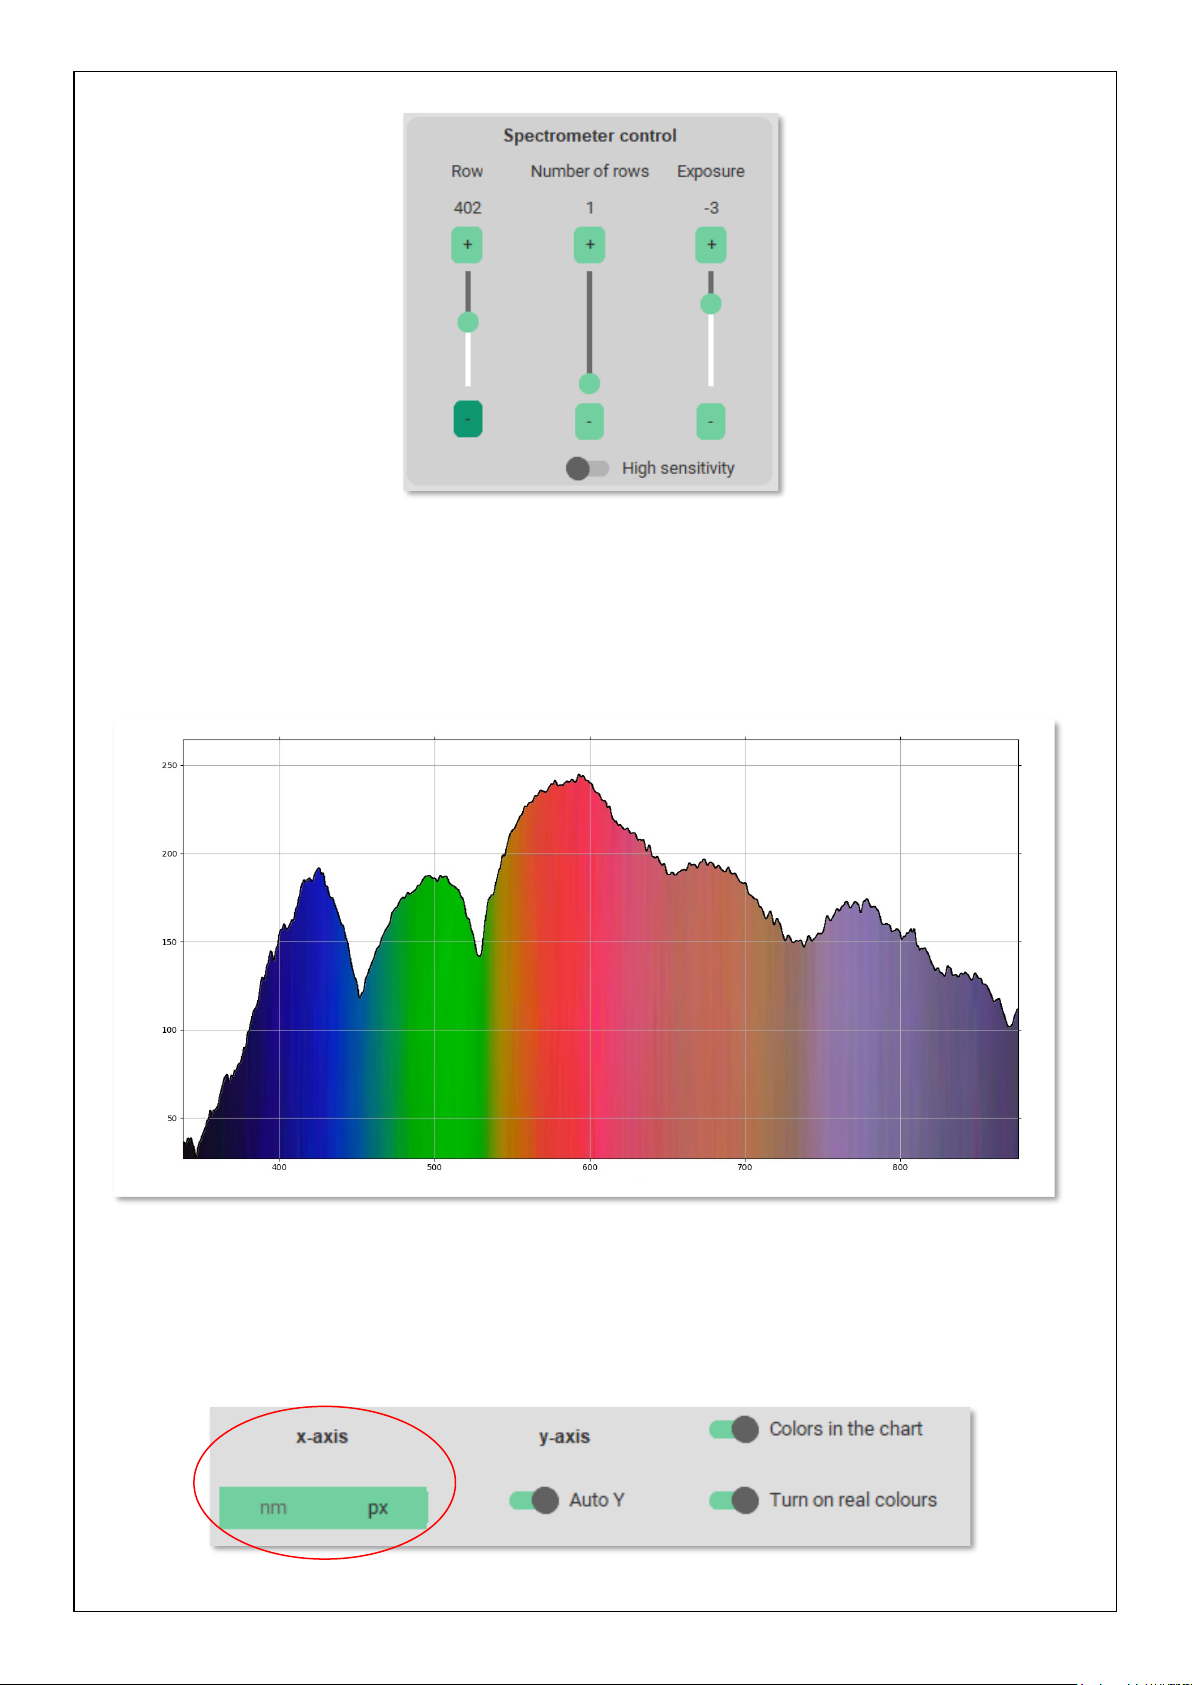
The spectrometer control panel allows you to change the position (Row) and selection width (Number of rows)
of the graphic display of the current record. The change of selection is reflected in the preview window and in
the display of its selected part.

8
When selecting the current recording from the spectrometer camera, it is possible to change the intensity with
the Exposure control element. At low intensities, the sensitivity can be increased using the High sensitivity
button.
The graphic output immediately responds to changes in the values of the control elements of the panel.
3 GRAPH
4 GRAPH SETTINGS
The graphic form of the selected part of the current record has a different form, selectable by the control
elements of the graph panel. The spectrum can be interpreted as a property of image points, recording
pixels, or after calibration of spectrum components with wavelength in nm. The change is accessible by
choosing the units of the independent variable of the graph, the x-axis.
Wavelenght [nm]
Intensity [a.u.]

9
Dependent variable, the y-axis, can be displayed in two optional modes. Automatic mode assigns the range
of the variable a value derived from its lowest and highest value in the graph. Turning off automatic mode
assigns a range corresponding to the lowest and highest value for the selected display method. For normal
graphic outputs, these are values of pixel intensities of 0-255 units.
Fixed y-axis scaling (y-axis range is fixed from 0-255 a.u.).
Automatic y-axis scaling (y-axis range automatically adjusts to the minimum and maximum measured intensity)

10
A graphical dependency can have padding under the graph curve. An artificially determined fill or one derived
from image points can be selected with the controls Colours in the graph and Turn on real colours on the
chart panel.
Peaks
The positions of the extremes, most often the peaks, of the spectral dependences have irreplaceable role when
the character of the spectra is considered. In graphical terms, the possibility of highlighting them is accessible
with the Show peaks switch. The conditions for their determination are again optional properties via the Peak
distance, Peak threshold and Peak smoothing controls.
Peak distance –Interval of variable x in which only one peak can be specified
Peak threshold –Excludes the possibility of marking a peak whose height is below a specified value
Peak smoothing –Averaging the surrounding values to determine the peak size
Graph control panel
It is located in the bottom left corner of the chart. These functions are used in suspended mode.
Home - reset the current spectrum settings
A step back and a step forward
Magnifying glass - zoom in on a selected part of the spectrum
Chart movement -scroll, zoom and scale the chart as needed
Slider - additional chart parameter settings

11
START / PAUSE
The current recording from the spectrometer camera runs in continuous mode with intervals determined by the
exposure time of the camera. Synchronous with the change of the record, the graphic form of the selected part
of the record also changes. Interruption of the continuous recording of the camera is enabled by the Pause
option on the graph control panel. The Start option is used to restart continuous recording.
SAVE
The current record in the form of an image, as well as the image of the graph of the selected part of the record
with the data set of coordinates, can be saved by selecting Save. All data are saved in a folder marked with the
measurement date.
5 SPECTROMETER CALIBRATION
The calibration for the given device is also remembered for further use after the spectrometer is turned on for
the first time and is saved in the file calData.txt, which is located in the default folder. When you select
Settings and calibration on the Spectrometer Calibration panel, a dialog box opens with three input calibration
points from the file calData.txt.
Settings and calibration
Upload calibration file: Calibration points can also be loaded from a calibration .txt file. The pair of
coordinates must be separated by a semicolon.

12
Additional calibration points can be entered by clicking Show more. Up to 15 calibration points can be
recorded. Adding calibration points increases the accuracy of determining the wavelengths of spectral lines.
The accuracy of the determination of the calibration curve can be checked by displaying it by selecting
Calibration curve on the Spectrometer calibration panel.
The calibration points must be evenly distributed on each side of the curve with minimal deviation. An
inappropriately chosen calibration point will manifest itself in a significantly larger deviation from the curve. In
this case, it is necessary to change its coordinates or remove the point from the calibration curve.
Advanced setting
In the Advanced settings menu of the calibration panel, it is possible to create a corrected spectral
dependence of the spectrometer's response to the white light source.
Calibration curve
Calibration deviation

13
Correction
As a source, it is necessary to choose a light bulb with an incandescent filament and choose the recording
parameters from the camera so that the intensities in the graph are not saturated. It is ideal to set the exposure
and gain of the camera so that the largest part of the graph is used. The maximum value of components R, G,
and B should be above the 200 level. In this situation, it is advisable to interrupt the recording from the camera
and select Create correction from the Correction option. By turning on the correction option, all records will
be evaluated with corrected intensities. The correction has no effect on the spectral range or resolution of the
spectrometer. The proportional representation of the components of the spectral records will be partially
changed. The result of spectrum operations will not change.
Current recording of the spectrum of an incandescent light bulb as a source of white light. Uncorrected
spectral response of the color R, G, B spectrometer camera
Wave lenght [nm]
Intensity [a.u.]

14
Mathematically adjusted, corrected R, G, B spectral response of the spectrometer camera
The corrected and uncorrected spectral response of the spectrometer camera can be changed by proportional
representation of the R, G, B components in the output signal. The preset values of the R, G, B components
have a size of 1. Similar to the correction itself, the change of the R, G, B components will be reflected in the
proportional representation of the spectral components of the camera recordings.
MEASURING
EMISSION SPECTRUM
The emission spectrum of a white LED compared to the reference spectrum of an energy-saving light bulb -
Hg and Ar lines
Wave lenght [nm]
Intensity [a.u.]

15
REFERENCE SPECTRUM, DIFFERENCE
Smoothed emission spectrum of the white LED after subtraction of the background reference spectrum
For optimal spectrum recording, it is necessary to place the light source and the spectrometer in such a
mutual position that no part of the spectrum is oversaturated. For this purpose, it is also advisable to change
the exposure time of the spectrometer camera.
REFERENCE SPECTRUM, RATIO
Current spectrum after passing through the red filter compared to the reference spectrum
Intensity [a.u.]
Wavelenght [nm]

16
Transmittance of the red filter after using the Ratio function
EMISSION SPECTRUM –calibration sources
Combination of line spectrum sources Hg, Ar in energy saving lamp and Ne tube for calibrating the
spectrometer
Wavelenght [nm]
Transmisivity [a.u.]
Pixels [px]
Intensity [a.u.]

17
Using the positions of the spectral lines of Neon to increase the number of calibration points
SYSTEM REQUIREMENT
RECOMMENDED SYSTEM REQUIREMENTS
SOFTWARE (OPERATING SYSTEM)
•Operating system: Microsoft Windows 10 64bit
•File system: NTFS
•Windows Installer 3.1 (may be included in the installation package or part of the OS)
•Microsoft .NET Framework 4.0 (may be included in the installation package or part of the OS)
HARDWARE
•Memory: 2 gigabytes (GB) for 32-bit or 4 GB for 64-bit
•Processor: 2 gigahertz (GHz) or faster processor, multi-core
•Graphics resolution: 1920 x 1280
•Graphics card: DirectX 9 or later with WDDM 1.0 driver
•Hard driver: 16 GB for 32-bit OS or 20 GB for 64-bit OS
•USB 2.0 connector
WARRANTY LETTER
WARRANTY PERIOD
The goods are covered by a warranty within the meaning of the Commercial Code according to the terms and
conditions set by the manufacturer. The standard warranty is 24 months, unless otherwise stated. The
Intensity [a.u.]
Pixels [px]

18
warranty period expires if there are defects caused by improper handling, natural wear and tear, improper
operation, repairs or interference by persons not authorised to do so.
WARNING
The item is intended for use as a demonstration teaching aid only and serves no other purpose! Before using
the goods, carefully read and follow all safety instructions, both on the instrument labels and in the enclosed
manuals.
Never use or store the product in close proximity to heat sources such as radiators, boilers, stoves or other heat
generating appliances and equipment. Never use the product in close proximity to water (near the bath, kitchen
sink, in humid environments, by swimming pools or in the rain). Never place products on an unstable base - this
will prevent damage to the product and personal injury.
In general, do not expose the goods to mechanical and chemical stresses that would cause damage to them /
drops, impacts, scratches, surface damage. Keep all manuals and safety instructions in a suitable place for later
use.
The product contains small parts. It is unsuitable for children under 3 years of age. Some parts have sharp
edges and may cause injury. When working, use protective work equipment that is not included in the package.
For glass or plexiglass components, handle with care as there is a risk of injury. In the case of packaging in
protective foil, dispose of it after removal and keep out of reach of small children to prevent possible suffocation.
For electrically powered devices, connect the product only to a power supply with the parameters described on
the device's label and make sure that the parameters of the power supply are in accordance with the required
parameters for this device. In the event of any damage to the electrical equipment, insulation, or other
mechanical damage, disconnect the device from the power supply and send it to a service center. In case of
need for warranty or post-warranty service, contact the supplier. As proof, attach a certified copy of the delivery
note, which is a necessary condition for the warranty repair.
Use only a damp cloth for cleaning. Never use any variation of liquid or aerosol cleaners or organic solvents to
clean products.
DATE OF SALE
/unless stated, the date on the delivery note or invoice applies/
Table of contents
Other KVANT Measuring Instrument manuals