RFbeam Microwave K-MD2 User manual

© RFbeam Microwave GmbH |Schuppisstrasse 7 |CH-9016 St. Gallen |www.rfbeam.ch |K-MD2 Engineering Sample |user manual 07/2018 – Revision A |Page 1/23
– 24 GHz FMCW radar with digital signal processing
– Angle of arrival in azimuth/elevation
– Serial target list output
– Detection distance: 100 m for persons/200 m for cars
– Distance range: 0 –250 m, 1m resolution
– Speed range: ± 130 km/h, 1 km/h resolution
– Angle range: ± 9.1° (elevation) ±16.4° (azimuth),
0.1°resolution
– Compact size: 120 × 72 × 15 mm
– Traffic analysis and classification
– Intersection management
– Security systems
– Object speed measurement systems
– Measurement and research applications
– Industrial sensors
The K-MD2 is a high-end 3D radar transceiver with three recei-
ving channels and a low phase noise, PLL controlled transmitter.
The target information from the three receive antennas is digiti-
zed and the high speed digital signal processing performs range
and doppler FFT’s with an update rate of 20 measurements per
second. Using the serial interface, many operating parameters
such as frequency, bandwidth and repetition rate can be adjus-
ted. Results are available in target list format as well as in raw
range-doppler matrices. Ethernet and a serial communication
interfaces are included.
Features
Applications
Description
Control Panel
PRODUCT INFORMATION
Figure 1: Control panel GUI overview
user manual
K-MD2
Engineering Sample
radar transceiver
with integrated signal processing

© RFbeam Microwave GmbH |Schuppisstrasse 7 |CH-9016 St. Gallen |www.rfbeam.ch |K-MD2 Engineering Sample |user manual 07/2018 – Revision A |Page 2/23
TABLE OF
CONTENTS
Product Information ............................ 1
Features ......................................... 1
Applications ...................................... 1
Description....................................... 1
Control Panel..................................... 1
Installation ....................................... 3
Setup for TCP (Ethernet) .......................... 3
Quick Start ...................................... 4
Adjust the Settings................................ 6
Control Panel ................................... 9
Views ........................................... 10
Miscellaneous Display Controls ................... 15
Control Tabs..................................... 16
System Requirements ....................... 23
Revision History .............................. 23

© RFbeam Microwave GmbH |Schuppisstrasse 7 |CH-9016 St. Gallen |www.rfbeam.ch |K-MD2 Engineering Sample |user manual 07/2018 – Revision A |Page 3/23
INSTALLATION
Double-click the K-MD2_CTP-RFB-01XX_Setup.msi
file to start the installation of the control panel. Follow
the steps until installation is completed.
To use the integrated video function, the « Logitech
HD Webcam C525 » is recommended and suppor-
ted by the control panel. Please download and install
necessary drivers for the webcam from the manufac-
turer’s website.
Setup for TCP (Ethernet)
Choose this option to connect the radar via TCP. To
connect the radar with the computer via ethernet
follow these steps:
1. Plug in the delivered power supply (+12VDC) and
connect it to the K-MD2
2. Connect the ethernet cable to the K-MD2 and
your computer
3. After some seconds the LED1 starts blinking
4. Change the IPV4 connection settings on your
computer to a static setting with the following
parameters:
IP-Address: 192.168.16.1
Subnet: 255.255.255.0
5. Open the cmd console and type in:
ping 192.168.16.2 <enter>
6. The K-MD2 should now respond to this ping. If
there is no response at all, recheck your IP-ad-
dress settings. If your IP-address settings are cor-
rect, please consider the possibility your firewall is
blocking the connection.
7. Connect your webcam – wait until Windows has
installed the webcam drivers.
8. Your K-MD2 is now connected with your compu-
ter – start the control panel.
9. Now click the “Connect” button in the TCP frame
(Figure 2). If it does not connect immediately, click
again until it successfully connects your K-MD2.
10. On a system with multiple cameras, the window
Figure 3 will pop up. Select the camera you want
to use.
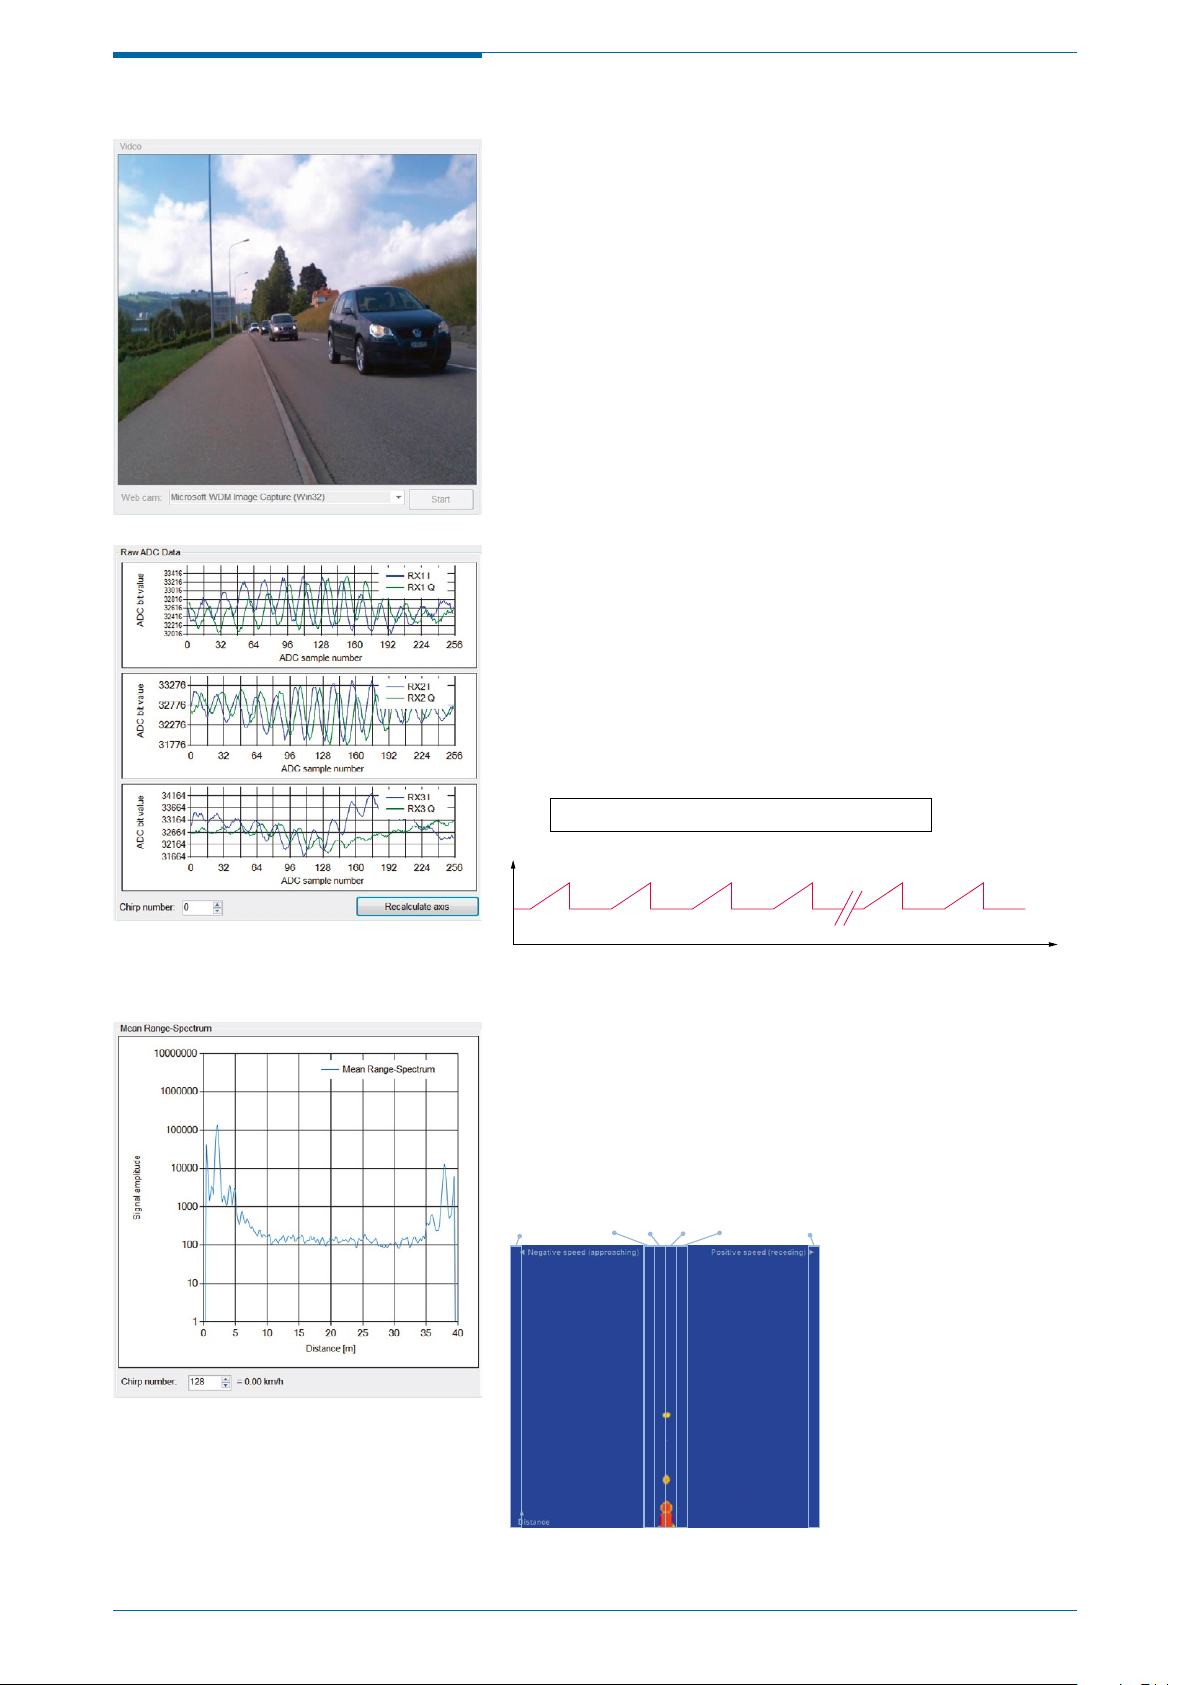
11. After connecting, the control panel will display the
following view of Figure 4.
Figure 2: TCP area
Figure 3: Camera selection window
Figure 4: Default connected view

© RFbeam Microwave GmbH |Schuppisstrasse 7 |CH-9016 St. Gallen |www.rfbeam.ch |K-MD2 Engineering Sample |user manual 07/2018 – Revision A |Page 4/23
QUICK START
The control panel provides a range of setting options.
The structure of the panel views is designed to guide
you through the different steps of radar processing.
Figure 5: Signal processing workflow
Raw ADC Data (RADC)
– Samples ADC data from all 3 RX antennas
(1 Frame = 256 Samples x 256 Chirps)
Mean Range-Doppler (RMRD)
– Calculates the range-doppler map for all 3 RX antennas
– Averages the range-doppler map of all 3 RX antennas
Raw Target (PDAT)
– Find targets over threshold
– Range compensation
– Filtering with an exponential moving average
Tracking Target (TDAT)
– Uses an alpha-beta-gamma tracker to track targets
– Assigns objects to tracking channels
– Predicts temporary lost objects

© RFbeam Microwave GmbH |Schuppisstrasse 7 |CH-9016 St. Gallen |www.rfbeam.ch |K-MD2 Engineering Sample |user manual 07/2018 – Revision A |Page 5/23
Figure 6: Overview control panel areas
There are many views to select, all of them with a preceded shortcut.
The shortcuts are also preceded by the data output and therefore allows
easy checking of whether the current view receives and shows data from
the radar.
The control panel is structured according to Figure 6.
Go to the same named chapter for further information.
Views
Miscellaneous
Display Controls
Tabs
Example
By enabling “PDAT – Raw Target Data”
onthe“DataOutput”, the view:
– PDAT – Raw Target Speed/Range
– PDAT – Raw Target Azimuth/Range
– PDAT – Raw Target Elevation/Range
– PDAT – Raw Target Range/Range
– PDAT – Raw Target 3D
Start to update with radar data, also illustrated
inFigure 7.
Figure 7: Data output example

© RFbeam Microwave GmbH |Schuppisstrasse 7 |CH-9016 St. Gallen |www.rfbeam.ch |K-MD2 Engineering Sample |user manual 07/2018 – Revision A |Page 6/23
Figure 8: Device orientation
Figure 9: Clipping ADC signals
Figure 10: No clipping ADC signals
Adjust the Settings
Although the K-MD2 is pre-calibrated with useful
parameters and the control panel assists in parameter
selection, for a good result there are still many things
to consider and set depending on your needs. This
chapter is a guideline to lead you to usable results in
the shortest possible time.
All changed parameters are saved on the K-MD2
device and are still available after power off/on.
Make sure the orientation of the device is as
shown in Figure 8. Otherwise the azimuth
and elevation angles are mirrored.
Radar Settings
On the radar tab the K-MD2 parameters can be set.
Choose the following settings according to the appli-
cation:
– Range
– Speed
– RX gain
Changing of these settings, especially the RX gain,
can result in clipping of the ADC signals as shown
inFigure 9. If this happens, reduce the RX gain
inaway that the ADC signals don’t clip anymore
asshown inFigure 10.
Clipping ADC signals will result in loss of sensi-
tivity and therefore in worse target detections.
The range has to be set depending on the maximum
distance which should be detected and the necessary
distance resolution of the application. The speed set-
ting is dependent of the maximum detectable speed
of the application.

© RFbeam Microwave GmbH |Schuppisstrasse 7 |CH-9016 St. Gallen |www.rfbeam.ch |K-MD2 Engineering Sample |user manual 07/2018 – Revision A |Page 7/23
Detection Settings
Using the ADC data, which is now perfectly parame-
terized, the K-MD2 calculates three raw range-dopp-
ler maps (for each RX antenna) and subsequently
averages them into one mean range-doppler map.
Targets over the “Peak threshold” are coloured red in
the mean range-doppler map. Depending on the de-
tection settings the raw targets are reported. Set the
detection parameters according to your needs.
Figure 11: Mean range-doppler map to raw targets

© RFbeam Microwave GmbH |Schuppisstrasse 7 |CH-9016 St. Gallen |www.rfbeam.ch |K-MD2 Engineering Sample |user manual 07/2018 – Revision A |Page 8/23
Tracking Settings
On each frame the range, speed and direction of
every track is updated. An alpha-beta-gamma tracker
is used, where the speed is updated with the current
acceleration estimate, and the range is updated with
the current speed estimate. If a constant speed is
assumed the acceleration is assumed to be zero,
resulting in more reliable tracking for objects moving
at a constant speed (e.g. towards or away from the
radar). If the speed of the object is changing rapidly
(e.g. passing across the radar field of view) it can be
tracked if a constant speed is not assumed.
The list of detected peaks is compared with the
updated list of known tracks. If a peak matches an
existing track, it is marked as associated and the life
of the track is increased. If no peak is found for the
track, the life of the track is decreased. If there is no
existing track for the peak, a new track is created.
Once the life of a track reaches a minimum threshold
it is reported as a confirmed track. The life of a track
is limited, in that it will be lost if no detections are as-
sociated with it for the maximum track life. Adapt the
given parameters to suit your needs.
As indicated in the following figure, the tracking filter
reports only real targets and ignores reflections.
Figure 12: Raw targets to tracked targets

© RFbeam Microwave GmbH |Schuppisstrasse 7 |CH-9016 St. Gallen |www.rfbeam.ch |K-MD2 Engineering Sample |user manual 07/2018 – Revision A |Page 9/23
Figure 13: Start-up view of the control panel
CONTROL PANEL
This is the start-up view of the control panel. In this
chapter all the graphical elements and the functions
ofthe control panel are described.

© RFbeam Microwave GmbH |Schuppisstrasse 7 |CH-9016 St. Gallen |www.rfbeam.ch |K-MD2 Engineering Sample |user manual 07/2018 – Revision A |Page 10/23
Views
Video
Start and stop the webcam video stream.
Raw ADC Data View
This view shows the ADC values recorded by the K-MD2. Use
the «Recalculate axis button» to rescale when ADC signals are
displayed very small or bigger than the current axis range.
Chirp number:
The K-MD2 is configured to sample 256 chirps. From all of these
chirps the ADC signal of all three RX antennas can be shown
(Figure 14).
Mean Range-Spectrum View
This is the cross spectrum of the mean range-doppler map.
Chirp number:
The mean range-spectrum of the selected chirp number is
shown. The chirp number of zero speed is 128.
Figure 14: Chirps over time
Chirp number: 0 … 255
f
t
0123254 255
Figure 15: Chirp slices in therange-doppler map
Chirp number0 … … 255126127128129
… …

© RFbeam Microwave GmbH |Schuppisstrasse 7 |CH-9016 St. Gallen |www.rfbeam.ch |K-MD2 Engineering Sample |user manual 07/2018 – Revision A |Page 11/23
Mean Range-Doppler View
In the mean range-doppler map targets are displayed
in aspeedvs. distance map. Range-doppler is popular
amongstradar applications, as it can be efficiently calculated
out of therawADC data. Targets over the “peak threshold”
areshownred.
Raw Target Speed/Range View
This view contains the raw targets found with the same axis
asthe mean range-doppler view. It is helpful to compare this
view with the mean range-doppler when tuning the detecti-
onparameters.
No. of targets:
Count of actually reported raw targets
Raw Target Azimuth/Range View
This view shows the azimuth angle and the distance of the raw
targets in the same diagram. It is very helpful for angle measure-
ments and to calibrate the azimuth angle.
No. of targets:
Count of actually reported raw targets
The ADC values are complex values (I-Channel and
Q-Channel). Due to hardware coupling of these channels
targets in the lower half of the distance are seen mirrored
in the upper half of the distance but with less magnitude.

© RFbeam Microwave GmbH |Schuppisstrasse 7 |CH-9016 St. Gallen |www.rfbeam.ch |K-MD2 Engineering Sample |user manual 07/2018 – Revision A |Page 12/23
Raw Target Elevation/Range View
This view shows the elevation angle and the distance of the raw
targets in the same diagram. It is very helpful for angle measure-
ments and to calibrate the elevation angle.
No. of targets:
Count of actually reported raw targets
Raw Target Range/Range View
This is one of the most interesting views as the information of
theraw targets is interpreted and shown in a two-dimensional
map. The targets show the radar’s view of the real world. Grey
targets are static targets without any speed. Green targets
aremoving away from the radar and red targets are moving
towards the radar.
No. of targets:
Count of actually reported raw targets
Radar direction:
This defines the direction of the radar to the monitor. If «Same as
monitor» is used, the webcam video has to be mirrored to corres-
pond to the data.
Raw Target 3D View
This view shows the raw targets in three dimensions. Thein-
formation of the azimuth and elevation angles and the target
distance are calculated to the location in a 3D-distance area.
Thetargets are coloured pins and the colour suits to the Z-dimen-
sion(elevation).
No. of targets:
Count of actually reported raw targets
The 3D view can be turned around with the mouse
tochange the perspective.

© RFbeam Microwave GmbH |Schuppisstrasse 7 |CH-9016 St. Gallen |www.rfbeam.ch |K-MD2 Engineering Sample |user manual 07/2018 – Revision A |Page 13/23
Tracking Speed/Range View
Compare this view with the corresponding raw view to see the
improvements of the tracking filter.
No. of targets:
Count of actually tracked targets
Tracking Azimuth/Range View
Compare this view with the corresponding raw view to see the
improvements of the tracking filter.
No. of targets:
Count of actually tracked targets
Tracking Elevation/Range View
Compare this view with the corresponding raw view to see the
improvements of the tracking filter.
No. of targets:
Count of actually tracked targets

© RFbeam Microwave GmbH |Schuppisstrasse 7 |CH-9016 St. Gallen |www.rfbeam.ch |K-MD2 Engineering Sample |user manual 07/2018 – Revision A |Page 14/23
Tracking Range/Range View
Compare this view with the corresponding raw view to see the
improvements of the tracking filter.
No. of targets:
Count of actually tracked targets
Tracking 3D View
Compare this view with the corresponding raw view to see the
improvements of the tracking filter.
No. of targets:
Count of actually tracked targets
The 3D view can be turned around with the mouse
tochange the perspective.

© RFbeam Microwave GmbH |Schuppisstrasse 7 |CH-9016 St. Gallen |www.rfbeam.ch |K-MD2 Engineering Sample |user manual 07/2018 – Revision A |Page 15/23
Miscellaneous Display Controls
Figure 16: Display dropdown
Dropdown label Description
Video Webcam video picture
RADC – Raw ADC Data ADC values of all RX antennas
RMRD – Mean Range-Spectrum Cross section of mean range-doppler map
RMRD – Mean Range-Doppler Averaged range-doppler map of all RX antennas
PDAT – Raw Target Speed/Range Raw target map speed vs. range
PDAT – Raw Target Azimuth/Range Raw target map azimuth vs. range
PDAT – Raw Target Elevation/Range Raw target map elevation vs. range
PDAT – Raw Target Range/Range Raw target map range vs. range
PDAT – Raw Target 3D Raw target map in three distancedimensions
TDAT – Tracking Speed/Range Tracked target map speed vs. range
TDAT – Tracking Azimuth/Range Tracked target map azimuth vs.range
TDAT – Tracking Elevation/Range Tracked target map elevation vs.range
TDAT – Tracking Range/Range Tracked target map range vs. range
TDAT – Tracking 3D Tracked target map in three distancedimensions
Table 1: Dropdown labels
Modes
Disconnected:
No connection with the K-MD2.
Live stream:
The control panel is connected to the K-MD2 and receives
datapackets.
Record:
The control panel is connected to the K-MD2 and records
thereceived data packets (saved to hard disk).
Playback:
Recorded data will be played and visualized.
Display Dropdown
There are two display frames left and right where different views
can be shown.
It is not possible to display the same view on the left and
the right frame at the same time.
If one of the windows left shows a white screen or is frozen,
check that the chosen display setting matches with the selected
data output.

© RFbeam Microwave GmbH |Schuppisstrasse 7 |CH-9016 St. Gallen |www.rfbeam.ch |K-MD2 Engineering Sample |user manual 07/2018 – Revision A |Page 16/23
Control Tabs
This chapter discusses the function of all
control tabs.
Communication Tab
Figure 17: Communication tab
In the communication tab, all settings for
the communication with the radar can be
set. On the following pages, each part of
the communication tab is explained.
Use TCP to connect to the K-MD2.
Try several times to connect if the device isn’t found. So-
metimes the ethernet needs some time to establish the
connection. If there is no connection after several times
check the settings in the chapter “Installation”.
The actual firmware version of the connected K-MD2 is shown.
Select which output is sent from the radar to the control panel.
Normally the frame cycle time is 50ms. Due to more enabled data
outputs or the hard disk speed of the PC, it is possible that the
cycle time will increase.
Only selected (transmitted) data packets can be shown
and recorded
TCP
Info
Data Output

© RFbeam Microwave GmbH |Schuppisstrasse 7 |CH-9016 St. Gallen |www.rfbeam.ch |K-MD2 Engineering Sample |user manual 07/2018 – Revision A |Page 17/23
Refer to datasheet for detailed
description oftheparameter.
Radar Tab
Figure 18: Radar tab
On this tab page, the radar properties can
be changed.
There are some presets for the range which can be chosen.
Depending on this selection the parameters “Start frequency” and
“Bandwidth” are changed to meet the specification.
Depending on the “Bandwidth” parameter, the maximal detectab-
le range and the range resolution are calculated.
Refer to datasheet for calculation formula.
Depending on the parameters “Start frequency” and “Bandwidth”
the center frequency of the chirp ramp is calculated.
This is the start frequency of the FMCW sweep. To reach
othercenter frequencies than those defined by presets, change
thisparameter.
This is the bandwidth of the FMCW sweep. To reach other maxi-
mal ranges and range resolutions adjust the bandwidth.
Range
Range [m]
Range max, delta [m]
Center frequency [MHz]
Start frequency [MHz]
Bandwidth [MHz]

© RFbeam Microwave GmbH |Schuppisstrasse 7 |CH-9016 St. Gallen |www.rfbeam.ch |K-MD2 Engineering Sample |user manual 07/2018 – Revision A |Page 18/23
There are some presets for the range which can be chosen.
Depending on this selection the parameters “Start frequency”
and“Bandwidth” are changed to meet the specification.
Depending on the “Initial delay” parameter the maximal detectab-
le speed and the speed resolution is calculated.
Refer to datasheet for calculation formula.
This is the delay at every chirp before the ramp starts.
Toreachother maximal speeds and speed resolutions ad-
justtheinitialdelay.
Receiver gain in decibels.
To calibrate the device, add an offset to the azimuth angle.
To calibrate the device, add an offset to the elevation angle.
Speed
Speed [km/h]
Speed max, delta [km/h]
Initial delay [clk]
Receiver
RX gain [dB]
Angle calibration
Azimuth offset [°]
Elevation offset [°]

© RFbeam Microwave GmbH |Schuppisstrasse 7 |CH-9016 St. Gallen |www.rfbeam.ch |K-MD2 Engineering Sample |user manual 07/2018 – Revision A |Page 19/23
Refer to datasheet for detailed
description oftheparameter.
Detection Tab
Figure 19: Detection tab
On this tab page, the detection algorithm
properties are changeable.
A peak is detected if it is more than the threshold higher than the
exponential moving average (background).
The peak threshold can be adjusted to allow for the expected
change in signal with range. The adjustment is made by dividing
the threshold by the range to the power of this value.
The number of frames to average for the background ran-
ge-doppler map. The background range-doppler is an exponenti-
al moving average against which each frame is compared.
Smooth the mean range-doppler map with a 3x3 Gaussi-
anwindow.
The maximum number of peaks to be detected. Close range
peaks are found first.
The minimum range bin for finding peaks.
The maximum range bin for finding peaks.
The minimum doppler bin for finding peaks.
The maximum doppler bin for finding peaks.
Detection
Peak threshold
Range compensation
Background update
Smoothing
Max. number of peaks
Minimum range [bin]
Maximum range [bin]
Minimum speed [bin]
Maximum speed [bin]

© RFbeam Microwave GmbH |Schuppisstrasse 7 |CH-9016 St. Gallen |www.rfbeam.ch |K-MD2 Engineering Sample |user manual 07/2018 – Revision A |Page 20/23
Refer to datasheet for detailed
description oftheparameter.
Tracking Tab
Figure 20: Tracking tab
On this tab page, the tracking properties
can be changed.
The maximum number of tracks to be reported. The internal list
length is the same as the maximum number of peaks to find.
Maximum difference in range bins between predicted range and
range of the peak.
Maximum difference in doppler bins between predicted speed
and speed of the peak.
Maximum difference between predicted direction and measured
direction of the peak.
When targets can be associated with a tracking channel for this
amount of frames, the tracking channel becomes valid and will
bereported.
When no targets can be associated with a valid tracking channel
for this amount of frames, the tracking channel becomes invalid
and will no longer be reported.
Number of previous frames to use in tracking algorithm.
Report non-moving tracks.
Assume constant speed in tracking algorithm.
Tracking
Max. number of tracks
Max. range jitter [bin]
Max. speed jitter [bin]
Direction threshold [°]
Min. track life [frame]
Max. track life [frame]
Tracking history [frame]
Stationary objects
Assume constant speed
This manual suits for next models
1
Table of contents
Other RFbeam Microwave Transceiver manuals