SARK 110 User manual

This document is licensed under a Creative Commons Attribution-NonCommercial-ShareAlike 3.0 Unported License.
© Melchor Varela – EA4FRB 2011-2015
SARK
SARKSARK
SARK-
--
-110
110110
110
Vector Impedance Antenna Analyzer
User’s Manual
Revision 1.2.6
Updated to Firmware Version 0.8.6.12

SARK
SARKSARK
SARK-
--
-110
110110
110
User’s Manual
Rev 1.2.6 October 3
rd
, 2015 - 2 - © Melchor Varela – EA4FRB 2011-2015
Contents
1
INTRODUCTION.......................................................................................................................4
2
MAIN FEATURES.....................................................................................................................5
3
OVERVIEW OF FUNCTIONS...................................................................................................6
4
OPERATING THE SARK-110 ..................................................................................................7
4.1
S
CREEN
L
AYOUT
..................................................................................................................7
4.2
S
TATUS
S
YMBOLS
M
EANING
.................................................................................................8
4.3
M
EANS OF
I
NPUT
..................................................................................................................8
4.4
C
HANGING THE
F
REQUENCY
.................................................................................................9
4.5
C
HANGING THE
S
PAN
.........................................................................................................10
4.6
F
REQUENCY
P
RESETS
........................................................................................................10
4.7
U
SING
M
ARKERS
................................................................................................................11
4.8
C
HANGING THE
V
ERTICAL
A
XIS
P
ARAMETER
........................................................................14
4.9
S
AVING AND
R
ECALLING
M
EASUREMENTS
...........................................................................14
4.10
T
AKING
S
CREENSHOTS
...................................................................................................19
4.11
C
HANGING THE
O
PERATING
M
ODE
..................................................................................20
4.12
C
HANGING THE
S
ETTINGS
...............................................................................................20
5
SCALAR CHART MODE........................................................................................................32
6
SMITH CHART MODE............................................................................................................34
7
SINGLE FREQUENCY MODE ...............................................................................................36
8
CABLE TEST MODE (TDR)...................................................................................................39
9
FIELD MODE..........................................................................................................................42
10
MULTI-BAND MODE ..........................................................................................................44
11
SIGNAL GENERATOR MODE ...........................................................................................46
12
COMPUTER CONTROL MODE .........................................................................................50
13
TRANSMISSION LINE ADD/SUBTRACT ..........................................................................52

SARK
SARKSARK
SARK-
--
-110
110110
110
User’s Manual
Rev 1.2.6 October 3
rd
, 2015 - 3 - © Melchor Varela – EA4FRB 2011-2015
14
CIRCUIT MODELS..............................................................................................................55
14.1
L
OOP
A
NTENNA
/C
OIL
......................................................................................................55
14.2
C
APACITOR
....................................................................................................................57
14.3
Q
UARTZ
C
RYSTAL
..........................................................................................................59
14.4
T
RANSMISSION
L
INE
.......................................................................................................61
15
SPECIFICATIONS...............................................................................................................64
16
PRECAUTIONS...................................................................................................................67
17
REGULATORY WARNING.................................................................................................67
18
ACKNOWLEDGMENTS .....................................................................................................68
APPENDIX A:
THEORY OF OPERATION..............................................................................69
APPENDIX B:
FUNDAMENTAL PARAMETERS....................................................................71
APPENDIX C:
UPGRADING THE FIRMWARE ......................................................................73
APPENDIX D:
OSL CALIBRATION........................................................................................74
APPENDIX E:
FREQUENCY CALIBRATION.........................................................................79
APPENDIX F:
DETECTOR CALIBRATION............................................................................80
APPENDIX G:
FREQUENCY PRESETS FILE........................................................................84
APPENDIX H:
SCALE PRESETS ...........................................................................................85
APPENDIX I:
CUSTOM CABLE SETTINGS .............................................................................87

SARK
SARKSARK
SARK-
--
-110
110110
110
User’s Manual
Rev 1.2.6 October 3
rd
, 2015 - 4 - © Melchor Varela – EA4FRB 2011-2015
1 Introduction
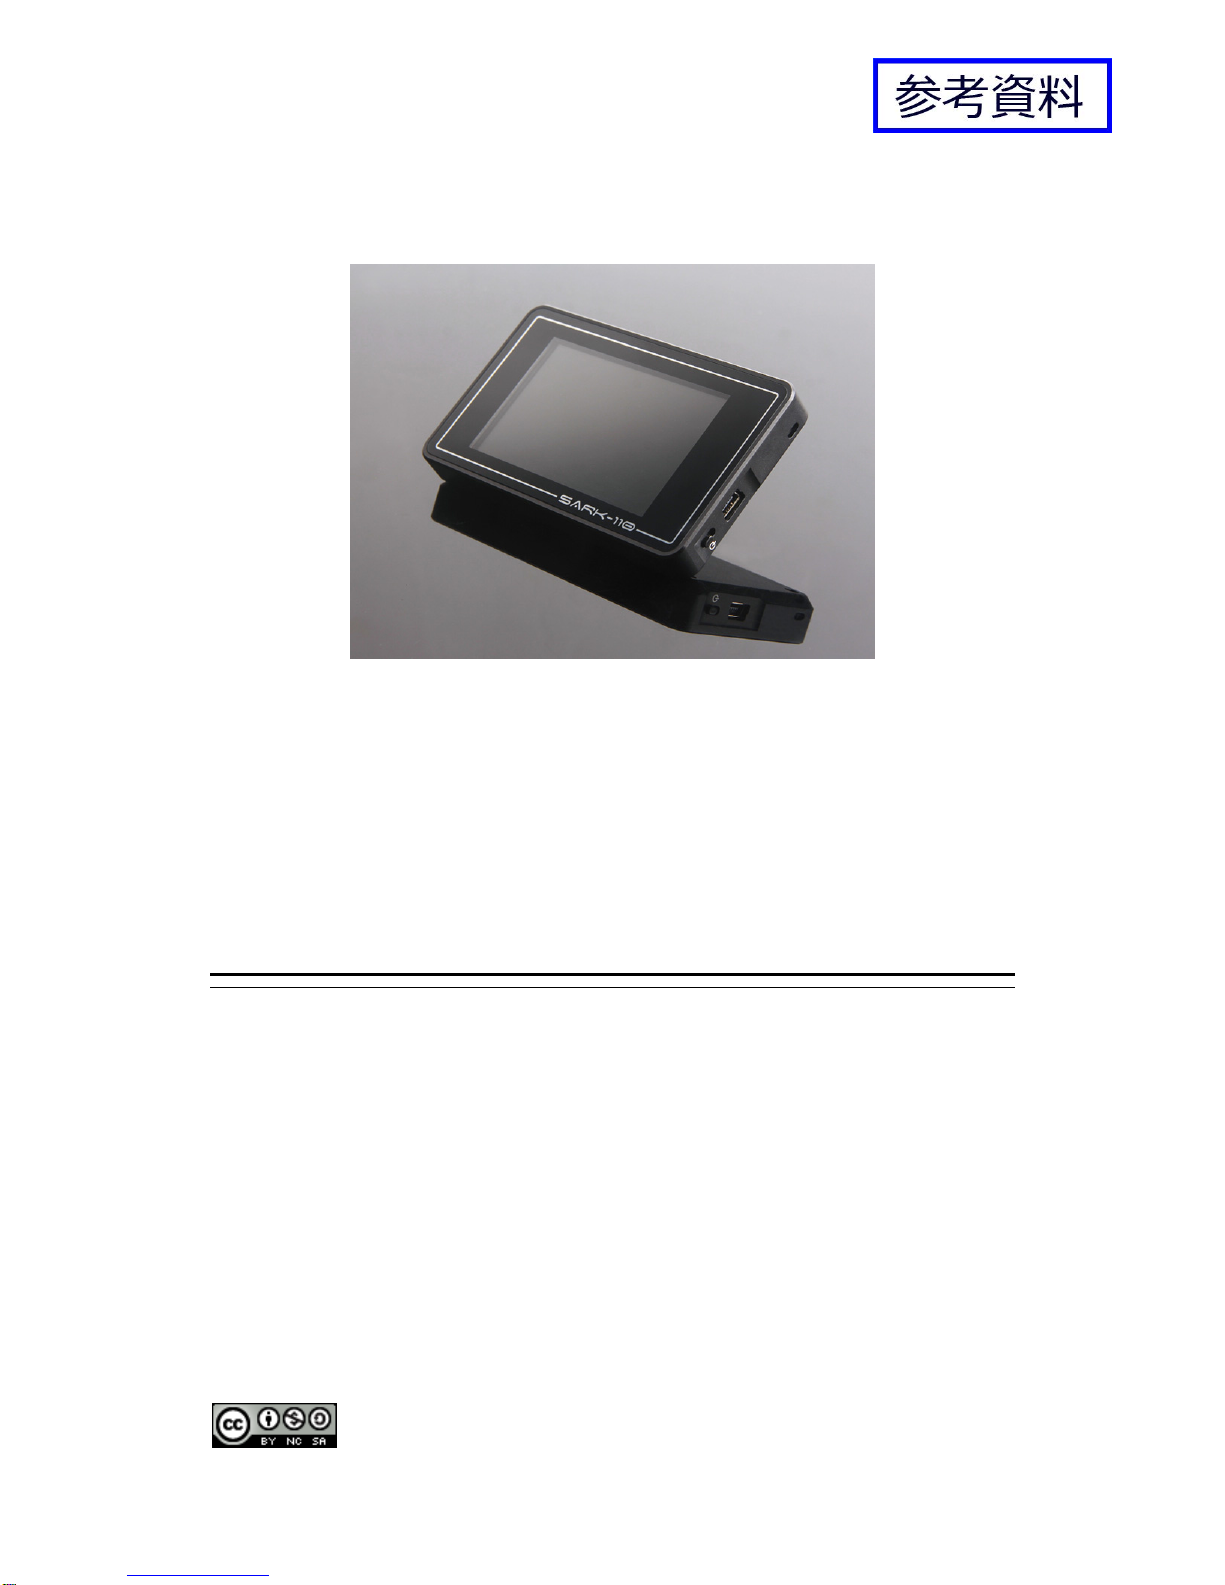
The SARK-110 Antenna Analyzer is a pocket size instrument providing fast and accurate
measurement of vector impedance, VSWR, vector reflection coefficient, return loss, and R-L-C
(as series or parallel equivalent circuits). Additionally, the analyzer features a TDR (Time
Domain Reflectometer) mode which is intended for fault location and length determination in
coaxial cables as well as a programmable RF signal generator.
The SARK-110 is intended for standalone operation but also operates when connected to a
personal computer in combination with SARK Plots client software for Windows, further
enhancing the device’s capabilities.
Typical applications include checking and tuning antennas, impedance matching, component
testing, cable fault location, measuring coaxial cable losses and cutting coaxial cables to precise
electrical lengths. As a signal generator it is ideal for receiver calibration, sensitivity tests and
signal tracing.
The SARK-110 features a Direct Digital Synthesis (DDS) generator with a range of 0.1 to 230
MHz and a frequency resolution of 1 Hz. The instrument has full vector measurement capability
and accurately resolves the resistive, capacitive and inductive components of a load. The
measurement reference plane is automatically adjusted via the Open/Short/Load calibration
procedure for higher measurement accuracy. Also, the analyzer implements a transmission line
addition or subtraction feature in order to make antenna measurements while discounting the
effect of the feed line.
The user interface, based on a color display, has been designed to be intuitive and easy to use.
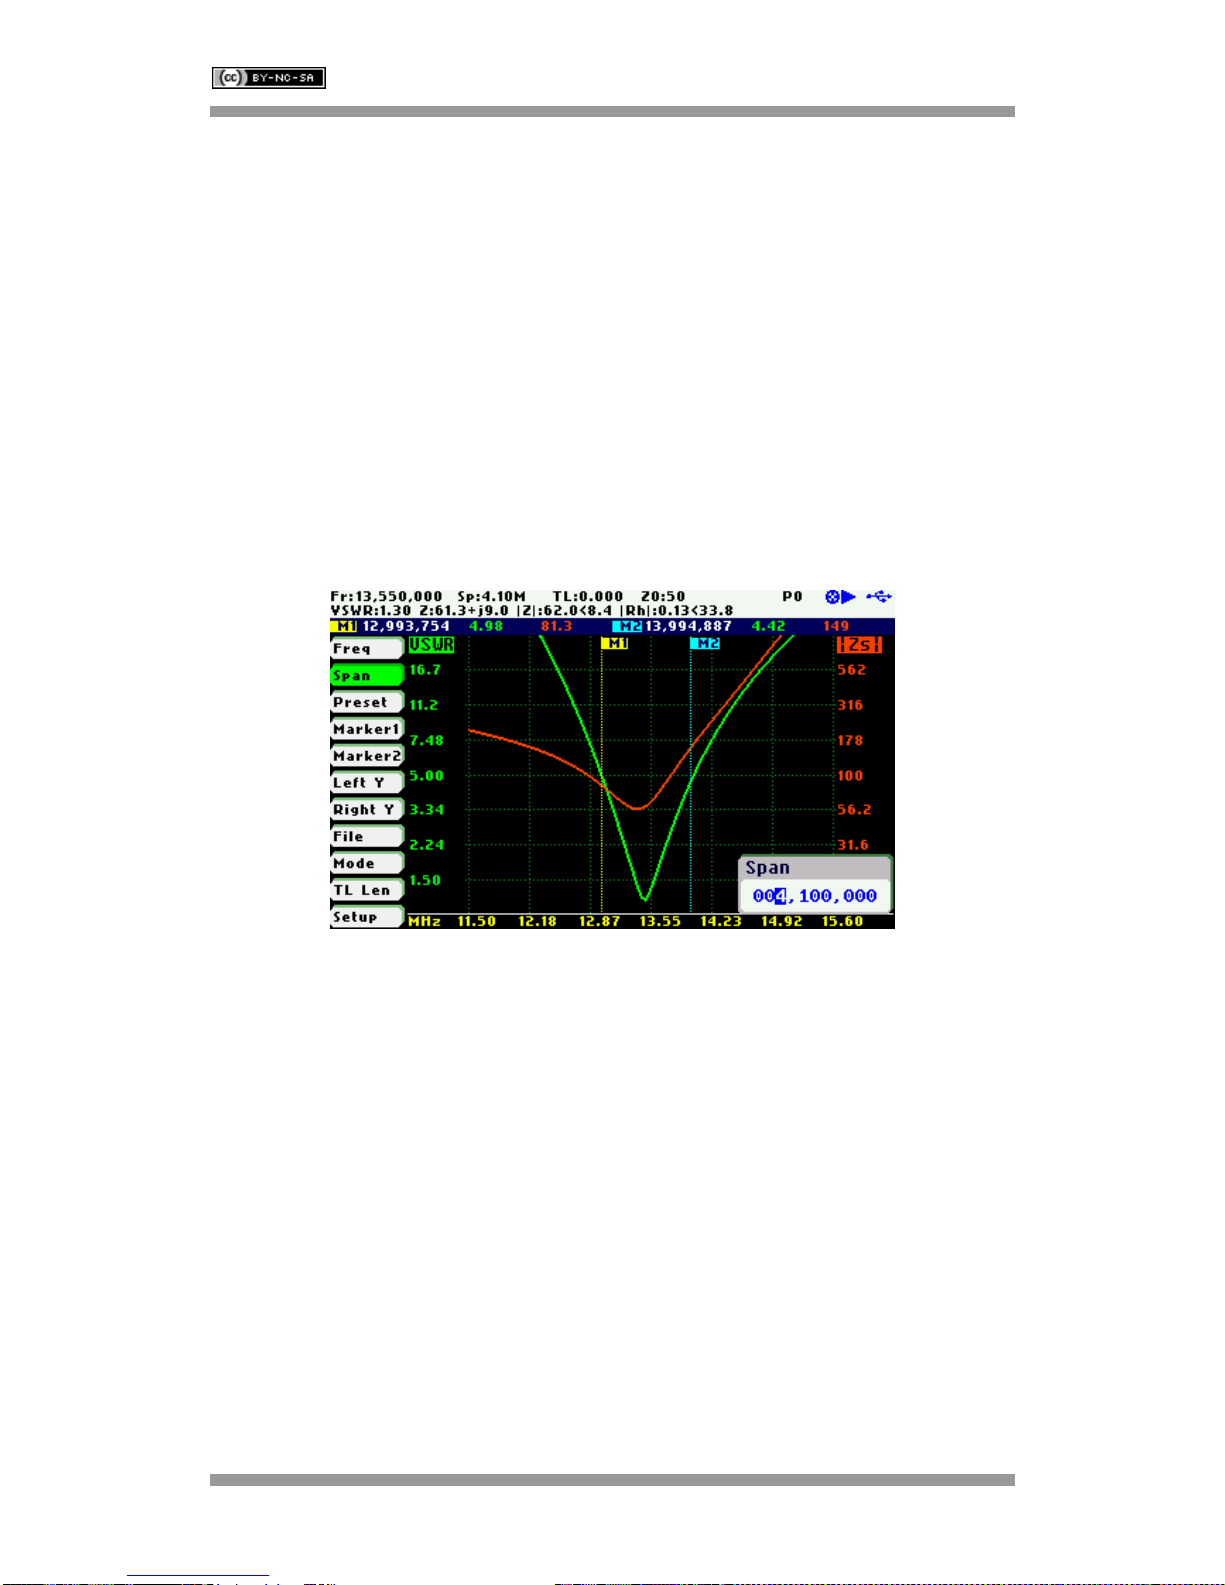
The graphical impedance displays provide a quick view of the antenna impedance
characteristics on a user-selected sweep range. This includes the graphical plot of two user-
selectable parameters in a scalar chart or a complex reflection coefficient in Smith chart form.
To help speed up measurements, two markers are available, both of which are user positionable
or can operate in automatic tracking mode.
The Multiband mode is a unique feature of the SARK-110, whereby it is able to display
simultaneously the plot of an impedance parameter in four scalar charts. This feature is ideal for
tuning multiband antennas.
Also included is a single frequency measurement mode that presents a complete impedance
parameter analysis at a user selectable frequency and displays diagrams of equivalent circuits.
The analyzer uses an internal 2MB flash disk for the storage and recall of measured parameters,
screenshots, analyzer configuration and firmware updates. This disk is accessible via USB so
the measured parameters can be downloaded to a PC for analysis using the ZPLOTS
spreadsheet program or the SARK Plots client software for Windows.
Please let us have your suggestions through the website http://www.sark110.com as we are
highly motivated to extend this device’s functionality, based on community requests.

SARK
SARKSARK
SARK-
--
-110
110110
110
User’s Manual
Rev 1.2.6 October 3
rd
, 2015 - 5 - © Melchor Varela – EA4FRB 2011-2015
2 Main Features
•Pocket size and lightweight
•Solid aluminum case
•Intuitive and easy to use
•Operating modes: Scalar Chart, Smith Chart, Single Frequency, Cable Test (TDR), Field
Mode, Multi-band, Signal Generator and Computer Control
•Good accuracy over a broad range of impedances
•Resolves the sign of the impedance
•Manual and automatic positioning tracking markers
•Internal 2MB USB disk for the storage of measurements, screenshots, configuration and
firmware upgrade
•Exports data in ZPLOTS-compatible format for further analysis on a PC
•SARK Plots client software for Windows
•Lifetime free firmware upgrades
•Open to community requested features
•Open source Software Development Kit (SDK) including a device simulator for
development of user applications

SARK
SARKSARK
SARK-
--
-110
110110
110
User’s Manual
Rev 1.2.6 October 3
rd
, 2015 - 6 - © Melchor Varela – EA4FRB 2011-2015
3 Overview of Functions
The unit has a Test Port located on its left side, to connect to the device under test. This
receptacle accepts straight MCX plug connector types. The product pack includes an MCX to
SMA female connector adapter and a 20-cm SMA plug to SMA female cable adapter.
The USB port located on the right side facilitates connection to a personal computer for
communication and internal battery charging using a compatible mini-USB cable (not included).
The unit charges the internal battery when connected to USB. The internal battery charger
automatically manages the charge cycle and stops the process when the battery is fully charged.
The complete charge cycle takes around 3.5 hours.
Slide the Power Switch button located on the right side to the ON position to turn the unit on. An
automatic power-off feature can be set for power-saving after a user-specified period of
inactivity.
Operation is controlled by four buttons and two navigation keys located on the top side of the
unit. A 3” TFT color LCD is used to display diagrams.

SARK
SARKSARK
SARK-
--
-110
110110
110
User’s Manual
Rev 1.2.6 October 3
rd
, 2015 - 7 - © Melchor Varela – EA4FRB 2011-2015
4 Operating the SARK-110
This chapter provides information about the SARK-110’s basic functionality and user interface.
4.1 Screen Layout
The following figure shows the screen layout in Scalar Chart mode. It shows diagram areas that
are the same for all operating modes of the SARK-110. Screen layouts that show specifics for
each operating mode are provided in corresponding sections of this manual.
1 Diagram 11 Markers information
2 Traces 12 Detailed measurements
3 Markers 13 Frequency and span settings
4 Vertical axis labeling 14 Transmission Line length setting
5 Horizontal axis labeling 15 Reference impedance setting
6 Main menu 16 Loaded data file name
7 Highlighted menu option 17 Disk write operation in progress
8 Submenu 18 Calibration status
9 Highlighted submenu option 19 Run/Hold status
10 Currently selected submenu option 20 USB/Battery status

SARK
SARKSARK
SARK-
--
-110
110110
110
User’s Manual
Rev 1.2.6 October 3
rd
, 2015 - 8 - © Melchor Varela – EA4FRB 2011-2015
4.2 Status Symbols Meaning
Calibrated
Calibration status Not calibrated
Measurements in progress
Run/Hold status Measurements on hold
Device operating from USB
USB/Battery status
Battery charge status when operating from battery
Disk Disk write operation in progress
4.3 Means of Input
There are four buttons and two navigation keys on the SARK-110.
Navigator A
Navigator A is used to navigate within the main menu (left side of the screen). The active option
is highlighted with a green background color.
Navigator B
Navigator B is used for changing the value of the highlighted option in the main menu (for Freq,
Span, Marker1, Marker2, LeftY and RightY) and to navigate within the popup submenus.
Run/Hold [►||]
The Run/Hold button is used to control the operating state of the SARK-110: Working or
Paused. In the paused state the signal generator and measurement circuits are inactive.
Note: when loading a stored data file the analyzer is automatically placed in a
paused state.

SARK
SARKSARK
SARK-
--
-110
110110
110
User’s Manual
Rev 1.2.6 October 3
rd
, 2015 - 9 - © Melchor Varela – EA4FRB 2011-2015
Select [■]
The button is used to activate the popup submenu associated with the highlighted option and for
selecting the desired option within the popup submenu.
Note: Pressing any other button will cancel a selection.
Save Screen [●]
The Save Screen button is used to take a screenshot of the current screen. The screenshot is
stored on the internal flash disk.
Save Conf. [▲]
The Save Conf. button is used to store the complete analyzer state and settings. The stored
state is restored automatically after the device is powered on.
4.4 Changing the Frequency
There are two methods of editing the frequency (centre frequency for sweep modes):
(i) Use Navigator A to highlight «Freq» in the main menu on the left side of the display. Press
the Select [■] button to display the popup dialog associated with «Freq». Then use Navigator B
to change the frequency. The frequency will change according to the current frequency multiplier
that is highlighted in reverse video. Use Navigator A to change the frequency multiplier position if
needed. Press the Select [■] button to validate the frequency selection. Press any other button
to cancel the operation.
The screenshot below is of the frequency edit dialog, showing the highlighted frequency
multiplier positioned over digit 5 (frequency increments of 10 KHz).
(ii) Use Navigator A to highlight «Freq» in the main menu on the left side of the display. Then
use Navigator B to change the frequency. The frequency will change according to the current
frequency multiplier. The frequency multiplier can be changed from the popup dialog, see (i)
above.

SARK
SARKSARK
SARK-
--
-110
110110
110
User’s Manual
Rev 1.2.6 October 3
rd
, 2015 - 10 - © Melchor Varela – EA4FRB 2011-2015
Note: the span range will be adjusted automatically if the resultant upper or lower
frequency entry causes it to fall outside operational limits.
4.5 Changing the Span
There are two methods of editing the Span:
(i) Use Navigator A to highlight «Span» in the main menu on the left side of the display. Press
the Select [■] button to display the popup dialog associated with «Span». Then use Navigator B
to change the span. The span will change according to the current span frequency multiplier that
is highlighted in reverse video. Use Navigator A to change the span frequency multiplier position
if needed. Press the Select [■] button to validate the span selection. Press any other button to
cancel the operation.
The screenshot below is of the span edit dialog, showing the span frequency multiplier
positioned over digit 7 (frequency increments of 1 MHz).
(ii) Use Navigator A to highlight «Span» in the main menu on the left side of the display. Then
use Navigator B to change the span. The span will change according to the current span
frequency multiplier. The span frequency multiplier can be changed from the popup dialog, see
(i) above.
4.6 Frequency Presets
The analyzer provides predetermined frequency and span settings including the amateur radio
bands and other suitable settings. Use Navigator A to highlight «Preset» in the main menu.
Press the Select [■] button to activate the Preset popup submenu. Use Navigator B to highlight
the desired preset. Press the Select [■] button to validate the preset selection. Press any other
button to cancel the operation.
See in the screenshot below the available presets:

SARK
SARKSARK
SARK-
--
-110
110110
110
User’s Manual
Rev 1.2.6 October 3
rd
, 2015 - 11 - © Melchor Varela – EA4FRB 2011-2015
4.7 Using Markers
The SARK-110 has two markers that can either be manually positioned by the user or set to
operate in automatic tracking mode. The markers indicate the horizontal and vertical position of
the point on which they are positioned. The horizontal position of a marker is shown by a dotted
vertical line which extends from the top to the bottom of the measurement diagram. The markers
information window, in blue background, shows the frequency (or distance in cable test mode)
and the two values that correspond to the plotted values at each of the markers.
Use Navigator A to highlight either «Marker1» or «Marker2» in the main menu.
Press the Select [■] button to activate the Marker popup submenu. Available options are:
«Enable» for activating or deactivating the marker, «Select» for selecting or deselecting the
marker, and «Tracking» for selecting the tracking mode; see screenshot below:
The «Select» option activates or deactivates the display of detailed parameters at the marker
position. The screenshot below shows Marker1 in the selected state:

SARK
SARKSARK
SARK-
--
-110
110110
110
User’s Manual
Rev 1.2.6 October 3
rd
, 2015 - 12 - © Melchor Varela – EA4FRB 2011-2015
The automatic tracking feature makes positioning of the markers easier, thus helping the user to
speed up measurements.
The following tracking modes are available:
•Peak Min (p)
•Peak Max (P)
•Absolute Min (m)
•Absolute Max (M)
•Value Cross Any (X)
•Value Cross Up (^)
•Value Cross Down (v)
The automatic positioning of markers is activated in the «Tracking» sub-option. Select the
tracking mode from any of the modes above and then the applicable parameter to track. In
addition, a detection value must be specified for the Cross detection modes.

SARK
SARKSARK
SARK-
--
-110
110110
110
User’s Manual
Rev 1.2.6 October 3
rd
, 2015 - 13 - © Melchor Varela – EA4FRB 2011-2015
For example, you could set Marker 1 to automatically track the minimum VSWR values in the
trace: «Marker1» «Tracking» «Peak Min» «VSWR»; and Marker 2 to track the crossovers on
the 50-ohm impedance value: «Marker2» «Tracking» «Cross Any»«Z» «50.0».
You could also program the unit to detect the bandwidth by setting «Marker1» «Tracking»
«Cross Down» «VSWR» «2.0»; and «Marker2» «Tracking» «Cross Up»«VSWR» «2.0».
Navigator B will be used to move to the different detection points, except for the Max and Min
tracking modes where logically there is only a single detection point.
The tracking mode for each marker is shown in the markers information window. This
information is displayed in red if either the data is not available or if the tracking condition cannot
be resolved; otherwise it is displayed in green.
The screenshot below shows Marker1 tracking the minimum value of VSWR and Marker 2,
tracking all |Z| crossing at 50-ohms:
The «Info» option displays detailed information of the readings at the marker position, including
the difference in frequency between both markers. One possible use of this feature is
determining the VSWR bandwidth of an antenna.

SARK
SARKSARK
SARK-
--
-110
110110
110
User’s Manual
Rev 1.2.6 October 3
rd
, 2015 - 14 - © Melchor Varela – EA4FRB 2011-2015
4.8 Changing the Vertical Axis Parameter
In Scalar Chart mode, the SARK-110 can display two traces from any of the available
parameters for the vertical axis. Use Navigator A to highlight either «LeftY» or «RightY» in the
main menu.
There are two methods of changing the selected vertical axis parameter:
(i) Press the Select [■] button to activate the LeftY or RightY popup submenu. Use Navigator B
to highlight the desired submenu parameter option. Press the Select [■] button to validate the
selection. Press any other button to cancel the operation.
The screenshot below shows the available parameters for the vertical axis:
(ii) Use Navigator B when either the «LeftY» or «RightY» option is highlighted. Options are
selected sequentially.
4.9 Saving and Recalling Measurements
The SARK-110 has the capability to store measurements to the internal disk and recall them
either to review the data later in the analyzer screen or to download the data from the USB disk
to a PC for further analysis using SARK Plots or the ZPLOTS Excel application, available from
http://www.ac6la.com/zplots.html.
Use Navigator A to highlight «File» in the main menu for data file operations.
Press the Select [■] button to activate the File popup submenu. Use Navigator B to highlight the
desired submenu File option.
«Save Data File»
The Save Data File option enables the current measured data to be saved for further review:

SARK
SARKSARK
SARK-
--
-110
110110
110
User’s Manual
Rev 1.2.6 October 3
rd
, 2015 - 15 - © Melchor Varela – EA4FRB 2011-2015
After selecting the «Save File» submenu option, enter the file name. By default, the file name
has the format “sark_xxx.csv” (or “sark_xxx.tdr” for Cable Test mode), where xxx is an
automatically assigned number. To change the file name, use Navigator B to change the
character value and Navigator A to change the character position highlighted in inverse video.
Press the Select [■]button to validate the selection. Press any other button to cancel the
operation.
«Load Data File»
To retrieve the stored data, select the «Load Data File» submenu option. A second popup
submenu is displayed with a list of available files. Use Navigator B to highlight the desired file.
Press the Select [■] button to validate the selection. Press any other button to cancel the
operation. Once the file is selected, the data is loaded and plotted.

SARK
SARKSARK
SARK-
--
-110
110110
110
User’s Manual
Rev 1.2.6 October 3
rd
, 2015 - 16 - © Melchor Varela – EA4FRB 2011-2015
«Load Bitmap File»
Use the «Load Bitmap File» option to display a captured screenshot. Press the Select [■] button
to finalize the operation.
«Browse Bitmaps»
Select the option «Browse Bitmaps» from the «File» menu to review the captured screenshots.
Use Navigator B to select the different bitmaps. Press the Select [■] button to finalize the
operation.
«Delete File»
Use the «Delete file» option to delete a single file on the device disk.
When selecting the «Delete File» option a popup submenu will be displayed with the list of
available files. Use Navigator B to highlight the desired file. Press the Select [■] button to
validate the selection. Press any other button to cancel the operation.

SARK
SARKSARK
SARK-
--
-110
110110
110
User’s Manual
Rev 1.2.6 October 3
rd
, 2015 - 17 - © Melchor Varela – EA4FRB 2011-2015
«Delete All»
Use the «Delete All» option to delete all user files.
When selecting the «Delete All» option, a confirmation dialog box is activated to prevent an
accidental deletion.
«Deep Sweep Save»
The deep sweep save function provides the capability of saving measurements with higher
accuracy and resolution. It permits a higher number of frequency points to increase the
frequency resolution to be specified and uses the higher accuracy settings during the sweep
scan; this means a double sampling rate and an average of four measurements per single
frequency point.
In addition, this function enables a user programmable timeout for the automatic start of
measurements to be specified. This function is similar to the self-timer function on cameras.
In order to use this function, first set the frequency and span range in any of the sweep modes
such as Scalar Chart, and then select «File» «Deep Sweep Save». The procedure is as follows:

SARK
SARKSARK
SARK-
--
-110
110110
110
User’s Manual
Rev 1.2.6 October 3
rd
, 2015 - 18 - © Melchor Varela – EA4FRB 2011-2015
Enter the file name.
Enter the number of frequency points.
Minimum value is 258 and maximum
value is 10000.
Specify an optional delay for the
automatic start of the measurements
(self-timer function).
When a Delay is specified, a countdown
will commence.

SARK
SARKSARK
SARK-
--
-110
110110
110
User’s Manual
Rev 1.2.6 October 3
rd
, 2015 - 19 - © Melchor Varela – EA4FRB 2011-2015
Otherwise, press the appropriate button
to continue.
After completing the sweep scan, the
analyzer will save the results of the sweep
scan to the file.
Notice that the scan time is much longer
than usual due to the higher accuracy
setting and the additional number of
points.
Press the appropriate button to continue.
4.10 Taking Screenshots
Press the Save Screen [●]button to capture the current screen. Then enter the file name. By
default the file name has the format “sark_xxx.bmp”, where xxx is an automatically assigned
number. To change the file name, use Navigator B to change the character value and Navigator
A to change the character position highlighted in inverse video. Press the Select [■]button to
validate the selection. Press any other button to cancel the operation.
Select the option «Load Bitmap File» or «Browse Bitmaps» from the «File» menu to review the
captured screenshots. Also, they can be reviewed on a PC because they are in Windows bitmap
compatible format.

SARK
SARKSARK
SARK-
--
-110
110110
110
User’s Manual
Rev 1.2.6 October 3
rd
, 2015 - 20 - © Melchor Varela – EA4FRB 2011-2015
Note: the bitmap files use a significant amount of disk (48 or 94kB per screenshot)
4.11 Changing the Operating Mode
Use Navigator A to highlight «Mode» in the main menu.
Press the Select [■] button to activate the Mode popup submenu; see the screenshot below:
Use Navigator B to highlight the desired submenu mode option. Press the Select [■]button to
validate the selection. Press any other button to cancel the operation.
4.12 Changing the Settings
Use Navigator A to highlight «Setup» in the main menu.
Press the Select [■] button to activate the Setup popup submenu; see the screenshot below:
Use Navigator B to highlight the desired submenu setup option. Press the Select [■]button to
validate the selection. Press any other button to cancel the operation.
Setup – Rotate Screen
The Rotate Screen setup menu option can be used to flip the screen so that the device can be
used upside down.
Table of contents