Sea-Bird Scientific SUNA V2 User manual

User manual
SUNA V2
Submersible Ultraviolet Nitrate Analyzer
Document No. SUNA170925
Release Date: 2017-09-25
Version: E
425-643-9866
seabird.com


Table of Contents
Section 1 Specifications.................................................................................................................... 3
1.1 Mechanical................................................................................................................................... 3
1.1.1 Bulkhead connector.............................................................................................................3
1.2 Electrical.......................................................................................................................................3
1.3 Optical.......................................................................................................................................... 4
1.4 Analytical...................................................................................................................................... 4
1.4.1 Nitrate measurement accuracy........................................................................................... 4
1.4.2 Nitrate measurement precision........................................................................................... 4
Section 2 Operation............................................................................................................................ 5
2.1 Install and start software.............................................................................................................. 5
2.2 Verify sensor operation................................................................................................................ 6
2.2.1 Set up baud rate.................................................................................................................. 6
2.3 Verify sensor collects data........................................................................................................... 6
2.3.1 Monitor data in spectra graph .............................................................................................8
2.3.2 Monitor data in time series graph........................................................................................ 8
2.3.3 Monitor data in absorbance graph.......................................................................................9
2.4 Verify sensor transfers data......................................................................................................... 9
2.5 Set up sensor for deployment.................................................................................................... 10
2.5.1 Attach sensor to cage........................................................................................................10
2.5.2 Set up for autonomous deployment.................................................................................. 11
2.5.3 Set up for SDI-12 deployment........................................................................................... 12
Section 3 Maintenance..................................................................................................................... 13
3.1 Sensor maintenance.................................................................................................................. 13
3.2 Maintenance for bulkhead connectors and cables..................................................................... 13
3.3 Update reference spectrum........................................................................................................14
3.4 Update firmware......................................................................................................................... 17
Section 4 Reference..........................................................................................................................19
4.1 Software settings........................................................................................................................19
4.1.1 Communication................................................................................................................. 19
4.1.1.1 File types.................................................................................................................. 20
4.1.2 Continuous and fixed-time operation.................................................................................21
4.1.3 Periodic operation............................................................................................................. 21
4.1.4 Logger-controlled operation.............................................................................................. 22
4.1.5 Analog operation............................................................................................................... 23
4.1.6 Other general settings....................................................................................................... 24
4.1.7 Data acquisition monitor.................................................................................................... 25
4.1.8 Options to process data.................................................................................................... 25
4.1.8.1 Convert SUNA raw data........................................................................................... 26
4.1.8.2 Reprocess SUNA data............................................................................................. 27
4.1.8.3 Replay SUNA data................................................................................................... 29
4.1.8.4 Compare reference spectrum files........................................................................... 30
4.2 SDI-12 operation........................................................................................................................ 30
4.3 Terminal program....................................................................................................................... 34
4.3.1 Input-output configuration values...................................................................................... 36
4.3.2 Data collection setup values..............................................................................................36
4.4 Theory of operation.................................................................................................................... 37
4.4.1 Background....................................................................................................................... 37
4.4.2 Description of nutrient units............................................................................................... 38
4.4.3 Nitrate concentration......................................................................................................... 38
4.4.4 Description of adaptive sampling...................................................................................... 38
4.4.5 Sensor calibration from manufacturer............................................................................... 38
1

4.5 Interferences and mitigation....................................................................................................... 38
4.5.1 Uncharacterized species in sample...................................................................................38
4.5.2 Optically dense constituents..............................................................................................39
4.5.3 Identification of interfering species.................................................................................... 39
4.5.4 Sensor function................................................................................................................. 39
4.6 CDOM absorption...................................................................................................................... 40
4.7 Optional equipment.................................................................................................................... 41
4.7.1 Wiper................................................................................................................................. 41
4.7.2 Anti-fouling guard.............................................................................................................. 41
4.7.3 Flow cell............................................................................................................................ 42
Section 5 Troubleshooting..............................................................................................................43
5.1 SUNA warnings and error messages......................................................................................... 45
Section 6 General information....................................................................................................... 47
6.1 Warranty.....................................................................................................................................47
6.2 Service....................................................................................................................................... 47
6.3 Waste electrical and electronic equipment................................................................................. 47
Table of Contents
2

Section 1 Specifications
1.1 Mechanical
SUNA with optional wiper Standard SUNA
Rated depth 100 m 500 m
Weight (in air) 4.8 kg 3.9 kg
Pathlength 10 mm 5 mm 10 mm 5 mm
Length 58.8 cm 58.3 cm 55.1 cm 54.6 cm
Displacement 2077 cm³ 2073 cm³ 1692 cm³ 1688 cm³
Diameter 6.3 cm
Material Titanium (acetal wiper)
Temperature range,
operation
0–35 °C
Temperature range, dry
storage
-20–50 °C
1.1.1 Bulkhead connector
Contact Standard Optional (USB/SDI-12) MCBH-8-MP
1 Voltage in 8–18 VDC (15 VDC for sensors with wiper)
2 Ground
3 — USB 5 V power
4 — SDI-12
5 RS232 TX RS232 TX/USB D+
6 RS232 RX RS232 RX/USB D-
7 — Analog V out
8 — Analog current out
1.2 Electrical
Input 8–18 VDC
Input, sensor with wiper 8–15 VDC
Current draw, operation ~625 mA at 12 V (nominal)
Current draw, supervised low
power (periodic mode)
< 30 µA
Current draw, processor low
power (controlled mode)
< 3 mA
Current draw, standby
(SDI-12 mode)
~20 mA at 12 V
Baud rate 57600 (9600, 19200, 38400, 115200 available)
Communication interface RS232 (USB and SDI-12 optional)
Data storage 2 GB (optional)
3

1.3 Optical
Spectral range 190–370 nm
Light source UV deuterium lamp
Light source lifetime 900 hrs
1.4 Analytical
This sensor is designed to measure the concentration of nitrate ions in water.
Measurements are in units of micro molar (µM). This is converted into mg/L, and also
digital output. Note that 1 µM nitrogen = 0.014007 mg/L nitrogen.
1.4.1 Nitrate measurement accuracy
Table 1 5 mm pathlength
Concentration range Class-based fresh water Fresh water Seawater
Best 0.063 mgN/L (4.5 µM) 0.056 mgN/L (4 µM) 0.056 mgN/L (4 µM)
up to 1000 µM (14 mgN/L) 20% 10% 10%
up to 2000 µM (28 mgN/L) 25% 15% 15%
up to 3000 µM (42 mgN/L) 25% 15% 15%
up to 4000 µM (56 mgN/L) 25% N/A N/A
Table 2 10 mm pathlength
Concentration range Class-based fresh water Fresh water Seawater
Best 0.035 mgN/L (2.5 µM) 0.028 mgN/L (2 µM) 0.028 mgN/L (2 µM)
up to 1000 µM (14 mgN/L) 20% 10% 10%
up to 2000 µM (28 mgN/L) 25% 15% 15%
up to 3000 µM (42 mgN/L) 30% 20% 20%
up to 4000 µM (56 mgN/L) N/A N/A N/A
The specified accuracy is best accuracy or a percentage, whichever is more.
• A sensor-specific calibration uses extinction coefficients from the sensor itself.
• A class-based calibration uses extinction coefficients that are the average of many
sensors.
1.4.2 Nitrate measurement precision
Processing configuration Seawater or fresh water with T-S
correction
Seawater (0–40 psu)
Short-term precision (3 sigma) and limit of detection 0.3 µM (0.004 mgN/L) 2.4 µM (0.034 mgN/L)
Change ("drift") per hour of lamp time < 0.3 µM (< 0.004 mgN/L) < 1.0 µM (< 0.014 mgN/L)
Limit of quantification 1.0 µM (0.014 mgN/L) 8.0 µM (0.112 mgN/L)
Specifications
4

Section 2 Operation
WARNING
Nitrate sensors use an ultraviolet (UV) light. Do not look directly at a UV light when it is on. It can
damage the eyes. Keep products that have UV light away from children, pets, and other living
organisms. Wear polycarbonate UV-resistant safety glasses to protect the eyes when a UV light is
on.
CAUTION
Do not supply more than 15 VDC to the sensor. More than 15 VDC will damage the wiper.
2.1 Install and start software
The manufacturer-supplied software communicates with a number of sensors. Refer to
the manufacturer's website for the current list of sensors that use this software.
Make sure that the sensor is not connected to the USB port of the PC while the USB-
Serial driver is installed. The USB will not function correctly and communication errors will
occur.
1. Get the software from manufacturer's website or the manufacturer-supplied CD.
2. Install the appropriate software.
a. For Windows™: Double-click on the file with ".exe" appended to the name.
b. For Mac OS X: Double-click on the file with ".pkg" appended to the name. Make
sure that the default "Install for all users on this computer" is selected as the
destination for the installed software. If "Install for me only" or "Install on a
specific disk" is selected, the USB will not connect to the sensor.
3. Push Run in the new window.
The setup wizard starts.
4. Follow the on-screen instructions to install the software.
• It is only necessary to install the USB-to-Serial driver when the software is first
installed.
5. Connect the cable to the bulkhead connector on the sensor and to the PC.
6. If necessary, start the software.
7. Push Connect in the Dashboard area.
8. If necessary, change the "Instrument Type" to the connected sensor.
9. Put a check in the "Try All Baud Rates" box.
The software automatically finds the correct baud rate.
10. If necessary, select the communication port.
11. Push Connect.
The "Connection Mode" shows "Transition" on a yellow background, and then shows
"Setup" on a green background.
12. Select the UCI menu, then Preferences.
13. Go to the General tab and push Browse to find or make the Default Data Directory
on the PC.
Data from the sensor is saved here.
14. Push OK.
5

2.2 Verify sensor operation
Do the steps below to make sure that the sensor operates, collects, and transfers data
with the settings selected by the user before further setup and deployment.
1. Connect the cable to the bulkhead connector on the sensor and to the PC.
2. Connect the USB or RS232 cable to the PC.
For RS232: connect the power connectors on the cable to a 8–15 VDC power supply.
For USB: a DC power supply is only necessary for data collection. If the sensor is
equipped with internal memory, the file system will show as a USB mass storage
device on the PC.
3. If necessary, start the software.
4. RS232: turn on the power supply.
5. Push Connect in the Dashboard area.
6. If necessary, change the "Instrument Type" to the connected sensor.
7. Put a check in the "Try All Baud Rates" box.
The software automatically finds the correct baud rate.
8. If necessary, select the communication port.
9. Push Connect.
The "Connection Mode" shows "Transition" on a yellow background, and then shows
"Setup" on a green background.
10. Select the UCI menu, then Preferences.
11. Go to the General tab and push Browse to find or make the Default Data Directory
on the PC.
Data from the sensor is saved here.
12. Push OK.
2.2.1 Set up baud rate
It is not necessary to change the baud rate for deployment, but the user can set a faster
baud rate to transfer data after a deployment.
Available baud rates:
• 4800
• 9600
• 19200
• 38400
• 57600
• 115200
2.3 Verify sensor collects data
1. Push Start in the Dashboard area.
The "Connection Mode" shows "Acquisition."
• Push OK so that the software shows "Temporarily enabling Transmit Real Time
Setting...". The software shows the data as it is collected in the Time Series tab.
• The Expected Data Start window shows "You will see data in approximately
103 seconds" and shows an indication of time left. This lets the sensor become
stable before it starts to collect data.
2. From the View menu, select the options to see the data:
Operation
6

•Real Time Data—Put a check in each box next to each parameter for which the
sensor will collect data.
•Data Logging—Push Start Log to save the collected data to the PC.
•Time Series, Spectra, and Total Absorbance graphs.
3. Put a check in the box next to any additional parameters, so that they will show in the
Time Series graph.
4. Look at the data in the Time Series graph. The user can look at data in real-time for
each sensor that has power supplied, is connected and is in communication with the
software.
• Put a check in the box next to "Time Axis" to push Zoom In and Zoom Out to
change the scale of time.
• Put a check in the box next to "Range Axis" to push Zoom In and Zoom Out to
change the scale of the data.
• To move the data in any direction, push the "Ctrl" key on the PC keyboard and
the left button of the mouse pointer at the same time.
• To select a specific part of the data to zoom in on, pull the mouse pointer
diagonally (refer to the arrow in the graph below).
Operation
7

• Push Auto Range to see the data for each selected parameter. The software
adjusts the scale so that the data will always show.
• Push Default Ranges to go back to the manufacturer-set default scale for each
parameter.
• Put a check in the box next to "Show Data Points" to see the value of the
collected data when the mouse moves over each point.
• Push Select Sensors To Display to change the parameters to look at in the
Time Series graph.
5. Let the sensor or sensors collect data for approximately 5 minutes.
2.3.1 Monitor data in spectra graph
The Spectra graph shows both the dark and light data in raw counts.
The dark counts are from thermal noise. The light counts are the measured output minus
the dark counts.
The measured spectrum is always flat below 200 nm, and then has four or five peaks.
The peaks are approximately 25 nm apart in the lower wavelength range and up to 50 nm
apart in the upper range.
2.3.2 Monitor data in time series graph
The Time Series graph shows the nitrate concentration and any selected optional values.
Use this graph to replay data that is stored in the sensor.
Operation
8

1. Put a check in the box next to either or both the "Time Axis" or the "Range Axis" to
enable the Zoom In or Zoom Out options.
2. Push Select Sensors either in the Spectra graph or in the Real Time Display tab to
select the parameters to see on the graph.
3. Push Configure to put a limit on or to remove the limit to the "Graph History."
2.3.3 Monitor data in absorbance graph
The Total Absorbance graph shows the calculated absorbance from 210 to 370 nm. This
graph is an alternative to the Spectra graph. The absorbance graph should be flat when a
sample of DI water is collected. The absorbance increases as absorbing species such as
nitrate and bromide are added to samples.
If necessary, push Stop.
2.4 Verify sensor transfers data
CAUTION
Use only the batteries recommended by the manufacturer as replacements. Do not mix new and
used cells or chemistries.
If the sensor is equipped with internal memory, the collected data is saved in the sensor.
1. Push Transfer Files in the SUNA Dashboard area.
The files saved by the sensor show on the right side of the new File Manager
window.
Operation
9

2. Select one or more files to copy to the PC.
The manufacturer recommends that the user use a USB connection to move the files
because it is much faster.
3. Push the <- arrow to start the move.
The status shows at the bottom of the File Manager window.
4. Open the file on the PC to make sure it has all of the collected data.
2.5 Set up sensor for deployment
2.5.1 Attach sensor to cage
The sensor can be attached to a cage or pipe for deployment. Make sure that the sensor
is attached correctly or the sensor may be damaged. The manufacturer recommends that
the sensor operates in a horizontal orientation with the optical area pointed down to
reduce the collection of sediment and bio-fouling.
If the sensor has a wiper—
• Do not use the wiper as a handle.
• Do not attach the sensor to a cage or pipe at the wiper.
• Do not let the wiper touch any part of a cage or pipe.
1. Use cradle clamps to attach the sensor to a flat surface such as a cage.
2. Make sure that both ends of the sensor are attached to a cage or pipe. Do not leave
one end unattached, such as at the end of a pipe.
3. The user can attach the sensor to a cage with hose clamps:
• Put several layers of electrical tape around the sensor to protect the pressure
housing.
• Put clamps over the electrical tape.
4. The user can deploy the sensor in an autonomous or a logger-controlled mode.
Operation
10

2.5.2 Set up for autonomous deployment
Autonomous modes
•Continuous operation—when started, the sensor operates until the user removes
power or pushes Stop in the SUNA Dashboard.
•Fixed-time operation—the sensor operates for a user-specified period of time or
number of measurements.
•Periodic operation—the sensor operates at user-specified intervals. Data collection
begins at a user-specified date and time and stops when the user removes power or
pushes Stop in the SUNA Dashboard.
Example: a sensor set up at 8:00 with a "Sample Interval" of 2 hours and an offset of
900 seconds (15 minutes) will operate at 10:15, 12:15, 2:15, etc.
1. Make sure that the sensor is connected to a power supply and PC (RS232 or USB
cable) and is on.
2. Make sure that the software is open and in communication with the sensor.
3. Push SUNA Settings in the SUNA Dashboard area.
4. Select the "Operational Mode" for the planned deployment.
5. Use the manufacturer-set values for that operation mode or change them as
necessary.
6. If the sensor has an integrated wiper, put a check in the "Integrated Wiper Enabled"
box.
The wiper operates one time data is collected, but no more than once per hour.
7. If the sensor is to be deployed in fresh water but has a calibration for seawater, select
the Advanced tab and put a check in the "Deployed in Fresh Water" box.
8. Push Upload to save the settings in the sensor.
9. Push OK to save any changes, or push Cancel to close the window with no changes.
10. Go to the UCI menu at the top of the software window and select Exit (Ctrl-e).
11. Exit the software:
• Push No to close the software.
Turn off the sensor, remove from the power supply and attach the protective
dummy connector and lock collar.
• Push Yes to close the software and start the sensor. The sensor will collect data
immediately if the user selected "Continuous" or "Fixed-time" or at the user-
specified time if "Periodic" was selected.
Operation
11

2.5.3 Set up for SDI-12 deployment
Note: SDI-12 operation is not available on sensors rated to 2000 m.
The user can deploy the standard-depth sensor in a logger-controlled mode through an
RS232 connection or an SDI-12 controller.
1. Set up the sensor in SDI-12 mode to operate with a controller.
2. Make sure that the sensor is connected to and in communication with the software.
3. Push SUNA Settings in the SUNA Dashboard.
4. At the General tab, select the "SDI 12 Operational Mode."
5. If necessary, change the "Number of Measurements per Frame."
The sensor calculates the average of the value entered. For example, if "5" is
entered, 5 measurements will be averaged and will show as one measurement in the
data.
6. If the sensor is so equipped, put a check in the "Integrated Wiper Enabled" box.
The wiper operates before each measurement.
7. The default "Logging Level" is INFO.
8. Push Upload.
A new window shows.
9. Push Yes to put the SUNA into SDI-12 mode.
The sensor is ready to connect to an SDI-12 data logger.
Operation
12

Section 3 Maintenance
3.1 Sensor maintenance
WARNING
If the user thinks that a sensor has water in the pressure housing: Put on safety glasses and make
sure that the sensor is pointed away from the body. Use the purge port (if the sensor is so
equipped), or very SLOWLY loosen the bulkhead connector to allow the pressure to escape.
Although the sensor is built for deployment in severe conditions, it is important to clean
the sensor after each deployment and weekly (if deployed frequently) or monthly to
prevent fouling. After every deployment, make sure to:
1. Attach a clean and lubricated dummy plug and a lock collar to the sensor.
2. Rinse the sensor with fresh clean water.
3. Flush the optical area with fresh clean water.
4. Dry the sensor.
Use a soft towel or blow with air.
5. Put the sensor in the manufacturer-supplied case for transport or storage.
3.2 Maintenance for bulkhead connectors and cables
WARNING
If the user thinks that a sensor has water in the pressure housing: Put on safety glasses and make
sure that the sensor is pointed away from the body. Use the purge port (if the sensor is so
equipped), or very SLOWLY loosen the bulkhead connector to allow the pressure to escape.
NOTICE
Connectors that have corrosion can cause a loss of data and increase the costs for service.
• Connectors that have corrosion can cause irreparable damage to the sensor.
• Do not use cleaners that contain petroleum or ketones.
• Do not use the cable to lift the sensor. The cable, cable splices, and bulkhead connectors can
be damaged.
• Attach cleaned and lubricated dummy connectors to the sensor immediately after each
deployment to prevent the bulkhead connector from damage.
• Do not connect or disconnect connectors under water.
Examine, clean, and lubricate bulkhead connectors each time they are connected.
Connectors that are not lubricated cause wear and tear on the rubber that seals the
connector contacts.
1. Clean the connector contacts with isopropyl alcohol. Apply as a spray or with a nylon
brush or lint-free swabs or wipes.
2. Flush the contacts with de-ionized or distilled water. Use a wash bottle with a nozzle
to flush inside the sockets.
3. Shake the socket ends and wipe the pins of the connectors to remove water.
4. Examine the sockets and the rubber on the pins to make sure there are no problems.
a. Use a flashlight and magnifying glass.
b. Look for cracks, frayed scores, and delamination of the rubber on the pins and
inside the sockets.
13

Table 3 Examples of damaged connectors
Corroded connector Damaged contact Damaged socket face
5. Use a finger to place a small quantity, approximately 1.5 cm in diameter of Dow
Corning® 4 Electrical Insulating Compound on the socket end of the connector.
Table 4 Lubricant on connector sockets
Lubricant on socket end of the connector Lubricant pushed into the sockets of the connector
6. Use a finger to push as much of the lubricant as possible into the sockets.
7. Connect the connectors.
There should be a small quantity of lubricant pushed to the sides of the connectors.
8. Clean the unwanted lubricant from the sides of the connectors.
The connectors are now lubricated and the connection is waterproof.
3.3 Update reference spectrum
The user needs to update the reference spectrum of the SUNA at regular intervals so that
the data that the sensor collects is accurate. It may also be necessary to update the
firmware, although that is not required very frequently.
A calibration file contains the data required to convert a spectral measurement into a
nitrate concentration. The calibration data are the wavelengths of the spectrum, the
extinction coefficients of chemical species and a reference spectrum relative to which the
measurement is interpreted. The sensor can store many calibration files, but only the
active file has a green background. Push Transfer Files > File Manager, then select the
Calibration Files tab to see the list of calibration files stored in the sensor.
Make sure to clean the sensor and the sensor windows at regular intervals and before
and after every deployment. Monitor the spectral intensity of the lamp. Although the
intensity will decrease over time, make sure there are no sudden changes.
Maintenance
14

Necessary supplies:
• Power supply
• PC with software
• Connector cable for sensor–PC–power supply
• Clean de-ionized (DI) water
• Lint-free tissues
• Cotton swabs
• Isopropyl alcohol (IPA)
• Parafilm® wrap
Notes
• Use only lint-free tissues, OPTO-WIPES™, or cotton swabs to clean the optical
windows.
• Use the software to update the reference spectrum.
• Use only clean DI water that has been stored in clean glassware.
• Use Parafilm® wrap to capture DI water in the optical area of the sensor. Do not use
cups, a bucket, or a tank to collect a reference sample.
1. Clean the sensor:
a. Flush the sensor and the optical area with clean water to remove debris and
saltwater.
b. Clean the metal parts external to the optical area so that the Parafilm® will seal.
c. Std. SUNA only: If the sensor is equipped with a wiper, carefully move it away
from the optical area.
Figure 1 Parafilm® to be wound around optical area
2. Cut and stretch a length of approximately 40 cm (16 in.) of Parafilm®.
3. Wind several layers of the Parafilm® around the metal near the optical area.
Figure 2 Parafilm® on optical area
4. Break a small hole in the top of the Parafilm® and fill the optical area with DI water.
Maintenance
15

Figure 3 Optical area filled with DI water
5. Supply power to the sensor and start the software if necessary.
6. Make sure that the sensor operates in Continuous mode: push Settings, then in the
General tab, select "Continuous" for the "Operational Mode."
7. Push Start.
• Push Start Logging to File to save approximately one minute of data to the PC.
8. Push Stop.
The sensor stops data collection.
9. Open the data file on the PC and calculate the average measurement value.
This is a "dirty" measurement to record the value when there are biofouling and
blockages in the optical area.
10. Remove the Parafilm® and drain the water from the optical area.
11. Clean the optical area:
a. Use DI water or IPA and cotton swabs and lint-free tissues to clean the windows.
b. Use vinegar to clean debris such as barnacles. Be careful that the windows do
not get scratches.
12. Flush the optical area with DI water to remove any remaining IPA or vinegar.
13. Wind Parafilm® around the metal near the optical area.
14. Break a small hole in the top of the Parafilm® and fill the optical area with fresh DI
water.
15. Supply power to the sensor and start the software if necessary.
16. Make sure that the sensor operates in Continuous mode: push Settings, then in the
General tab, select "Continuous" for the "Operational Mode."
17. Go to the Sensor menu, then select SUNA, then Reference Update.
18. Push Next.
In step 2, the sensor collects data.
19. Push Next.
In step 3, a graph shows the "Percent Change in Reference Spectra."
20. Push Next.
In step 4, the new reference values are uploaded to the sensor. The user can make a
report of the reference update.
If the measurement is ±2 µM (0.028 mgN/L) from the manufacturer-supplied
reference (±5 µM [0.056 mgN/L] for a 5 mm pathlength sensor), the sensor is within
the specification.
If the measurement is not within these specifications, do this procedure from step
9 until the measurement is within specification.
21. Remove the Parafilm® and drain the water from the optical area.
22. Flush the optical area with DI water.
Maintenance
16

3.4 Update firmware
At regular intervals, make sure that the current firmware is installed in the SUNA.
1. Go to the manufacturer's web site to get the current firmware for the sensor.
2. Save the firmware to the PC.
The firmware is an ".sfw" file.
3. Make sure that the sensor is connected to the PC and a power supply.
4. Push Connect.
5. Go to the Sensor menu and select SUNA, then Advanced, then Upload Firmware
File.
6. Push Browse to find the firmware file that is saved on the PC.
7. Push Open.
8. Push Upload.
It takes approximately 2 minutes for the software to be updated. The software
disconnects the sensor.
Maintenance
17

Maintenance
18
Other manuals for SUNA V2
1
Table of contents
Other Sea-Bird Scientific Measuring Instrument manuals
Sea-Bird Scientific
Sea-Bird Scientific SBE 11plus V2 User manual
Sea-Bird Scientific
Sea-Bird Scientific SUNA V2 User manual
Sea-Bird Scientific
Sea-Bird Scientific SBE 37 MicroCAT Quick manual

Sea-Bird Scientific
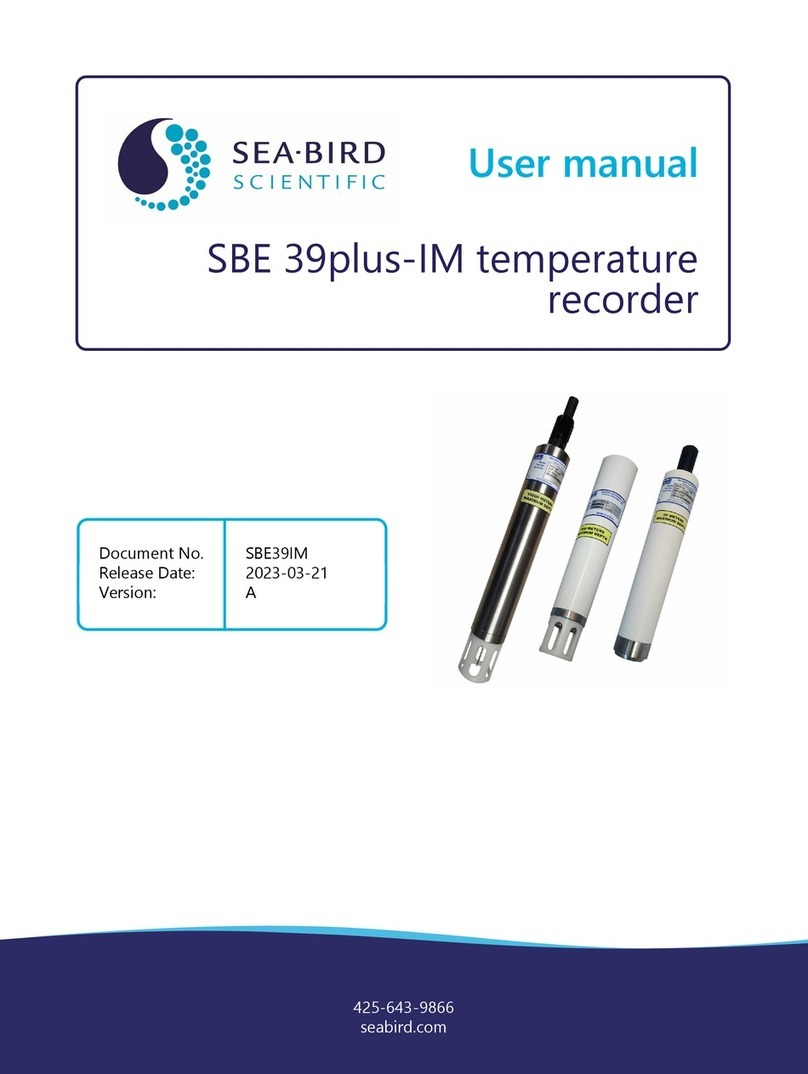
Sea-Bird Scientific SBE 39plus-IM User manual

Sea-Bird Scientific
Sea-Bird Scientific WQM-a User manual

Sea-Bird Scientific
Sea-Bird Scientific ECO-FLNTUS User manual

Sea-Bird Scientific
Sea-Bird Scientific OCR-504 User manual
Sea-Bird Scientific
Sea-Bird Scientific SBE 39plus User manual

