Starret DataSure User manual

DataSure™
Wireless Manager
Operator’s Manual

DataSure™ Operators Manual 2 PT 6*****
DataSure™ is a trademark of the L.S. Starrett Company. All rights reserved.

DataSure™ Operators Manual 3 PT 6*****
Contents
Section 1 Overview
1.1 Introduction
1.2 Features
1.3 Care and Maintenance
1.4 Hardware Definitions
1.5 Network Elements and Topologies
1.5.1 Routing Network – MESH
1.5.2 Routing Network – STRING
1.5.3 Hybrid MESH - STRING Networks
1.5.4 Network Options
1.5.5 Determining the Network Layout
1.5.5.1 Steps to layout your network
1.5.5.2 Tips for best performance
1.6 Software Definitions
1.7 Installation
1.7.1 Initial Startup
1.7.2 Device Identification
1.7.3 Virtual Multiplexers
1.7.4 External Application Setup
1.7.5 Basic Network Administration
Section 2 Operation
2.1 Data Collection
2.1.1 Quick Start
2.1.2 Data Logging
2.1.3 Applications
2.2 Remote Network Monitoring
2.3 Advanced Network Administration
Section 3 Troubleshooting
3.1 Common Problems and Solutions
3.2 Recommended Use Policies
3.3 RF Does & Don’ts
3.4 Monitoring Device Statistics
Appendix A: Application Interfaces
Appendix B: LED Blink Tables
Appendix x: Network Monitor

DataSure™ Operators Manual 4 PT 6*****

DataSure™™™ Operators Manual 5 PT 6*****
Section 1 Overview
1.1 Introduction
The Starrett DataSure™ wireless network is designed to allow the transfer of data from
electronic measuring tools to computers where measurements can either be easily logged
or conveyed to an SPC software package. The wireless network environment allows tool
operators to move freely without the constraints of data cables. The DataSure™ wireless
manager software provides a convenient user interface for network configuration,
management, and inspection.
Since many SPC packages are intended for use with wired data collection systems that
utilize multiplexers to connect a variety of tools together through an RS232
communications port, the DataSure™ software utility also fully emulates this approach.
The DataSure™ utility software enables operators to configure their wireless network,
and manage the flow of tool data to their target applications. Measurements can be
initiated either by the operator of the tool or solicited via computer software.
The following statement applies to each of the DataSure™ wireless devices (EndNode,
Router, Gateway):
This device complies with Part 15 of the FCC Rules. Operation is subject to the
following two conditions: (1) this device may not cause harmful interference, and (2) this
device must accept any interference received, including interference that may cause
undesired operation.
Changes or modifications not expressly approved by the L.S. Starrett Company could
void the user’s authority to operate the equipment.
1.2 Features
•916 MHz RF technology
•Freedom of movement and from data cables
•Up to 32 tools per virtual multiplexer
•Up to 5 virtual multiplexers
•A variety of exportable log file formats
•USB or RS 232 Gateway - PC interface
•Operating distance up to 25 meters (80 feet) for EndNodes
•Broadcast range up to 30 meters (97 feet) for Gateway and Routers
•System status feedback on the EndNode, including acknowledge of data received
•Adapts to electronic tools from various manufacturers
•No line-of-sight limitation
•Temporary data retention at the EndNode while outside the network
•Routers enlarge network range and improve robustness against radio interference
•Optional wall mount for Routers
•Routers equipped with a rechargeable battery backup

DataSure™ Operators Manual 6 PT 6*****
•EndNodes offer a choice of battery selection (CR2450 or CR2477)
•Gateway and Router antenna can be angled and swiveled to improve reception
1.3 Care & Maintenance
•Cleaning and handling instructions
External plastic surfaces of EndNodes, Routers, and Gateways may be cleaned with
Isopropyl Alcohol and a non-abrasive cloth. Care should be taken not to wet internal
surfaces or conductive cable ports. Antennae are delicate, and should be handled with
caution.
•Plug in cautions
•Environmental bounds of use, humidity, temp, etc.
•Battery replacement
1.4 Hardware Definitions
•Gateway
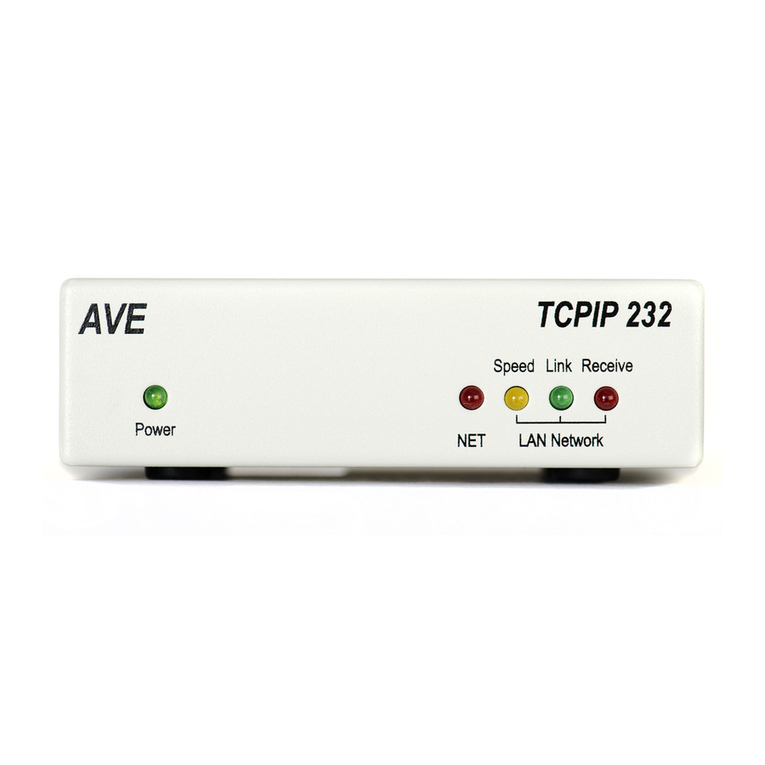
The Gateway is a radio device which provides a point of entry for the wireless
network to interface with software running on PC. Only one Gateway may be used
for a group of network elements. There are two status indicators on the Gateway; one
is a power indicator, and the other shows radio activity. The red is a power indicator,
and the green shows radio activity. The Gateway can be turned on or off via a sliding
power switch. Gateways are available with either an RS232 DB-9 connector, or a
USB port. Only RS232 enabled Gateways must be powered via an external AC wall
adapter (included). The power cable may be looped around the posts located near the
power entry jack on the rear of the Gateway. This provides strain-relief to guard
against accidental shutoff if the cable should become snagged and pulled away
unintentionally.
•Router
Routers are radio devices which provide robustness, range, and scalability to the
wireless network. They serve as intermediary steps between the EndNodes and a
Gateway. Routers should be installed within range of a Gateway, or else within
reaching distance of other Routers. EndNodes can be carried freely throughout a
network environment bounded by the overlapping ranges of Routers and the
Gateway. Adding more Routers to a network-enabled space further strengthens a
network by providing multiple paths for data transmissions to follow. Routers
operate automatically; they require no further operation beyond proper placement,
antenna orientation, and supplying of power. There are two status indicators on the
Router; one is a power indicator, and the other shows radio activity. The Router can
be turned on or off via a sliding power switch. Routers are powered via an external
AC wall adapter (included), and are also equipped with a rechargeable battery
backup. The power cables may be looped around the posts located near the power
entry jack on the rear of the Gateway. This provides strain-relief to guard against
accidental shutoff if the cable should become snagged and pulled away
unintentionally.

DataSure™ Operators Manual 7 PT 6*****
•EndNode
An EndNode is a radio which links a tool to the wireless network. EndNodes connect
into the tool’s data port in the same way that conventional wired cables do. Use the
pushbutton on the EndNode to send tool data. There are two status indicators on the
EndNode; one is green and the other is red (refer to Appendix B for instruction of
their meanings). When not in use, turn the EndNode off via the sliding power switch
to conserve battery life.
1.5 Network Elements and Topologies
Starrett’s EndNodes, Routers, and Gateways together form what is termed a wireless mesh
network. The mesh network topology is a robust approach to covering large areas with radio
connectivity. The robustness offered by the mesh network topology cannot be equaled by any of
the other common network topologies. In a mesh network, the reach or range can be extended,
redundancy added, and the general reliability of the network enhanced by simply adding more
routers. This may be needed to provide a “best route” for the radio signal, thereby increasing
throughput and reducing congestion. All routers in a mesh network can communicate with two or
more other routers. Thus, a mesh network is very robust in terms of reliability and redundancy. If
one radio/network node can no longer operate, all the rest can still communicate with each other,
directly or through one or more intermediate nodes. This precludes the practicality of point-to-
point or daisy chain network approaches. The latter has single point of failure. If one router in
this configuration ceases to function, then there is no capability for the network to recover.
Additionally, the data to be sent will never reach its destination. Mesh networks “self-heal” in
that if interference enters the environment, such as a strong and localized plume of RF noise, the
network has alternate paths for the data to traverse and therefore can reach its intended
destination.
Wireless network layouts vary depending on a wide variety of purposes, structural, geographical
and environmental conditions. Users may have a variety of needs from their wireless data
collection system, such as robustness and assured reliability, while others need many end-nodes
supported and added radio coverage in terms of range or reach.
1.5.1 Routing Network - MESH
Mesh networks work best when arranged in a cluster which inherently allow for multiple and
redundant links to be established between routers, thereby providing best penetration within
common geographical areas. This would normally be the case in an area such as a large milling
operation where measurements are taken in work cells spread around the area. Additionally, in
QA inspector roles where the inspector roams the shop floor, radio coverage offered by the
MESH allows autonomous EndNode sensor or measurement connectivity with the network while
within range of the nearest router. The MESH is the most robust of network topologies in that
there are many paths for the radio signals to traverse in the event of EMI or mechanical
interference.
1.5.2 Routing Network - STRING
Networks consisting of routers in a common line or ‘string’ dramatically increase radio range,
but at the cost of loosing redundancy or alternate link paths between the network routers.

DataSure™ Operators Manual 8 PT 6*****
Placement of the network routers to achieve the best reach or range, but redundancy is generally
affected.
Routers in this ‘string arrangement’ fall outside the definition of Mesh network topology, but
remain compatible with and support the network as a whole (See HYBRID MESH - STRING
networks below). STRING routing, while not a MESH, does offer additional network flexibility
in layout for remote buildings or measuring stations away from the general area.
Product Note: With the Starrett DataSure™, multiple networks can exist and operate under one
roof, but must have separate Group Numbers.
For example, in-line routing may be required in applications that follow a common line or
STRING, such as a production aisle where measuring stations flank both sides of the way. Other
applications where a common in-line system may be required are building-to-building networks,
remote measuring, and portable or ad hoc networks.
1.5.3 Hybrid MESH - STRING Networks
Networks consisting of both MESH and STRING combinations assure added flexibility needed
to meet specific user needs. The characteristics of the MESH and STRING layouts remain the
same as discussed above.
A Hybrid MESH and STRING network can be laid out to employ the mesh network attributes in
a common geographical area, while providing a string of routers to achieve additional reach or
range. User environments that might require a combination network would include access to
multiple buildings, work cells separated by large obstructions, remote measurement, parking
areas separating common operations, QA lab separated by production areas, and large electrical
interference fields.
1.5.4 Network Options
Covering large geographical areas is sometimes necessary but can be expensive to deploy the
many routers required to cover that space with adequate radio coverage.
Further, additional network traffic generated by the routers and the continual updating of each
node increase as the mesh becomes larger. This can result in unsatisfactory network
performance. When performance or cost is a concern, multiple work cells across a production/lab
area need not deploy a single, large and fixed network. Conflicting requirements in metrology
methods or budgets may also preclude a single ubiquitous DataSure™.
When autonomous operations or unrelated work cells have no need to have combined wireless
network management and/or data collection capabilities, then it may be prudent to install
multiple and separate DataSure™systems. Since the Starrett DataSure™ systems may have
wired IP network (LAN) connectivity, measurement data can be merged in a common, LAN
based database or file server, if needed. In this scenario, the individual networks can be made
more efficient than a single large mesh and have the benefit of lower cost.
1.5.5 Determining the Network Layout

DataSure™ Operators Manual 9 PT 6*****
With the Starrett DataSure™, EndNodes broadcast effectively within a 25-meter (80 feet)
radius, more or less. Routers and Gateway network nodes have a broadcast radius of 30 meters
(97 feet). With this knowledge, you can simply draw out a schematic floor plan of the area for
the DataSure™ system to be deployed in and superimpose circles of the scaled radio ranges for
each network element.
1.5.5.1 Steps to layout your network:
1. Render a floor plan of the shop area to be covered.
2. Locate work cells or locations where the measurements are to be taken on the floor plan.
3. Determine and locate any large obstruction or electrical noise source that radio coverage
will be blocked. Typically, radio coverage can be considered zero.
4. Draw scaled circles around the area in which the Gateway and Routers can or will be
placed (30 meters to scale).
5. Draw circles around the location or areas in which the EndNode radios will be used (25
meter to scale).
6. Where EndNode broadcast circles overlap or touch, with a Router or Gateway broadcast
circle, radio coverage is good.
7. Where gaps occur between Gateway, Routers, and EndNodes, you will have poor to zero
coverage. To resolve this gap problem, move the Routers closer to cover the area or add a
Router to fill the coverage gap.
8. In order to have contiguous coverage on your floor plan, you should have at least one
path from EndNode to Gateway with zero gaps in the diagram.
9. Take your floor plan out to the actual area and physically place routers and the gateway
in the locations indicated on the floor plan schematic.
10. Test the network to see if it works. If not, check for gaps in the actual coverage on the
shop floor.
1.5.5.2 Tips for best performance:
1. Make sure the batteries are good in the EndNodes. Battery condition and voltage value is
indicated on the DataSure™ ‘s Homepage.
2. Place Routers up high above machinery and their enclosures, but no more than 15 – 20
feet off of the floor or area in which measurements are to be taken.
3. If using a STRING configuration make sure radio coverage of adjacent Routers overlap
by several meters to insure good connectivity. Ideally the Routers are placed above
interference areas. (See #2 above)
4. Locate DataSure™ nodes away from known EMI sources:
5. When EndNodes are within the 25 meters distance to the nearest Router, but appearing to
not get received by the Gateway, it may be because the EndNode’s radio waves are being
shielded by a large metal enclosure or there is EMI in the immediate vicinity of the
measurement area. Remedies for this; is to either wait for the EMI to subside or insure
that the measurement button is pushed when the tool is in plain sight of the Router or
Gateway (which ever is closer).
6. Metal shields and blocks radio waves. Be diligent in locating and using all DataSure™
components away from metal expanses if possible. There is no danger, but radio
reception/broadcast range will diminish significantly. When Routers or Gateways are

DataSure™ Operators Manual 10 PT 6*****
mounted on structural/vertical I beams or metal wall panels, radio waves are shielded or
blocked behind the mounting plane of the units. Be aware that if you need coverage of
360 degrees around the router, the metal obstruction will limit the radiation of the radio.
7. EMI will disrupt radio waves and therefore be avoided. Be aware of known EMI
sources. Locating DataSure™ nodes near these will impair reception/broadcast range.
Some known industrial EMI sources are: induction hardeners, de-magnetizers,
magnetizers, high power electric motors, arc welders, high voltage power lines, high
voltage generators, wiring errors in buildings (incomplete ground to neutral connections),
MRI and NMR medical magnetic imaging systems. Additionally, structural steel in a
building can be magnetized when it is placed in a strong external dc magnetic field. This
usually occurs by sending strong DC currents through the material such as grounding
welding equipment to the steel during construction.
1.6 Software Definitions
•should/could be a “tour” of what is shown on Homepage
The DataSure™ software is structured as a series of web pages. All operation of its
menus is enacted within the confines of a web browser. Common to the tops of all pages
is a horizontal menu bar, which can be used to navigate from any point to each of the
main subject header menus:
Home:
The Homepage serves as a central location for inspection of tool measurements,
EndNode status and battery levels, and also shows association maps linking tools,
multiplexers, and applications. This is the first page a user will see when the
DataSure™ software started. The network service can be started or stopped from
the sidebar menu.
Tools:
The Network Devices page displays device summary details. It shows a list of all
data sources (tools) attached to the wireless network and provides links to their
detail pages. All device statistics can be reset from the sidebar menu.
Multiplexer:
The Multiplexers page displays the multiplexer summary details. It lists each
virtual multiplexer identified within the DataSure™ manager and provides links
to their detail pages. New multiplexers can be created from the sidebar menu.
Logs:
The Logs Summary page contains a tally of log details. It lists all network
activity logs by day and provides links to their detail pages. Log files can be
archived, restored, or viewed selectively sorted from the sidebar menu.
Applications:

DataSure™ Operators Manual 11 PT 6*****
The Applications page displays the applications summary details. It lists all
software packages associated with network data collection and provides links to
their detail pages. New applications can be identified from the sidebar menu.
Nodes:
The Network Nodes page displays the network nodes summary detail, including
the Group Number for the network hardware. It lists all the radio elements that
make up the wireless network and provides links to their detail pages.
Administration:
The Basic Administration page displays a summary and status of network
administration detail. It lists the basic level system settings. The sidebar menu
facilitates: Starting/stopping the wireless network, editing/saving/restoring the
basic system settings, clearing the log file, backup/restoration of the system
configuration database, and access to the Advanced Administration page.
Help:
Clicking on Help displays an interactive help document. It is a .PDF file, external
to the web browser.
(Clock):
Displays the current time according to the local system clock.
The DataSure™ system is comprised of a variety of software as well as hardware elements. The
table below provides a reference aid for clarifying the discussion of them:
Terminology and Abbreviations
TERM MEANING
Active The status of an EndNode that is healthy, communicating over the
network, and transmitting measurements.
Administration
Page
Displays a summary and status of network management detail. It
lists the basic level system settings, and provides a link to advanced
system settings.
Alert A warning or error notice regarding the health and/or performance of
a network element.
Application Software (may be 3rd party) that performs data collection, analysis,
reporting and other line of business functions.
Association A relationship that defines the path of data flow between system
elements.
Comm Port Facilitates RS-232 communication between hardware connected to a
PC and/or software package(s) running on a PC. A virtual or internal
comm port allows two software packages to interface with each other.
Channel A numbered association between a tool and a multiplexer. This is
also often referred to as a multiplexer port, or slot.
CSV Comma-separated-value – a file format used by Excel for
exporting/importing data from flat files.

DataSure™ Operators Manual 12 PT 6*****
TERM MEANING
Database A collection of all network settings, associations, devices, names, and
descriptions.
Device A tool which is attached to an EndNode.
Disconnected The status of an EndNode that is not associated with any
multiplexers.
EndNode A radio transmitter/receiver attached to a tool.
Gateway A radio transmitter/receiver attached to a PC. Only one Gateway
may be in use for a group.
Group Number A partitioning reference for all wireless network elements. Only
EndNodes, Routers, and Gateways of the same group number will
communicate with each other.
Health The health of an object is defined as good, marginal, or bad.
Home Page Provides a central location for inspection of tool measurements,
EndNode status and battery levels, and also shows association maps
linking tools, multiplexers, and applications.
Localhost The PC where the where the majority of DATASURE™ software
executes. The Gateway must be attached to this computer.
Log An audit/storage file for errors, warnings, information, status, data,
measurements, and other system events.
Meta-data Wireless system data, specifically not tool readings.
Multiplexer An instrument enabling the connection of multiple tools to an
application running on a PC. Virtual multiplexers within the
DATASURE™ software are intended to emulate the Starrett 761A
and 761B.
Network A self-contained collection of wireless nodes with the
DATASURE™ software supporting data collection and analysis
application(s).
Node A base network element such as gateways, Routers, and EndNodes.
Object A Device, Node, or Application. System logs can be viewed by
object.
Offline An offline object is one that was recently idle/active but is currently
not healthy and/or communicating due to out-of-range, dead battery,
or some malfunction.
Online The status of a tool that is a part of the wireless network, but is not
yet ready to transmit data.
PC Abbreviation for personal computer (see Localhost and Remote PC).
Port See Channel.
Ready The status of a tool that is ready to transmit data.
Real-time Data/event management “as it occurs”.
Remote PC A PC networked to the localhost computer running the
DATASURE™ software.
Router A network node that extends the communication range by
automatically forwarding signals between EndNodes, other Routers,
and the Gateway.
Sampling The periodic rate at which EndNodes are contacted by the Gateway

DataSure™ Operators Manual 13 PT 6*****
TERM MEANING
Interval
Setting System configuration parameters that globally affects network
function.
Solicited An event such as a measurement that occurs due to a request made by
the PC and/or the PC user.
UID Read-only unique identifier of a device set in at time of manufacture.
Unknown The status of a tool that is of undeterminable standing within the
network.
Unsolicited An event such as a measurement that is triggered by the tool operator
at the tool as opposed to the PC and/or the PC user.
1.7 Installation
List what baseline is needed to begin an installation
HW requirements
Windows components requirements e.g.: IIS and .NET framework
Microsoft, Windows, Excel, and .NET Framework is either registered trademarks or
trademarks of the Microsoft Corporation in the United States of America and/or other
countries. All rights reserved.
1.7.1 Initial Startup
1. Begin with install shield procedure,
and go to first loading of the homepage
System set up
When the DataSure™ utility software is initially launched, the first screen shown is the
Homepage. From the sidebar menu, the operator should begin by clicking on ‘Start
Wireless Network’. This starts the service program which engages the wireless network
hardware. The DataSure™ software can be configured whether the Network has been
started or not. However, interaction with the wireless network can only commence once
it has been started.
1.7.2 Device Identification
To bring a tool in the DataSure™ network the operator has only to plug an EndNode into
the tool’s data port and power them both on. When the EndNode comes within range of
a Router or the Gateway, it will be automatically recognized by the wireless service. By
default, the device will initially be named “Tool at n”, where n is the UID number
assigned to that EndNode at the time of its manufacture.
From the Homepage, the device’s identity can be verified by clicking on the ‘Locate’
button. This will cause the green LED on the targeted EndNode to blink repeatedly until
the ‘Stop’ button has been clicked.
To edit a device, click on the ‘Tools’ link in the site navigation menu bar. Then select a
tool name from the Device List. It’s also possible to go directly to a specific Device

DataSure™ Operators Manual 14 PT 6*****
Detail page by clicking on the tool’s icon on the Homepage.
The tool’s name, description, device type, and enabled logging may all be entered or
customized by clicking on ‘Edit Device’ and then making the entries in the fields
provided. Changing the device type will determine which icon will appear beside the
tool on pages where device details are displayed. Finally, from the sidebar click on ‘Save
Changes’.
1.7.3 Virtual Multiplexers
A multiplexer is an instrument which enables the connection of multiple tools to an
application running on a PC. Virtual multiplexers within the DataSure™ software are
intended to emulate the Starrett 761A and 761B. The emulated multiplexer systems can
accommodate up to 32 tool channels. It is possible to run the network service with a
maximum of five multiplexers configured at the same time.
If there are no multiplexers currently configured on the DataSure™ Homepage, and a
new EndNode and tool is powered up in the presence of the wireless network, then a
Primary Multiplexer is automatically generated by the DataSure™ software. The
Primary Multiplexer will be associated with the next available comm. port of the host PC.
As new tools are further added to the network, they will also automatically be added to
the next available channel in the Primary Multiplexer (or more precisely, to the
multiplexer located at the top of the DataSure™ Homepage).
In order to create a new multiplexer, click on the ‘Multiplexer’ link in the site navigation
menu bar. Then from the sidebar click on ‘New Multiplexer’. In the Multiplexer Detail
page, enter a name and description for the new multiplexer. Check all desired tool
connections and assign them port numbers. Note: only tools that have been disconnected
from other multiplexers are available to be added; tools may not be associated with more
than one multiplexer. Next make all desired application associations. All configured
applications are available. Finally, from the sidebar click on ‘Save Changes’.
To edit a multiplexer, select one from the list on Multiplexers page. From the sidebar of
the Multiplexer Detail page, click on ‘Edit Multiplexer’. The name, description, tool
connections, port numbers, and associated applications are all valid options to change.
Note, de-selecting a connected tool makes it available to be added to a different, or new
multiplexer. After all desired changes have been made, from the sidebar click on ‘Save
Changes’.
1.7.4 External Application Setup
SPC software packages and other data collection applications can be directed to interface
with DataSure™ multiplexers as if they were Starrett No.761 multiplexers.
In order to configure a new application, click on the ‘Applications’ link in the site
navigation menu bar. Then from the sidebar click on ‘New Application’. In the
Application Detail page, enter a name and description for the new application. The
executable file path may also be specified. Logging for the application can be

DataSure™ Operators Manual 15 PT 6*****
customized to target specific types of data and/or meta-data. Next, check all desired
multiplexer associations. Finally from the sidebar click on ‘Save Changes’.
If the correct file path for an application has been specified, then it will be possible to
launch the executable from the DataSure™ Homepage. Once loaded, applications must
be directed to the comm port of the multiplexer they are associated with and set for 9600
baud, 8 data bits, 1 stop bit, and no parity. See Appendix A to reference the set of
supported commands that may be sent to a DataSure™ multiplexer from an application.
1.7.5 Basic Network Administration
The Basic Administration page provides a summary detailing DataSure™ software
version information, wireless service status, and database space used. From the sidebar
menu, the operator may Start (or Stop) the Wireless Network service, Refresh the page,
Edit the Basic System Settings, Restore Basic System Setting to their defaults, or manage
the DataSure™ system Database. Under Related Links, access may be gained to the
Advanced Administration page (for more information, refer to section 2.3).
The Log file contains measurement and network performance data. It can be erased by
clicking on ‘Clear Log’ (note: All log entries will be lost if they have not yet been
archived). The Database file contains all configured system settings, devices, nodes,
multiplexers, applications, names, descriptions, associations, etc. The complete
configured system can be backed up and restored via the Database Commands from the
Basic Administration sidebar menu. To save the current configuration, click on ‘Backup
Database’. To view the previously backed up Database files, click on ‘Show Database
Backups’. They will appear in a list box below the Basic System Settings. Text
descriptions can be entered in the fields provided, and saved by clicking on the sidebar
Database Command, ‘Save Backup Descriptions’. A check circle is provided for
selecting which Database Backup should be restored. Mark an intended target, and then
click on ‘Restore Selected Backup’. This action will overwrite the current system
configuration with the settings and objects defined in the restored backup file.
Also describe the Windows security hierarchy for access to Basic and Advanced Administration functions.
You could elude to Advanced here and say “refer to section 2.3”
The Basic System Settings are detailed below. Each system setting has a range of valid
entries and a pre-defined factory-set default. These settings allow the operator to
customize the performance of the wireless network and direct the flow of data through
DataSure™ utility software. It is also possible to impair or impede network operability
through inappropriate changes to some settings. Operators are encouraged to proceed
with caution, and test their networks after changes are made.
•Sampling Interval
0.5sec ≥Valid Entries ≤10.0sec
Default Setting: 1.1sec

DataSure™ Operators Manual 16 PT 6*****
The sampling interval is the periodic rate at which EndNodes are contacted by the
wireless network. Quicker intervals will provide a swifter response for solicited
readings, but will shorten the useable battery life of the EndNode. The sampling
interval has no effect on the response time to send unsolicited readings.
•Enabbled Logging
{Error, Warning, Information, Verbose, Measurement, Message, FirmwareTrace,
BadMessage}
Default Setting: {Error, Warning, Information, Measurement}
Specify the log types to be enabled as a default for all logs.
•Archive Job Time
{hh:mm:ss for a 24hour clock}
Default Setting: 02:00:00 (2 AM)
Specify the time of day that daily log files are automatically archived. The
service must be running during this time, or else the action will not be taken.
•Archive Older Than
7days ≥Valid Entries ≤90days
Default Setting: 7 days
Specify the number of days to allow log entries to age before they are
automatically archived at the time set in ‘Archive Job Time’. The service must be
running during that time, or else the action will not be taken.
•Purge Older Than
-1 ≥Valid Entries ≤365days
Default Setting: 30 days
Specify the time to allow log archives to age before they are automatically
purged. An entry of -1 means the log archives will never be purged.
•Archive Path
{A valid directory path on the local PC}
Default Setting: c:\swi\archives\
Specify the path to the directory where archived files are stored.
•Page Refresh
-1sec ≥Valid Entries ≤60sec

DataSure™ Operators Manual 17 PT 6*****
Default Setting: 2 seconds
Specify the interval at which the Homepage will auto-refresh. Entering -1 causes
the Homepage to never auto-refresh.
•Present Measurement Time
1sec ≥Valid Entries ≤20sec
Default Setting: 12 seconds
Define present measurements as younger than this time. Present measurements
are displayed on the Homepage with dark green background.
•Recent Measurement Time
5sec ≥Valid Entries ≤60sec
Default Setting: 20 seconds
Define recent measurements as younger than this time. Recent measurements are
displayed on the Homepage with light green background.
•Past Measurement Time
10sec ≥Valid Entries ≤120sec
Default Setting: 40 seconds
Define past measurements as younger than this time. Past measurements are
displayed on the Homepage with a pale green background.
•Old Measurement Time
20sec ≥Valid Entries ≤120sec
Default Setting: 60 seconds
Define old measurements as younger than this time. Old measurements are
displayed on the Homepage with a white background.
Section 2 Operation
2.1 Data Collection
The DataSure™ system facilitates several methods of data collection and distribution.

DataSure™ Operators Manual 18 PT 6*****
Once the network has been started measurements can be sent by tool operators from the
attached EndNode, measurements may be solicited from tools by the operator of the
DataSure™ software, or by a 3rd party software application.
Measurements transmitted from the tool are initiated by pressing the data-send button on
the EndNode. Operators should wait for EndNode acknowledgement before sending
successive measurements (refer to Appendix B: LED Blink Tables). These sent values
are called ‘unsolicited’, since they are not requested by the software. The newest
received values can be viewed on the Homepage. All received measurements are
retained in the log file. Unsolicited measurements are also automatically sent out over
the comm. port of multiplexer which their source tool is associated with. In this way
applications may monitor and record in-coming tool data.
Measurements may be solicited from tools on the Homepage by clicking on the
‘Measure’ button next to the target device. The newest received values will be in view
on the Homepage, and all are retained in the log file. However, measurements solicited
from the Homepage (or from the sidebar menu of a Device Detail page) are NOT
conveyed out the multiplexer comm. port to any applications. Only solicited
measurements requested by the application software are transmitted over the
multiplexer’s comm. port (refer the Measure Command in Appendix A: Application
Interfaces).
By these processes, data may be dynamically collected from tools residing anywhere
within the bounds of the wireless network, or beyond if the internal memory of the
EndNode is not exceeded (maximum of 10 stored measurements). Operators have the
option to be located at the site of the tool, with the PC hosting the DataSure™ software,
or at any remote location with a PC networked to the localhost PC. Alternatively, 3rd
party software applications (such as an SPC package) running on the localhost PC have
the potential to solicit data from tools.
Measurements can also be accumulated in the DataSure™ log file, and later exported in a
variety of standard file formats (refer to section 2.1.2 Data Logging). Operators are then
free to graph or tabulate their recorded data using their preferred data management
software packages.
2.1.1 Quick Start (should be at beginning AND on a card inserted in the box)
•Recap in brief the steps to bring up a tool to the homepage,
•take readings from the homepage.
•Describe tool status, battery, and time-since-last measurement indicators.
1) Install and run the DataSure™ software
•Insert the DataSure™ CD in the intended host PC’s CD-ROM drive
•Follow the install procedure
•Launch the DataSure™ software
2) Make sure all hardware elements are powered on, and interconnected

DataSure™ Operators Manual 19 PT 6*****
•Tools and EndNodes should have fresh batteries, and be connected
•Routers, Gateway, and hosting PC are all plugged in and running
•EndNodes, Routers, and Gateway are all within working range of each other
3) Start the Wireless network service
•Click on ‘Start Wireless Network’ from the DataSure™ Homepage
•Watch the tools appear on the Homepage
•In moments the status of the tools will change to ‘Ready'
4) Begin taking measurements
•Press the data-send button on the EndNode
•Or click on the tool’s ‘Measure’ button on the Homepage
•Watch the tool reading and time-stamp appear on the Homepage
5) Export collected data
•Click on ‘Logs’ from the horizontal DataSure™ menu navigation bar
•Click on ‘View Measurements’ from the Log Summary sidebar menu
•Click on ‘Export Log As’ from the Log Detail sidebar menu
•Click on ‘Export Log as .csv’ from the Log Detail sidebar menu
•Open or Save the file to disk
2.1.2 Data Logging
The DataSure™ software is capable of maintaining highly detailed records in regards to
many aspects of traffic over the wireless network, including time-stamped measurements
received from tools. Data logs can be generated and then sent to SPC packages, or
retained as work records. DataSure™ administrators can also use the log file as a
diagnostic view of network performance.
The main Log Summary page provides a tally of log message types and a top-level list of
daily logs for all objects. Clicking on the icon or date hyperlink of a daily log displays
the targeted Log Detail page.
Under the Log Events heading are listed the Date, Time, Object Name, Type, Alert, and
Event. The Date and Time correspond to the exact time an event enters the log. The
Object Name refers to the Device, Node, or Application associated with the event. The
Type is a message classification which can enabled/disabled to be shown in the Logs.
This can be set as default for all log objects via the Basic System Settings on the Basic
Administration page, or for specific objects via their own Detail page. The Alerts
column is used to call notice to events pending acknowledgement and have not yet been
dismissed by the operator (a summary list of these events will also be displayed on the
sidebar under the Alerts header until they have been dismissed). Finally, in the far-right
column, the event description is provided in the log.
From the main Log Summary page, sorted logs for all objects may be viewed by Alerts,
Errors, Warnings, or Measurement. These are the options given under Related Links
from the sidebar menu. Individual alerts pending dismissal may be viewed by clicking

DataSure™ Operators Manual 20 PT 6*****
on them from the sidebar. By clicking on the sidebar Commands link ‘Dismiss
Displayed Alerts’, all alert events shown on the currently displayed Detail page will be
acknowledged. This action removes them from the sidebar list, and also cancels their
pending notice from the Log Events. It does not remove the event from the log. It is also
possible to view all Log Events for a specific object (such as Device, Node, or
Application) by going to its Detail page and clicking on ‘Log Summary’ under the
Related Links in the sidebar menu.
A set of Log Events shown from any Log Detail page can be exported and saved in a
variety of text file formats. To choose a format, click on ‘Export Log As’ from the list of
Commands in the sidebar menu. This will expand the view of the available export
options: .csv (comma separated value), .tsv (tab separated value), .xls (for use with
Microsoft Excel), and .xml (for use with XML-based applications). Choose one of these
and a File Download dialog box will appear. The log file may be ‘Opened’ directly
inside the application assigned to that file type in Windows OS, or ‘Saved’ to any
accessible directory.
Daily Logs may also be archived, cleared, and restored within the DataSure™ software
utility. From the Log Summary page for all objects use the Archive Commands in the
sidebar menu. Click on ‘Show Archived Logs’ to display all the previously archived
logs. Click on ‘Select Archive/Restore’ in order to gain the ability to place a check mark
next to the log file intended for either archival or restoration. Mark a selection, and then
click on ‘Execute Archive/Restore’ to initiate the desired action. The log may also be
cleared by clicking on ‘Clear Log’ from the sidebar menu on the Basic Administration
page. All log entries will be lost if they have not yet been archived. The directory used
to stored archived log files may be specified in the Basic System Settings in the Basic
Administration page.
2.1.3 Applications
•Explain the use of the Application Command Set
•Site a generic example of an external application program (terminal program)
Way too complicated – I say do an App Note on that one. Try Shop Floor II+ or
other SPC app
•Explain the use of the Application Command Set
2.2 Remote Network Monitoring
If the PC running the DataSure™ utility software is attached to a computer network, such
as a LAN, it is also possible to monitor and manipulate network activity from a remote
PC. Using a browser the remote PC can target the PC hosting the DataSure™ software
locally (the localhost PC must also be the one directly attached to the Gateway device).
Table of contents
