Suggested solutions:
Check that the BMV-602 is connected to the PC, and has power.
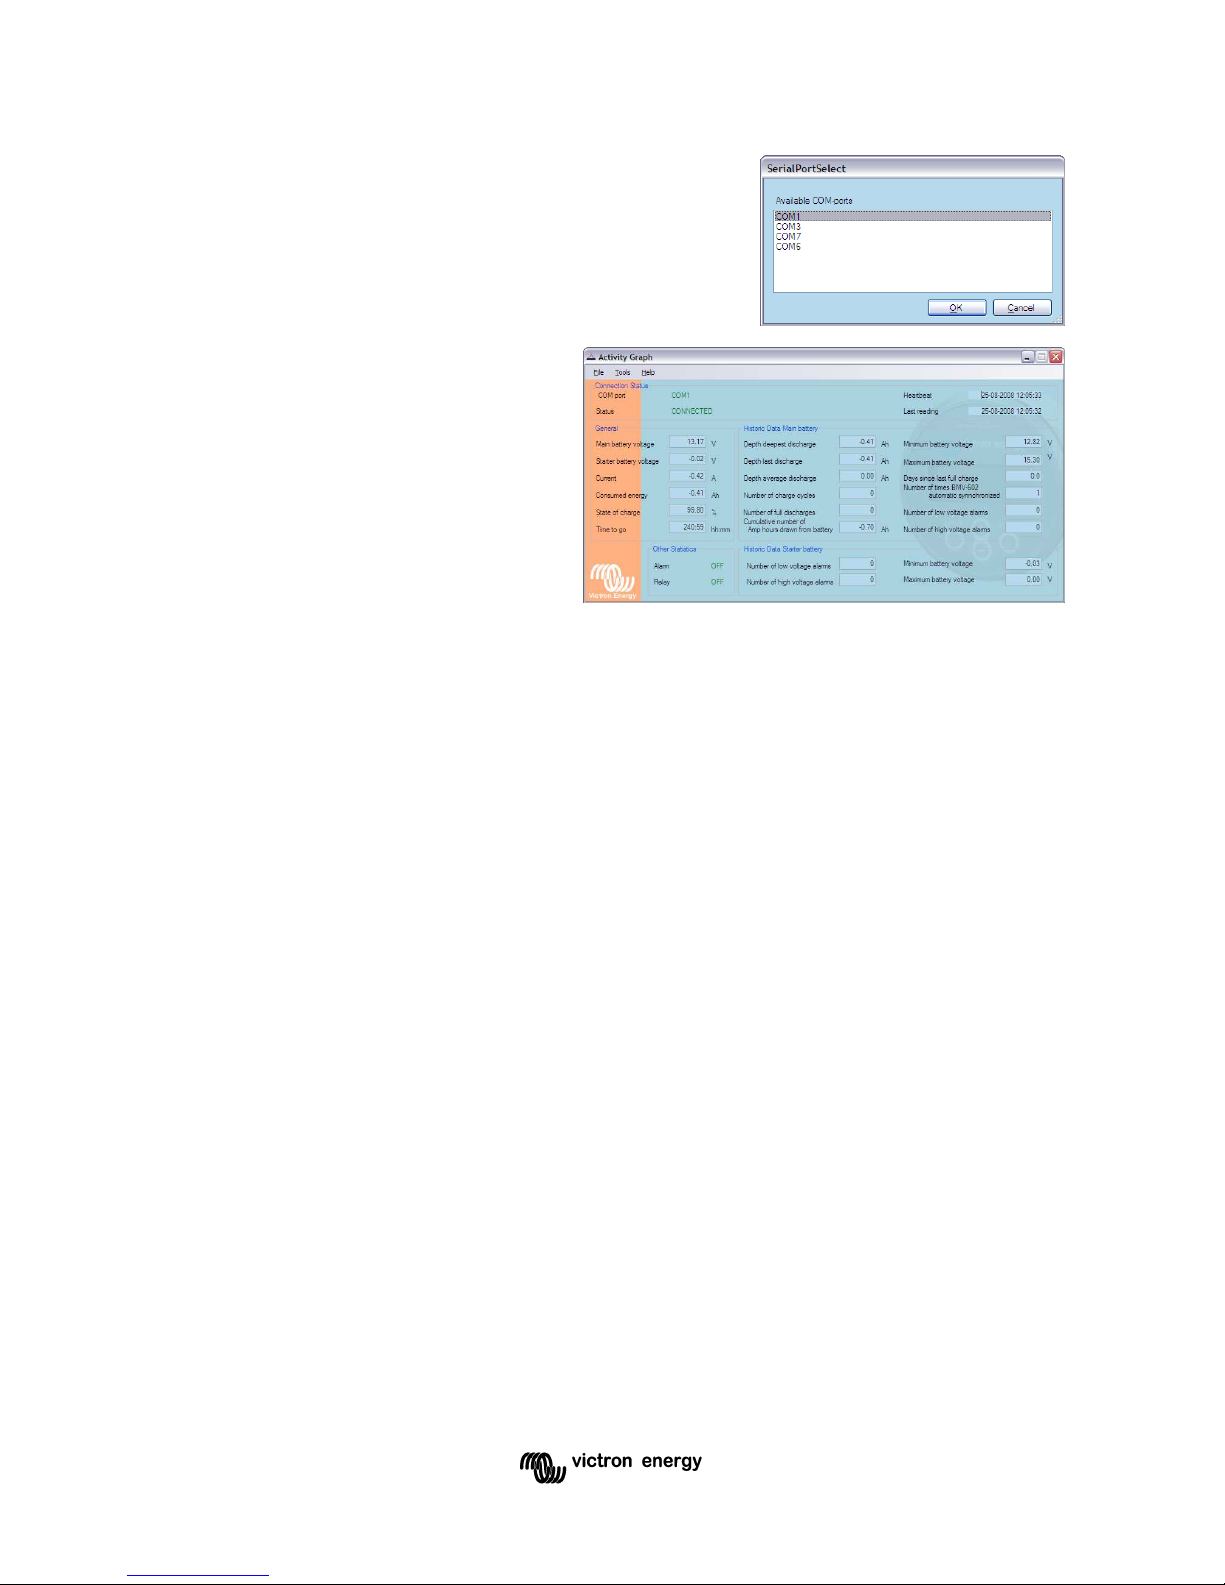
Make sure that the correct COM port has been selected. You can change the
selected COM port by selecting “Change COM port” from the “Tools” menu.
If you are using a USB-to-serial con erter, make sure that the dri ers are correctly
installed; otherwise the correct COM port will not be listed.
Appendix Regional settings
The way that information is displayed on the screen, and sa ed to file depends on the
regional settings of your computer. Usually, this is not important. Howe er if you send a log
file to somebody who uses a computer with different regional settings, it may not display
correctly when they open it.
Appendix 5 Creating a VI graph in Microsoft Excel
Once a log file has been created, there are many things for which it can be used. A
common use for this type of data is to plot a graph of the battery oltage and current o er
time. This tutorial describes how to create such a graph using the Microsoft Excel
spreadsheet software.
The following instructions are for Microsoft Excel 2003, and may need to be adapted for
other ersions of Excel.
1. Create a log file using the procedure
described abo e.
2. Open Microsoft Excel.
3. Click on the “File” menu, then select
“Open...”.
4. In the “Files of type” box, select “Text
Files”.
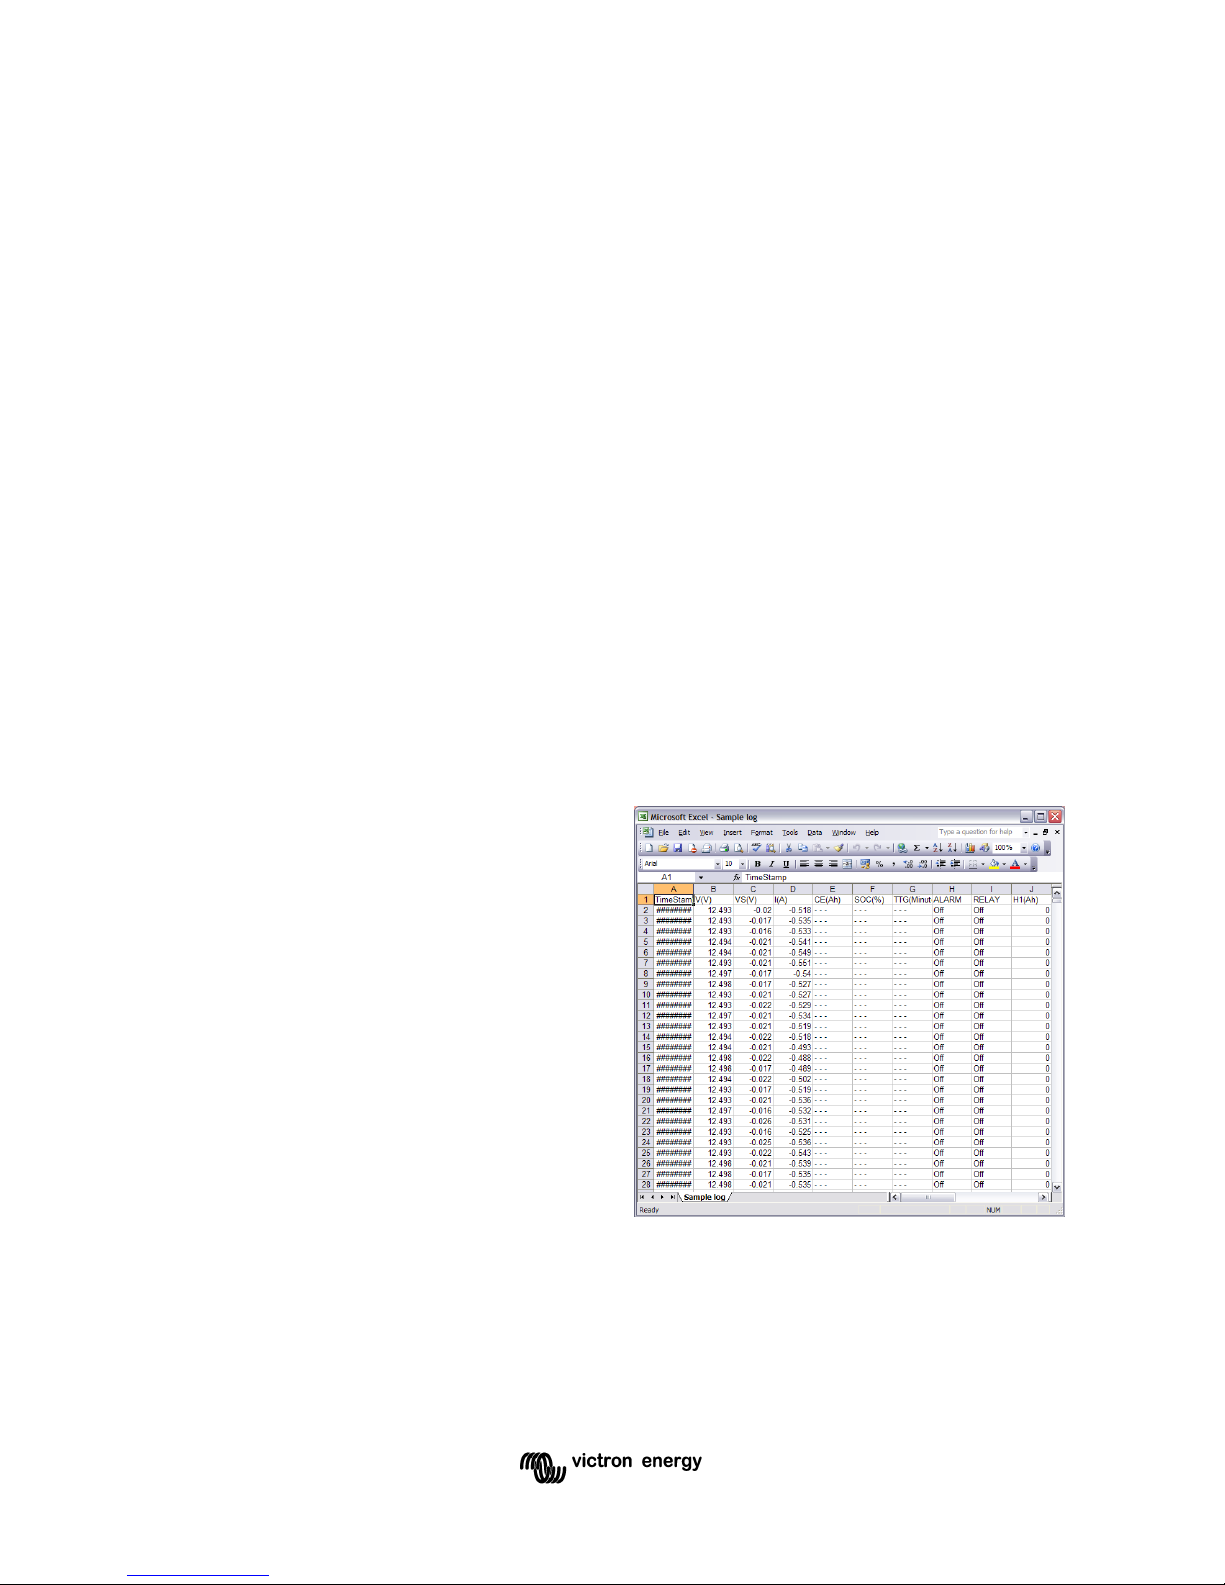
5. Browse to the log file created in step 1.
6. Select the file and click “Open”.
7. Highlight the timestamp column, by
clicking on the column heading.
8. From the “Format” menu, select
“Cells...”.
9. In the “Category” list, select “Time”, and then click “OK”.
10. Whilst holding the control key, click on the column headings for the main battery
oltage (column B), and main battery current (column D).
11. From the “Insert” menu, select “Chart...”.
12. On the “Custom Types” tab, select “Smooth Lines” from “Chart type” list.