WÄRTSILÄ SCENESCAN User manual

Wärtsilä Guidance Marine Ltd,
5 Tiber Way, Meridian Business Park, Leicester, LE19 1QP, UK
www.wartsila.com/guidance-marine
USER’S GUIDE
SCENESCAN

294-0561-D
Serial No:
Sensor Software Version: Client Software Version:
Date of Shipment from UK:
Copyright © Wärtsilä Guidance Marine Limited. All Rights Reserved.
Copyright in the whole and every part of this document belongs to Wärtsilä Guidance Marine Limited (the “Owner”) and may not be used, sold, transferred, copied or reproduced in whole or in part in any manner or
form or in or on any media to any person other than in accordance with the terms of the Owner’s Agreement or otherwise without the prior written consent of the Owner. “SceneScan” is a registered trademark of
Wärtsilä Guidance Marine Ltd. All other brand and product names are trademarks of their respective companies or organisations.
Wärtsilä Guidance Marine Ltd,
5 Tiber Way,
Meridian Business Park,
Leicester,
LE19 1QP
United Kingdom
T: +44 116 229 2600
UK Support: +44 116 229 2665
(365 days a year; 08:00 - 20:00 UTC)
USA Support: +1 504 305-1120
Asia Support: +65 6734 6365
SceneScan User’s Guide
Issue Date: 09/09/2020
Document No: 94-0561-D
LASER
1M
Print Colour
Black
Print Colour
Yellow
SPECIFICATION
Reference:
Material:
Size:
Colour:
260845
Self adhesive vinyl,
clear laminate
Print colour:
Text:
Yellow and black
“Caution Laser 1M”
DATE:
PROOF:
18/09/17
1
100.00 mm
50.00mm
Scale 1:1
Material
White
White
50mm x 100mm
Class 1M Laser Product
Complies with EN 60825-1
Complies with USA CFR 1040.10
& 1040.11 except for deviations
pursuant to Laser Notice No 50
26 Jul 2001 2812
TAA00002JX-
SceneScan

Document History
394-0561-D
Document Number Changes Issue Date
94-0561-A First release of SceneScan User’s Guide 11/05/2018
94-0561-B Section added - How to report issues 17/12/2018
94-0561-C DNV-GL Certication logo added 08/04/2020
94-0561-D Wärtsilä DP Feed added and branding changed to Wärtsilä 09/09/2020

Table of Contents
494-0561-D
5 Introduction
6 Welcome
7 System Overview
8 SceneScan Sensor Part Names
9 Getting Started
10 Start Up and Shut Down
11 Targetless Tracking
13 Screen Layout
19 Tracking Information Quality
20 Display Settings
22 Vessel Orientation
23 Tracking Basics
24 Operating Blanking Zones
25 Scanner Tilt Controls
26 Tracking
29 Tracking in Monopole Mode
30 Positional Display Modes
32 Multi-Dashboard SceneScan Systems
33 SceneScan Dashboard - Monitoring Mode
34 SceneScan Dashboard - In Command Mode
35 Support Information
36 Low Temperature Operation
37 Working with Alarms
38 Dynamic Positioning Feed
39 Network Communication Settings
40 Data Logging
42 Serial Numbers & Software Versions
43 Troubleshooting
44 Problems and Possible Remedies
45 SceneScan Fuse Information
46 Installing the SceneScan Hardware
47 Where to Mount the Sensor
48 Sensor Dimensions and Mounting Template
49 Installing the Cables
50 Cable Specications
51 UPS Specications
52 SceneScan Sensor Connections
53 SceneScan Client and DP Feed Connections
54 Cable Routing Diagrams
56 Installing the Control PC
57 Installing SceneScan Client Software onto a Computer
58 Upgrading the Sensor Software
59 Configuring the SceneScan System
60 Using the Service Interface
61 Network Communication Settings
63 Vessel Parameters
66 Static Blanking Zones
67 Dynamic Positioning Feed Conguration
68 DP Feed Behaviour
70 System Parameters
72 DP Message Types
79 Service Schedule
80 SceneScan Installation Checklist

594-0561-D
1. Introduction
1.1
1.2
1.3
6
7
8
Welcome
System Overview
SceneScan Sensor Part Names

694-0561-D
Welcome to the SceneScan User Guide. It explains how to:
• Use the SceneScan system
• Physically install the system
• Install and operate the Dashboard software
• Install the Service Interface
1.1 Introduction 1Welcome
Note: Installation of a SceneScan system should be carried out by a suitably qualified and
competent engineer.

794-0561-D
The SceneScan System is a high accuracy rotating laser Sensor that provides
positional information to allow automated approach and/or station keeping relative
to a structure or vessel. It is designed to be semi-portable and straightforward to
operate.
Its key elements are:
• The SceneScan Sensor: The marine grade SceneScan Sensor is mounted on the
vessel (typically on the wheelhouse) as required. The SceneScan Sensor emits
eye-safe infrared light and detects the reections received back from one or more
designated structures or vessels.
• The SceneScan Client Software: There are two key pieces of software:
•The SceneScan Service Interface: The SceneScan Service Interface is used for system
installation and maintenance.
•The SceneScan Dashboard: The SceneScan Dashboard generates a visual representation of the
scene detected by the SceneScan Sensor. It gives the DP Operator control of the system and the
data stream being fed to the DP system.
Both pieces of software run under Windows™ on a Type 4 Marine Processor or other
computer providing the minimum system requirements (see page 57).
The SceneScan system operates differently to other local position reference systems
in that it does not require any type of target to be placed on the asset that is being
approached or used for station keeping.
It scans the vessel or structure and produces a map. This map is compared to the
current scan by the SceneScan Sensor navigation algorithm, which is used to track a
local position.
1.2 Introduction 1System Overview

894-0561-D
The diagram below shows the key parts of the Sensor unit and the various names that
are used throughout this guide:
1.3 Introduction 1SceneScan Sensor Part Names
Optical Window
Access Plate
Sensor Information
Display
Cable Gland Plate
Base Plate
Rotor
Power
DP Feed 2
DP Feed 1
Client Data

994-0561-D
2. Getting Started
2.1
2.2
2.3
2.4
2.5
10
11
13
19
20
Start Up and Shut Down
Targetless Tracking
Screen Layout
Tracking Information Quality
Display Settings
2.6 22
Vessel Orientation

1094-0561-D
Start Up
2.1 Getting Started 2Start Up and Shut Down
To Start SceneScan Dashboard
1. Ensure that the SceneScan Sensor is powered on.
2. Double-click on the SceneScan Dashboard icon.
(Or run the SceneScan Dashboard from
Start > All Programs > Guidance Marine Ltd > SceneScan > SceneScan
Dashboard).
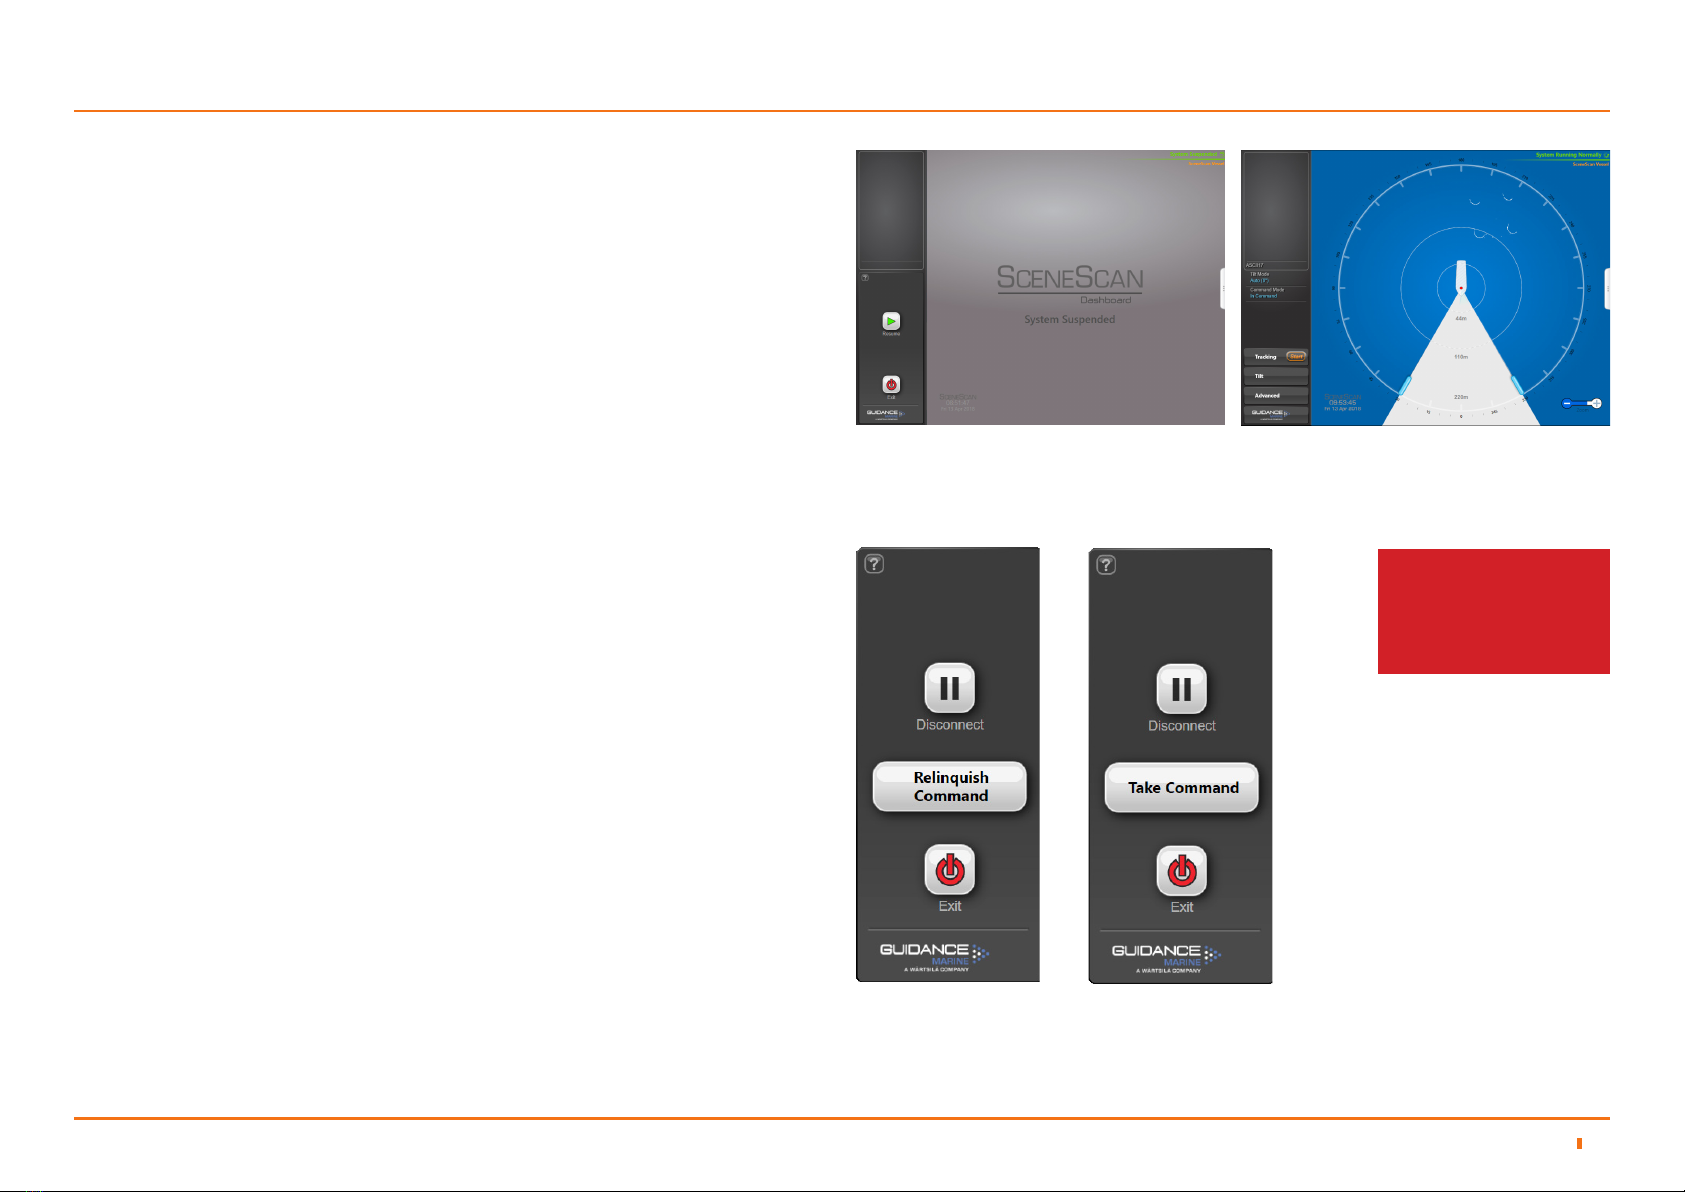
3. The Dashboard display screen will appear.
If the Sensor is currently suspended, the main part of the screen will be greyed
out. Click on the Resume button in the side bar in order for the Sensor to begin
scanning and for the results to be displayed on the screen. If the Sensor was
already scanning, then the current scene will be displayed.
Shut Down
To Suspend, Exit or Disconnect
1. Click on the Guidance button in the lower left corner of the screen.
2. This will reveal buttons in the side bar as follows: (see right).
3. Suspend - Places the Sensor into a ‘sleep mode’. The rotor ceases spinning and
the scanner tilt returns to a xed state. The unit can be returned to full operation
via a Resume command from the Dashboard. This mode is suitable for use
when travelling between locations.
4. Disconnect - Ceases communications between the Dashboard and Sensor and
causes the main part of the screen to be greyed out. Does not cause the Sensor
to stop spinning or tracking the scene.
5. Suspend And Exit - Places the Sensor into the same ‘sleep mode’ as the
suspend command (discussed above) and also closes the SceneScan
Dashboard program.
6. Exit - Closes down the Dashboard without affecting the Sensor.
Dashboard Screen with Sensor Suspended Dashboard Screen with Sensor Scanning
Dashboard
In Command
Dashboard
Monitoring
See Multi-Dashboard
SceneScan Systems (page
32) for information on In
Command/Monitoring
functionality.

1194-0561-D
Overview of Targetless Tracking
Traditional relative positioning Sensors rely on placing targets on the structure or vessel which the
Sensor then detects and can report a position relative to. SceneScan removes the requirement to
place targets into the scene and instead provides tracking information relative to natural or man-
made structures within the Sensor eld of view. It achieves this by matching its current observation
of the scene against previous observations of the same scene, in order to determine the motion of
the Sensor between observations.
In order to maximise the performance of this approach, the Sensor rst calculates the most reliable
and informative section of the scene to track off. This step is called tilt optimisation, and involves the
Sensor scanning through various sections of the scene to work out which tilt angle to track at.
Once a suitable section has been selected the system starts tracking and reporting the position
of the Sensor within the scene. As the Sensor moves and the view of the scene changes, the
Sensor will automatically update its model of the scene while tracking without any need for user
intervention.
Single monopoles, such as wind turbines, are challenging as it is possible to navigate around
a monopole at a set distance and notice no difference in the map. When navigating at single
monopoles a different algorithm should be selected which nds and navigates from the centre of the
monopole.
2.2 Getting Started 2Targetless Tracking
Blanking Zones
Warning: Before starting tracking it is critical that Blanking Zones have been correctly configured to mask out regions of the scene that we do not wish to track.
Two types of blanking zone can be congured on a SceneScan system:
• Fixed Blanking Zones – These can be exclusively congured using the SceneScan Service Interface. Fixed blanking zones are the Vessel Blanking Zone (Vessel
Parameters) and the Static Blanking Zones.
• Operating Blanking Zones – These can be amended in the Dashboard when the system is running, even during tracking. Operating blanking zones are the Dynamic
Blanking Zone and the Minimum Range Filter.
For information on how to set Blanking Zones see the following sections:
• Operating Blanking Zones on page 24
• Vessel Parameters on page 63
• Static Blanking Zones on page 66

1294-0561-D
Enabling DP Output
Once tracking, the Dashboard will display tracking and scene data, but the Sensor
will not output a DP feed. The reason for this is to allow the operator to review the
detected scene, and to set a Scene Reference Point of their choice before enabling
DP Feed output.
When the operator is happy with the tracking data displayed on the Dashboard
the DP output can be enabled and the Sensor will start to report valid position
telegrams to the DP system.
2.2 Getting Started 2Targetless Tracking (continued)
Start Tracking
Once Blanking Zones have been congured the operator can command the Sensor
to start tracking.
SceneScan Tracking is inuenced by the operator’s choice of tilt mode (see the
Scanner Tilt Controls section on page 25 for further information):
Auto - When starting tracking, the scanner will automatically “sweep” through a
range of angles to determine the most stable scene for tracking purposes.
Manual - This mode is used to manually tilt the optics to point at the desired part of
the scene. When starting tracking, the scanner will use the currently selected angle
and no “sweep” will be performed.
Once a suitable tilt angle has been chosen tracking will start and the scanner tilt
angle will automatically adjust as the range to the asset changes. This is to ensure
that the same part of the scene is used throughout the tracking session.
Scene Reference Point
Once the Sensor has started tracking, it will start reporting its position relative to the
Scene Reference Point.
By default SceneScan will select the centre of the tracked scene for the scene
reference point, with a heading of 0°.
This behaviour should be sufcient for most users. However users are also able to
edit the Scene Reference Point, altering both its position and heading. This might be
done to align to the heading of a tracked vessel, or to position oneself against the
edge of a platform or quayside.
Tracking Overview
Warning: Changing the Scene Reference Point will disable the DP Feed. This is done because
altering the point can dramatically alter the output from the DP Feeds. The DP Feeds must be
re-enabled by following the below procedure.
Tracking in Monopole Mode
In the standard SceneScan operating mode when tracking is commenced there is a
scan angle optimisation step that the system runs through. This does not happen in
monopole mode.
With the monopole system the user must select an angle which will be clear of
the operation that will be taking place whilst on DP. This is because in a typical
operation there is often a structure brought into close proximity to the monopole or
turbine, such as a walk to work gangway.
We recommend that the user uses the blanking zones to constrain the scan area to
that containing the monopole.

1394-0561-D
The SceneScan Dashboard screen is split
into three distinct sections, these are:
1. Main Screen and Bird's Eye View
(BEV) (see page 14)
2. Side Bar (see page 16)
3. Menu Pane (see page 18)
2.3 Getting Started 2Screen Layout

1494-0561-D
Main Screen and Bird's Eye View (BEV)
The circular BEV shows the observable scene and Scene Reference
Point relative to the Sensor and vessel.
The Figure on the right labels elements on the BEV and its periphery.
Vessel Outline
The Vessel Outline in the centre of the BEV represents the ship on
which the SceneScan system is located, and the red dot denotes the
SceneScan Sensor. The rotating fan-shaped symbol represents the
laser beam emitted by the rotor as it turns.
The whole BEV can be rotated in steps of 90° to allow for different
positions of the monitor. The size and shape of the vessel outline and
the position of the Sensor’s red dot within it can be congured using
the SceneScan Service Interface.
Blanking Zone
The Blanking Zone is an area dened by the user in order to blank-
out parts of the scene that should not be used for tracking. During
each revolution of the Sensor, when the rotor enters this sector the
laser stops pulsing. The Blanking Zone is adjusted to suit the current
operating conditions.
Range Circles
The Range Circles are a visual guide that help to show the distances
between the Sensor vessel and the detected reections. Distances are
given in metres from the centre of the Sensor.
Radial Markers
Around the circumference of the BEV are marked angles in degrees,
clockwise from the bow of the vessel.
2.3 Getting Started 2Screen Layout (continued)

1594-0561-D
2.3 Getting Started 2Screen Layout (continued)
Scene Data
The Scene Data shows the scene detected by the SceneScan Sensor.
Note: The Scene Data can be constrained to a traditional circular BEV,
or expanded to ll the central area using the Toggle BEV Shape button
on the Hotkeys Tab, or by pressing F8.
Scene Reference Point
The Scene Reference Point shows the point within the scene about
which SceneScan is tracking.
Bearing and Heading Tags
The bearing tag and the heading tag are displayed when tracking is in
progress, to indicate the target’s bearing and the vessel heading on the
Radial Marker.
Data Logging Indicator
This symbol is displayed when data is being logged to disk.
Zoom Control
Allows a user to zoom in (+) and zoom out (-) of the BEV. Click on the
left-hand side of the control (marked '-') to zoom out of the display and
on the right-hand side ('+') to zoom in.
System Status
This consists of two elds:
Primary
The primary status display is positioned in the upper-right corner of the main pane. It
indicates the current status of the system, for example System Running Normally or
System Suspended.
Secondary
The secondary status display is positioned in the lower-right corner of the main pane. It
displays a ashing message for a number of seconds in order to conrm an action taken
by the user. It can also display a persistent, static message if there is a communications
problem.
Hotkeys Tab
The Hotkeys Tab is located on the right hand edge of the main pane.
Clicking on the tab will open the Hotkeys Menu.

1694-0561-D
2.3 Getting Started 2Screen Layout (continued)
Side Bar
The Side Bar, the black pane on the left of the BEV, contains control
and display components in addition to the coordinates panel.
Toggle Coordinate Type
Signal Quality
Coordinate Data
DP Message Format
Current Tilt Mode and
Command Mode
Start/Stop Tracking Button
(It is always visible for SceneScan)
Guidance Button
After pressing the Guidance Button

1794-0561-D
2.3 Getting Started 2Screen Layout (continued)
Hotkey Buttons
Selecting the Hotkeys tab on the right-hand side of the main screen
activates the Dashboard Hotkeys menu.
The following keys - and the corresponding buttons on the Dashboard Hotkeys menu -
act as shortcuts to application functions.
F1 Display Help Menu
F2 Toggle between the About System pane and the BEV display
F3 Rotates the Vessel Clockwise
F4 Rotates the Vessel Anti-Clockwise
F8 Toggle between displaying a traditional circular BEV or Full Scene mode
F9 Toggle between the day view and night view
F10 Capture a screenshot of the Dashboard interface and save it to disk
F11 Toggle between normal window layout and full screen layout
F12 Toggle between enabling and disabling the on-screen keyboard
Alt+L Start Manual Data Logging (available when no tracking operation is in
progress): Starts data logging and changes the button to Stop Data Logging
Ctrl + Zoom-In
Ctrl - Zoom-Out
Esc When in operation conrmation mode, cancel the current operation request
Enter When in operation conrmation mode, conrm the current operation request
Hotkeys Tab

1894-0561-D
2.3 Getting Started 2Screen Layout (continued)
Menu Pane
The Menu Pane, located across the bottom of the SceneScan Dashboard Screen,
is not always visible. It appears when one of the Tracking, Tilt or Advanced buttons
near the foot of the Side Bar are pressed, which causes the Bird's Eye View (BEV) to
contract towards the top of the screen. Clicking the same button for a second time
causes the Menu Pane to disappear and the BEV to be restored to full size.

1994-0561-D
Once tracking is under way the Data Quality Bar indicates the level of condence the system has in the quality of the scene data that is being acquired. The greater the size
of the lled portion of the Data Quality Bar, the greater the level of condence in the information.
2.4 Getting Started 2Tracking Information Quality
The colour of the Data Quality Bar and positional data also reects the level of condence: RED, YELLOW or GREEN, with GREEN meaning highest condence.
When tracking, the Data Quality Bar and positional data disappear and are replaced with a warning message if the system loses track of the scene.

2094-0561-D
To provide ample visibility during daytime operation and to limit glare during
night shifts, SceneScan Dashboard offers two display settings: Day Mode and
Night Mode. In either mode the brightness can be further adjusted by the Screen
Brightness control.
To change day/night mode and adjust brightness:
1. Navigate to Advanced > Display Options > Display Settings.
2. Click on one of the Day / Night Mode symbols.
3. Click on the left side of the Screen Brightness control to dim the screen and on
the right to make it brighter.
Alternatively, to toggle between day and night mode, use the keyboard shortcut F9
or the Toggle Day/Night Mode button in the Dashboard Hotkeys panel.
2.5 Getting Started 2Display Settings
Day Mode
Night Mode
Table of contents
Other WÄRTSILÄ Accessories manuals