Waterscout SMEC 300 Soil User manual

SMEC 300 Soil
Moisture Sensor
PRODUCT MANUAL
Item # 6470-6, 6470-20

2
CONTENTS
General Overview 3
Sensor Placement 4
Hardware/Software Compatibility 6
Calibrating the EC Sensor 8
Checking the Sensor 9
Installation 10
Soil Moisture Calibrations 13
Electrical Conductivity 19
Volumetric Water Content 20
Specifications 22
This manual will familiarize you with the features and operation
of your new WaterScout SMEC 300 Soil Moisture Sensor.
Please read this manual thoroughly before using your
instrument. For customer support, or to place an order, call
Spectrum Technologies, Inc. at (800)248-8873 or (815) 436-
4440 between 7:30 am and
5:30 p.m. CST, FAX at (815)436-4460, or E-Mail at
www.specmeters.com
Spectrum Technologies, Inc.
3600 Thayer Court
Aurora, IL 60504

3
Thank you for purchasing a WaterScout SMEC 300 Soil Mois-
ture Sensor. The moisture and nutrient status of your soil or
container substrate are key pieces of information. They allow
you to tailor your irrigation and fertilization program to suit
your crop's needs. They also help identify if it is necessary to
leach salts from the profile. The SMEC 300 combines afforda-
bility and accuracy into a sensor that is easy to install.
The soil moisture sensor consists of two electrodes that func-
tion as a capacitor, with the surrounding soil serving as the die-
lectric. An 80 MHz oscillator drives the capacitor and a signal
proportional to the soil’s dielectric permittivity is converted to
the output signal. The dielectric permittivity of water is much
greater than air, soil minerals and organic matter. So, changes
in water content can be detected by the sensor circuitry and cor-
related to the soil’s moisture content.
The salinity of the soil solution, irrigation water or fertilizer
solution is an important parameter affecting the root zone envi-
ronment. Any of these factors can have a significant effect on
plant growth and physiology. The easiest way to monitor salin-
ity is by measuring the electrical conductivity (EC). EC is
strongly correlated to the salinity of the soil solution. EC meas-
urement is also affected by temperature and, to a lesser degree,
by soil moisture content. The SMEC 300 measures EC with a
pair of carbon ink electrodes which provide a large contact sur-
face with the soil solution. Temperature is measured with a
thermistor potted in the sensor molding.
The SMEC 300 is designed to be compatible with the Watch-
Dog® data loggers and weather stations as well as the Field
Scout® soil sensor reader. SpecWareTM software enables you to
view your data in graphical and tabular form as well as run re-
ports customized to your application.
General Overview

4
Sensor Placement
The sensors should be located in the effective root zone
and at locations that will give a representative picture of
the salinity and soil water status of the area being meas-
ured. For outdoor appli-
cations, consider areas
of the field planted to
different types of vege-
tation. This could be
fairways vs. greens or
landscaped areas planted
with trees as well as
those planted with flow-
ers. Areas with signifi-
cant differences in fac-
tors such as topography
or soil type should be
considered unique envi-
ronments. For green-
house applications, select one or more representative con-
tainers. Selecting a site which receives the least amount
of water from the irrigation system will tell you when that
area becomes critically dry and is in need of attention.
Sites that have the greatest fluctuation in soil moisture will
exhibit the greatest level of EC variability as well. A sin-
gle sensor should be placed in the middle of the root zone.
Unless they are installed in separate containers, SMEC
300 sensors connected to the same Spectrum logging de-
vice must be separated by 10 ft (3m) or more (see p. 7).
Therefore, it is not recommended that two or more sensors
are installed one above another at a single site unless they
can be connected to separate devices. If EC values are on-
ly required at a single depth (such as near the surface), soil
moisture data at additional depths can be measured with
SM 100 soil moisture sensors (item 6460 or 6460-20).

5
The SMEC 300 is most sensitive to the soil adjacent to the
sensor. Therefore, good contact between the soil and sen-
sor is important. Stones and air pockets next to the sensor
will affect the accuracy of the readings. Because it is sen-
sitive to differences in dielectric permittivity, care should
be taken not to install the sensor in or near metal.

6
Hardware /Software
Compatibility
There are some restrictions on which equipment is compatible
with the SMEC 300 and how many sensors can be connected to a
single unit. These are outlined below.
Soil moisture sensor reader
• Requires firmware version 4.4 or greater.
Specware software
Weather stations require Specware version 9.04 or greater.
WatchDog weather stations
The table below outlines the compatibility of the sensor with the
various WatchDog weather products.
WatchDog Pups and Pup Stations
No restrictions.
Station #
Station
Type
Station
FW version
Number
of
Sensors
Compatible
Channels
Potentially
unavailable
channels
1225, 1250 Micro N/A 0Incompatible
1400, 1525,
1650
Micro 2.0 2A, D
1200, 1425,
1450
Micro 2.0 1D
2475 Mini 3.8 1A
2450 Mini 3.8 2A, B
2425 Mini 3.8*3A, B, C *
2400 Mini 3.8*4A, B, C, D *
2550, 2700 Full 6.9 2A, D B/C, E/F
2800 Full 3.2 2A, D B/C, E/F
2900ET Full 6.9 1AB/C
* Can accommodate 1 SMEC 300 with FW v. 3.5 using port A plus B/C as
virtual ports

7
Upgrading older weather stations
Older WatchDog mini-stations can be upgraded with a
new micro-controller chip (3300WD2). Full weather sta-
tions can be upgraded with a replacement micro-controller
with integrated clock board (item 3300CBWM). Micro
stations can be upgraded through SpecWare software.
Contact Spectrum Technologies for details.
Use of Multiple SMEC 300 Sensors
All Spectrum loggers (1000 Series Micro Stations, 2000
Series Mini Stations, 2000 Series Full Stations, Pups, and
Pup Stations) use a common ground for sensor readings.
The SMEC 300 sensor measures EC by passing a small
current across the sensor from one conductive pad to an-
other. When other SMEC 300 sensors are in close prox-
imity to each other and within the same body of soil, a
small amount of current can leak to the grounded pad on
another sensor, resulting in a slightly lower EC reading.
To minimize or eliminate the impact of SMEC 300 sen-
sors interfering with each other -
1. Connect each sensor to a separate Spectrum logger
products. Sensors connected to different loggers will
not interfere with each other
2. Place multiple SMEC 300 sensors at least 10 feet (~3
meters) apart. Even with the sensors spaced accord-
ingly, EC values of up to 0.1 mS/cm lower have been
observed.
Original WatchDog weather stations (models 525, 550,
600, 700, and 900), 200- and 400- series purple loggers,
and A-series loggers are incompatible with the SMEC
300.

8
The EC sensor can be calibrated with the Soil Sensor
Reader or with the EC Calibration Device (item
6470CAL3V). The calibration procedures are included in
the product manuals for each device. With both devices,
calibration is done with a 1.41 mS/cm calibration stand-
ard. Some important points to remember when calibrating
the EC sensor:
1. Be careful not to touch the carbon ink electrodes. Oils
from your fingers can affect the accuracy of the sensor.
Before calibrating, the electrodes
should be cleaned well with alcohol.
2. Immerse the sensor up to the immer-
sion indicator on the sensor molding
(indicated by arrow in image to right).
3. Wait until the sensor has come to
thermal equilibrium before initiating
the calibration routine.
Calibrating the
EC Sensor

9
The EC sensor can be checked with the 1.41 mS/cm cali-
bration standard (see Calibrating the EC Sensor p. 8).
The soil moisture calibrations were developed using min-
eral soils and a soilless material (peat moss). Therefore the
sensor will not give a value of 100% in water. To check if
the soil moisture sensor is still functioning properly, read-
ings can be taken in the following media:
Air
In air, the sensor should read a VWC of 0%.
Water
In distilled water, the sensor should read a VWC of about
55% in Standard mode and about 68% in Soilless mode.
Saturated Playground Sand
Add water to playground sand until the surface glistens
and no additional water can permeate the sand. The sen-
sor should read a VWC of about 29% in Standard mode
and about 60% in Soilless mode.
Note: WatchDog weather stations display the Standard
VWC value. The soilless mode is available on the
handheld reader only.
Checking the Sensor

10
The most important consideration for installing the sen-
sors is maintaining good contact between the sensor and
the soil. This ensures optimum performance. Before any
installation, be sure that the EC electrode has been cleaned
with alcohol and is recently calibrated (see Calibrating the
EC Sensor p. 8)
Important: The sensor can be damaged if it is pushed
directly into hard, native soil. Please read installation
guidelines before installing the sensors.
Surface Installation
If the sensor is being installed near the surface such that
the molding and cable will remain above the soil surface
the sensor can sometimes be pushed directly into the soil.
Because the sensor board is flexible, care should be taken
to avoid snapping it during installation. Do not strike the
sensor with a hammer or other blunt instrument as this
could damage the sensor electronics. If the soil is very
hard, a small slit can be dug into the soil with a knife or
shovel to facilitate easier insertion. Subsequently, pushing
that same implement into the ground surrounding the sen-
sor will improve the contact between soil and sensor.
Deep Installation
Vertical Orientation
To install the sensor in a vertical orientation, dig an access
hole to the desired depth. This can be done with an auger
or shovel. If a large hole has been dug with a shovel, the
sensor can be installed similar to the surface installation
and back-filled.
If using an auger, it is recommended that the hole be at a
slight angle. This will reduce the effect of water channel-
ing down to the sensor via the sensor cable. A length of
½” Schedule 40 PVC works well as an insertion device
because the sensor molding has a width of 7/8”. In gen-
eral, it is not recommended to push the sensor directly into
Installation

11
native soil, especially in dry, high-clay or gravel/stone-
laden soil. Instead, it is best to return some crumbled na-
tive soil from the bottom of the access hole, tamp it suffi-
ciently and use the insertion device to push the SMEC 300
into the packed soil. It is advisable to mark the tamping
and insertion tools such that it is possible to determine that
the sensor will be completely surrounded by tamped soil
and that the sensor is being installed to the desired depth.
The access hole should then be carefully backfilled with
native soil and tamped down to eliminate air pockets.
Horizontal Orientation
Digging a small hole or trench in the soil allows the sen-
sors to be installed horizontally. The sensors are pushed
directly into the exposed face of undisturbed soil. Be-
Sensor Depth
Sensor Length
Marks on
insertion
tool
SMEC300

12
cause the sensor board is flexi-
ble, care should be taken to
avoid snapping it during instal-
lation. To limit the effect of
water moving vertically
through the soil profile, the
sensors should be installed so
the flat face is perpendicular to
the soil surface. For the same
reason, if sensors are installed at multiple depths, they
should be offset from one another.
Removal
Care should be taken when removing a sensor that is firm-
ly embedded in soil. Pull on the molding only. Pulling on
the cable risks damaging the wiring.
Suggestions for protecting sensor cables from rodents
- For vertical installations, run sensor cables through PVC
pipe. This can be the same tube used as an installation
tool.
- For sensor cable that will be running parallel to the
ground, either above or below the soil surface, the sensor
cable can be fed through flexible conduit or drip irrigation
tubing. When using drip irrigation tubing, it is preferable
to use used tubing. This is because the tubing will have
the curl taken out of it and will be easier to keep straight.
A slit should be cut into the tubing with a box cutter and
the cable pushed inside. If the cable and protective cover
are not buried, they can be secured to the ground wire
with hooks or turf staples.

13
In some instances, greater accuracy is desired than can be
obtained from a general soil moisture calibration equation.
In this case, it is necessary to perform a calibration on
your unique soil. Essentially, a relation needs to be devel-
oped that relates the meter’s electronic reading to the actu-
al volumetric water content (VWC). This will require that
some other method be used to measure the VWC.
Mineral Soils
VWC data can be measured in a lab setting by measuring
the weight of a perforated soil column of known volume
that is saturated, drained and dried. This method is pre-
ferred because the soil structure is not altered during the
testing procedure. This procedure requires a weighing
scale, a soil container with a height slightly greater than
the SMEC 300 sensor (2.8 inches) and, depending on the
ambient drying conditions, can take several weeks to com-
plete. The procedure is briefly outlined below. Readings
of the soil moisture circuit can be taken either with the
Soil Sensor Reader or a WatchDog weather station. In
either case, the device should be set to Raw AD mode.
For the weather stations, when channel A is configured to
read Raw Sensor (raw), it will read the soil moisture cir-
cuit only. Nothing will be read on channels B or C.
1. Build a small container to hold the soil from a non-
metallic material such as PVC. The sensitive volume of
the sensor is not large so the container diameter does not
have to be very big. In fact, soil-moisture gradients will
form in the container as it dries so, unless several sensors
will be used in the calibration, a small container will pro-
vide the best results. Cap the bottom of the container and
drill holes in the cap and in the container’s sides. This will
allow water to permeate and drain as well as facilitate dry-
ing without allowing soil to spill or leak out. Drilling the
holes at a slight downward angle will minimize spillage.
soil moisture
Calibrations

14
2. Measure the mass of the empty container and the sensor
or sensors being used in the calibration.
3. Determine the volume of the container. This can be
done geometrically or by measuring the volume of sand
needed to completely fill the container.
4. Fill the container with air-dry, sieved soil.
5. Take a reading of the sensor in air, install the sensor in
the dry soil, and take the air-dry reading.
6. Place the container (with sensor installed) in a larger
receptacle and add distilled water around the OUTSIDE of
the container until the water level reaches the top of the
container. Allow the container to completely saturate.
Take a sensor reading.
7. Transfer the container to the scale and measure the
mass. It is advisable to have a tray to hold the container to
keep water from spilling on the bench. Be sure to zero out
the tare weight of the tray.
At this point, the procedure is to simply allow the contain-
er to dry while periodically taking simultaneous weight
and sensor readings. Initially, the container will dry rap-
idly and 2 or 3 readings per day may be appropriate. As
the container gets dryer, it will dry more slowly and the
frequency of measurements will decrease. When the con-
tainer returns to its air-dry value, the soil should be re-
moved, oven-dried at 105 ºC for 24 to 48 hours and al-
lowed to cool in a sealed container before measuring the
oven dry weight (ODWt).
15
The volumetric water content at each data point is calcu-
lated as follows:
1)
mi = mass of soil at a given point
during drydown (grams)
mdry = mass oven-dry dry soil (grams)
Vtot = total soil volume (ml)
w = density of water (1g/ml)
These calculations can easily be set up in a spreadsheet.
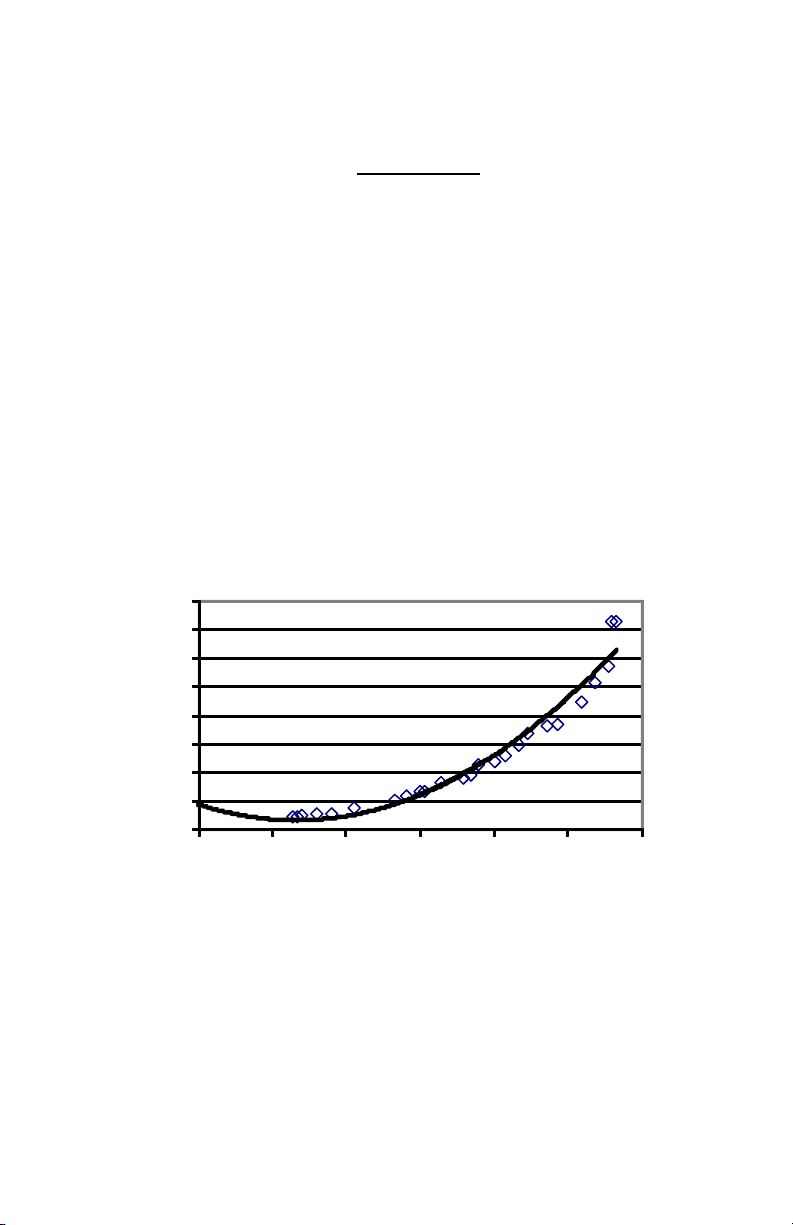
The final step is to perform a regression between the raw
data and the calculated VWC values. Regression analysis
can then be performed on raw sensor data and the calcu-
lated VWC values to develop an equation to convert from
measured readings to actual VWC.
A calibration curve can also be obtained by gradually wet-
ting a pre-measured amount of soil with known incre-
ments of water. Care must be taken to return the soil to its
original bulk density before a sensor reading is made.
0
5
10
15
20
25
30
35
40
1200 1300 1400 1500 1600 1700 1800
V
W
C
(
%
)
Raw Reading
Raw Reading
VWC (%)
)*(
)(
*100
totw
dryi
iV
mm
VWC

16
Soilless Media
Because soilless media tend to be hydrophobic and have a
tendency to shrink dramatically when very dry, wetting
the material and allowing it to dry over time is not the ide-
al method for collecting data for a media-specific calibra-
tion. The recommended procedure is to establish different
moisture contents by adding water to a known quantity of
material and shaking or tumbling it into the soilless media.
This is best done on a mass wetness (MW) basis where
mass wetness is defined as:
2)
Where:
MW = target mass wetness (expressed as percent)
Mwater = mass of water needed
Mmaterial = total air-dry mass of sample
We have found that, for sphagnum peat moss, the relation-
ship between volumetric water content (VWC) and MW is
on the order of:
This can be used as a benchmark to determine your target
MW values. If later you discover you’ve selected too nar-
row a range, this experiment can be repeated.
material
water
M
M
MW *2
*100
VWC = 0.243*MW + 0.5008

17
Calibration procedure
1. Acquire 18 containers with a diameter of 4 to 6 inches
and a height slightly greater than SMEC 300 sensor (2.8
inches). This allows for 3 replicates at 6 different water
contents. Commercially available pots should suffice.
Containers can also be built from PVC.
2. Measure the volume and weight of each container. The
volume can be found geometrically or by measuring the
volume of sand needed to completely fill the container.
Label each container. A convenient naming system would
be to use a number to represent a water content and a let-
ter to represent a replicate. For example, container 4B
would be the second replicate of water content 4.
3. Starting with air-dry material, measure out 6 samples of
soilless media. Each sample should be slightly more than
is required to fill 3 containers.
4. Weigh the material and place it into a plastic bag. Es-
tablish 6 different water content conditions by mixing wa-
ter into the air-dry material. Add enough water to bring
the material to the desired MW. The needed amount of
water can be determined by rearranging equation 2).
3)
5. Twist or seal the bag so no material or water can get
out. Shake the bag vigorously to incorporate the water
into the media. For higher mass wetnesses, the water may
be added in increments. After all the water has been add-
ed and shaken in, leave the closed bag to sit for, at least,
24 hours to allow the water and material to come to equi-
librium.
6. Add wet material to the appropriately labeled contain-
ers. It is best to add the material in 3 increments, gently
tamping each portion to the proper density.
materialwater M
MW
M*
100
*2

18
7. Weigh each of the filled containers.
8. For each container, take three
SMEC 300 readings. Take care
not to take readings too near the
edge of the container. It is rec-
ommended to take readings per-
pendicular to the sides of the con-
tainer. If using the handheld
reader, the reader should be in
Raw AD mode. If taking readings
with a WatchDog weather station
or mini-station, the channel the sensor is connected to
should be programmed to Raw Sensor (raw).
9. After taking the readings, completely air-dry the materi-
al in each container. DO NOT MIX the material from
each container. Find the air-dry weight for the material in
each container.
10. The volumetric water content for each container is cal-
culated as follows:
Where:
VWC = Volumetric water content
Mwet-total = Total mass of container and wet material
Mdry-only= Mass of air-dry material
Mcont= Mass of container
ρw= Density of water (1g/ml)
Vcont= Volume of container
11. You now have 18 VWC values (one for each contain-
er) and 54 raw readings (three for each container). A re-
gression analysis can now be performed to relate raw val-
ue to actual water content.
contw
contonlydrytotalwet
V
MMM
VWC *
)(
Suggested sampling
locations
|

19
Electrical
Conductivity
Electrical conductivity (EC) is a measure of how well a
solution conducts electrons. Pure water does not conduct
electricity at all. However, as the concentration of
dissolved ions increases, the electrical charged carried by
those ions of the solution will increase as well. This is
reflected in a higher EC measurement for that solution.
In soil solutions, the sources of these ions are minerals in
the soil (such as sodium or calcium) and applied fertiliz-
ers. The EC of a liquid at a given temperature is governed
mainly by the amount of dissolved salt ions. However,
when a direct measurement is being made in a wet soil,
the degree of saturation also impacts the measured EC.
This is because as water content decreases, the conductive
path becomes increasingly tortuous, thus decreasing the
EC even though the concentration of salt in the remaining
liquid is increasing. Such an EC measurement is some-
times referred to as bulk EC because it reflects how well
electrons in the bulk soil are conducted. The SMEC 300
measures bulk EC. An alternative measure of EC is pore
EC. This is the value that would be measured if the soil
solution alone were extracted from the soil and measured.
Pore EC will almost always increase as soil moisture con-
tent decreases.
The EC sensor for the SMEC 300 consists of a pair of car-
bon ink electrodes that are integrated onto the sensor sur-
face. The EC electrodes measure the conductivity of wet
soil in contact with the sensor. The carbon ink electrodes
provide a large surface area which minimizes the effect of
localized dry spots or loss of contact in the soil.

20
Volumetric Water
Content
The SMEC 300 measures volumetric water content. The
volumetric water content (VWC) is the ratio of the
volume of water in a given volume of soil to the total soil
volume. At saturation, the volumetric water content
(expressed as a percentage) will equal the percent pore
space of the soil.
In-field soil moisture content will range from air-dry to
saturation. However, plants cannot extract all the water in
a saturated soil and can extract none of the water in an air-
dry soil. Instead, two other moisture content levels, field
capacity and permanent wilting point are often used to
indicate the upper and lower limit of plant available wa-
ter. Field capacity is defined as the condition that exists
after a saturated soil is allowed to drain to the point where
the pull of gravity is no longer sufficient to remove any
additional water. Water draining from a soil profile can-
not, in general, be taken up by plant roots. On the oppo-
site end of the spectrum, permanent wilting point is the
highest moisture level at which an indicator plant cannot
recover turgor after being placed in a humid environment.
Irrigation should be scheduled somewhere between these
two extremes. One rule of thumb is to apply water when
half the plant available water has been depleted. Howev-
er, individual circumstances may dictate a more conserva-
tive or liberal approach. Figure 1 illustrates the plant
available water range for the 12 USDA-defined soil tex-
tures. Keep in mind that these numbers are merely guide-
lines and will vary for individual soils.
Table of contents


