Actel Silicon Explorer User manual
Silicon Explorer
Quick Start
Windows®Environment

ii
Actel Corporation, Sunnyvale, CA 94086
© 1998 Actel Corporation. All rights reserved.
Printed in the United States of America
Part Number: 5199004-1
Release: October 1998
No part of this document may be copied or reproduced in any form or
by any means without prior written consent of Actel. Actel makes no
warranties with respect to this documentation and disclaims any implied
warranties of merchantability or fitness for a particular purpose. Informa-
tion in this document is subject to change without notice. Actel assumes
no responsibility for any errors that may appear in this document. This
document contains confidential proprietary information that is not to be
disclosed to any unauthorized person without prior written consent of
Actel Corporation.
Trademarks
Actel and the Actel logotype are registered trademarks of
Actel Corporation.
Microsoft, Windows and Windows NT are trademarks or registered
trademark of Microsoft Corporation.
All other products or brand names mentioned are trademarks or regis-
tered trademarks of their respective holders.

iii
Table of Contents
Preface . . . . . . . . . . . . . . . . . . . . . . . . . . v
Silicon Explorer Quick Start . . . . . . . . . . . . . . 1
Connecting to the PC . . . . . . . . . . . . . . . . . . . . 1
Software Settings . . . . . . . . . . . . . . . . . . . . . . 1
Connecting Power to the Target . . . . . . . . . . . . . . . 2
Powering the Silicon Explorer . . . . . . . . . . . . . . 2
Current Consumption . . . . . . . . . . . . . . . . . . 2
Using an External Power Supply . . . . . . . . . . . . . 3
Connecting the Probe Pilot to the FPGA . . . . . . . . . . . 3
Connecting Signals to the Target for Logic Analysis . . . . . . 3
Connecting the Probe Leads . . . . . . . . . . . . . . . 4
Using the Probe Instrument . . . . . . . . . . . . . . . . . 4
Using the Timing Instrument . . . . . . . . . . . . . . . . . 5
Troubleshooting FAQs . . . . . . . . . . . . . . . . . . . . 8
Diagnostic Self Test . . . . . . . . . . . . . . . . . . . . 10


v
Preface
This Quick Start manual describes the connections and use of
the Silicon Explorer. A more detailed description can be found in
the on-line help system.
The system requirements for Silicon Explorer and Silicon
Explorer Lite are:
• Designer R3-1998 or later
• 486-66 microprocessor (minimum); Pentium-133
(recommended)
•Microsoft
®Windows 95, 98 or NT™4.0


1
Silicon Explorer Quick Start
The Silicon Explorer is the integration of two debugging
instruments into a single device that attaches to a PC’s standard
COM port. The Probe Instrument controls the ActionProbe
circuitry, enabling the routing of two internal nodes dynamically
to two dedicated pins of Actel devices. The Timing Instrument is
an 18-channel logic analyzer that displays timing analysis of both
the probe outputs, and up to 16 additional signals on the target
system. Each instrument may be used separately.
Actel also offers the Silicon Explorer Lite, which only contains
the Probe Instrument and relies on an external scope or logic
analyzer for viewing signals.
Connecting to the PC
The Probe Pilot and Probe Pilot Lite connect to a standard serial
port using either an 8250 or 16550 UART. Communication is
established via the 9-Pin D-Sub connector.
Software Settings
On installation, Silicon Explorer is set to the Demo mode. You
may select com1 through 4 by selecting the port from the
acquisition menu. The software continuously polls the Probe
Pilot for activity. Setting the port to the Demo mode prevents the
application from opening any COM ports on your system.
The serial port information is saved in the analyze.ini file found
in your Windows directory.
The software defaults to 115,200 baud — at this speed data
transfer will be less than 15 seconds for the entire buffer.
Note: Many notebook computers share the external COM port
with a built-in infrared (IR) port. You may have to enter
your CMOS setup menu to enable the external COM port.
Silicon Explorer Quick Start
2
Connecting Power to the Target
The Silicon Explorer isshipped with a replaceable target cable
assembly (TCA-8020A)thatinterfaces the ProbePilot to your
target system. Aligntheshort redwire onthe TCA-8020withthe
red dot on the case and make certain that the 2mm headeris
fully inserted. Thecontacts on the TCA-8020accept standard
0.025"roundorsquaretest accessories.
Powering the
Silicon Explorer
The ProbePilot ispowered bythetargetrunning at3.0VDCto
5.5VDC.When power is applied, the yellow“heart beat” LED on
the Probe Pilotbegins toblink.
The Silicon Explorer is designed to withstand theabusenormally
found in a lab environment. However, long term exposure to
out-of-rangeconditions can cause failure. In particular,long term
connection toreverse-or over-voltage power conditions can
cause thermal failure.
Current
Consumption
The Probe Pilotisa CMOS device and exhibitsvery low current
consumption at idle, that risesrapidly to several hundred
milliampsduring acquisition. If your power supply is unable to
supply thenecessary current,the Probe Pilotor your targetmay
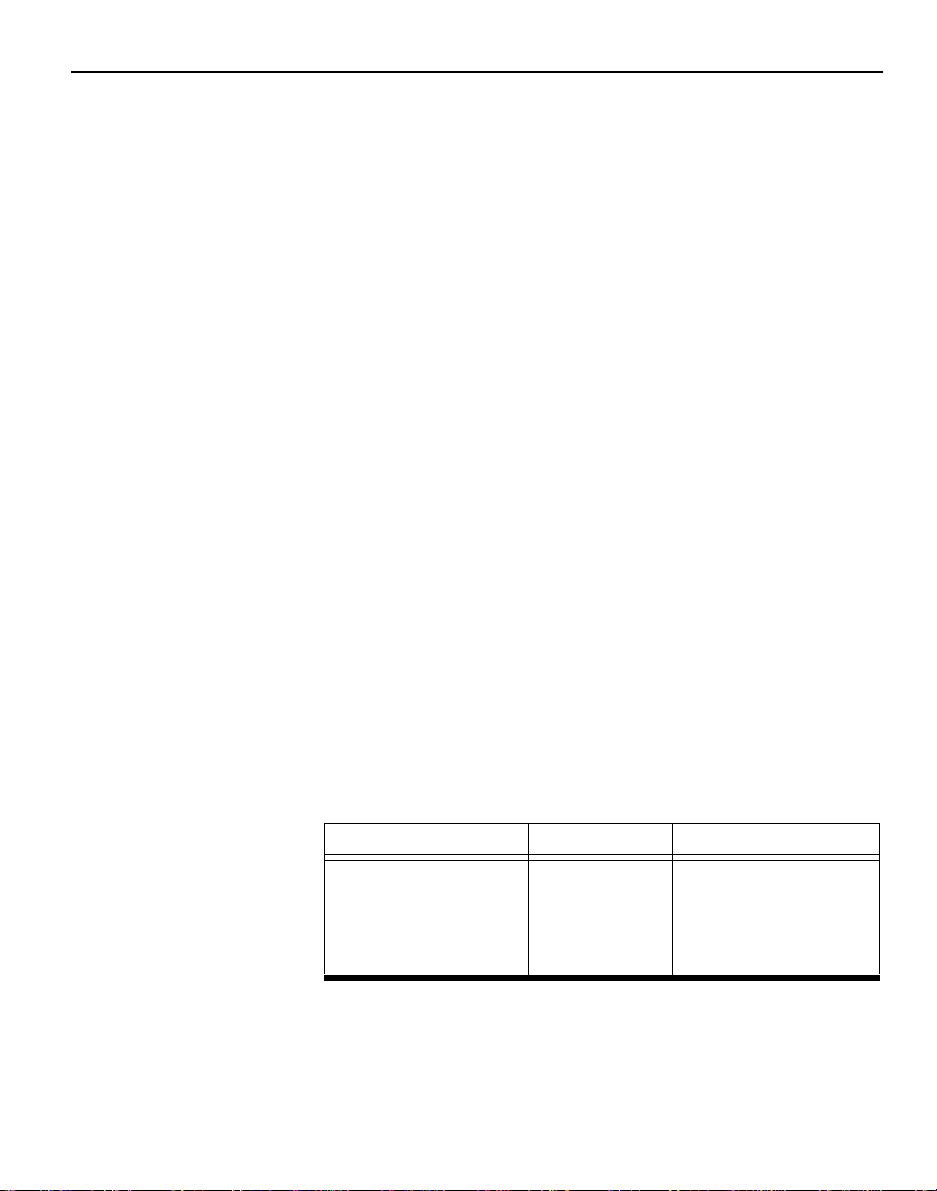
reset.Table 1 is a guideto typical currentconsumption basedon
an acquisition rate at 5V—currentwill be proportionately
higherat 3V.
Table 1.Typical Current Consumption
Acquisition Rate Current@5V
IDLE75maProbe PilotLite
10MHz300maProbe Pilot
20MHz400ma
50MHz500ma
100MHz 700ma

Connecting the Probe Pilot to the FPGA
3
Using an External
Power Supply
For those targets that lack the additional current reserves to
power the Probe Pilot, an external supply may be connected as
follows:
1. Connect the Probe Pilot ground and the power supply
ground to the target.
2. Connect the 5V lead of the supply to the 5V lead of the
Probe Pilot.
Connecting the Probe Pilot to the FPGA
The Probe Pilot has a 22-pin (18 channels, a clock, VCC, GND,
and clock GND) and a 16-pin connector for FPGA debug, using
Actel’s Action Probe circuitry. The Probe Pilot Lite only has the
16-pin connector.
Connecting Signals to the Target for Logic Analysis
Note: This section
does not apply to
Silicon Explorer Lite.
Connect any of the Probe Pilot’s 18 channel leads to the desired
target signals using standard test accessories. To sample
synchronously, connect the CLKIN lead to the target’s clock
which must be a continuous signal. If the clock is greater than
20MHz, connect the CLK GND (twisted pair) to a ground point
near the CLK lead.

Silicon Explorer Quick Start
4
Connecting the
Probe Leads
You can connect the probe leads by
attaching one of two supplied cable
assemblies.
One cable assembly terminates in
individual 0.025 receptacles that can
connect to 0.025 headers or micro-clips
according to the labels on the wires —
the other assembly interfaces directly to
the target board when a 16-pin header
is installed on the target according to
the pin-out shown in Figure 1.
The Probe A and B pins on the probe
connector may be selected as the source
for logic analyzer channels 1 and 2
respectively, by clicking on the # field in the waveform window
and selecting PRA or PRB as the source. Selecting the probe pins
as the source disables the CH1 and/or CH2 inputs from the
target cable assembly.
Using the Probe Instrument
The following procedures describe how to use the Probe
Instrument.
To open a Probe file:
1. Launch The Silicon Explorer software. Select Silicon
Explorer from the Designer menu under Programs in the Start
menu.
2. Select a Probe (.prb) file to open. Select the Open
command from the File menu. Choose (*.prb) as the Files of
type and double click the desired probe file.
The Probe Instrument uses a .prb file during analysis, which
is exported from the Designer software. This file contains
device information, net names, and node location
information. This information is displayed in a tree structure
for verification by the user on the left side of the Analyze
window after a Probe file is opened.
2
4
6
8
10
12
14
16
1
3
5
7
9
11
13
15
Rsvd
Rsvd
Rsvd
Mode
Rsvd
GND
GND
GND
SDI/TDI
DCLK/TCLK
SDO/TDO
TMS
Rsvd
VCC
PRA
PRB
PCB Layout
Component Side
Figure 1. Pinouts

Using the Timing Instrument
5
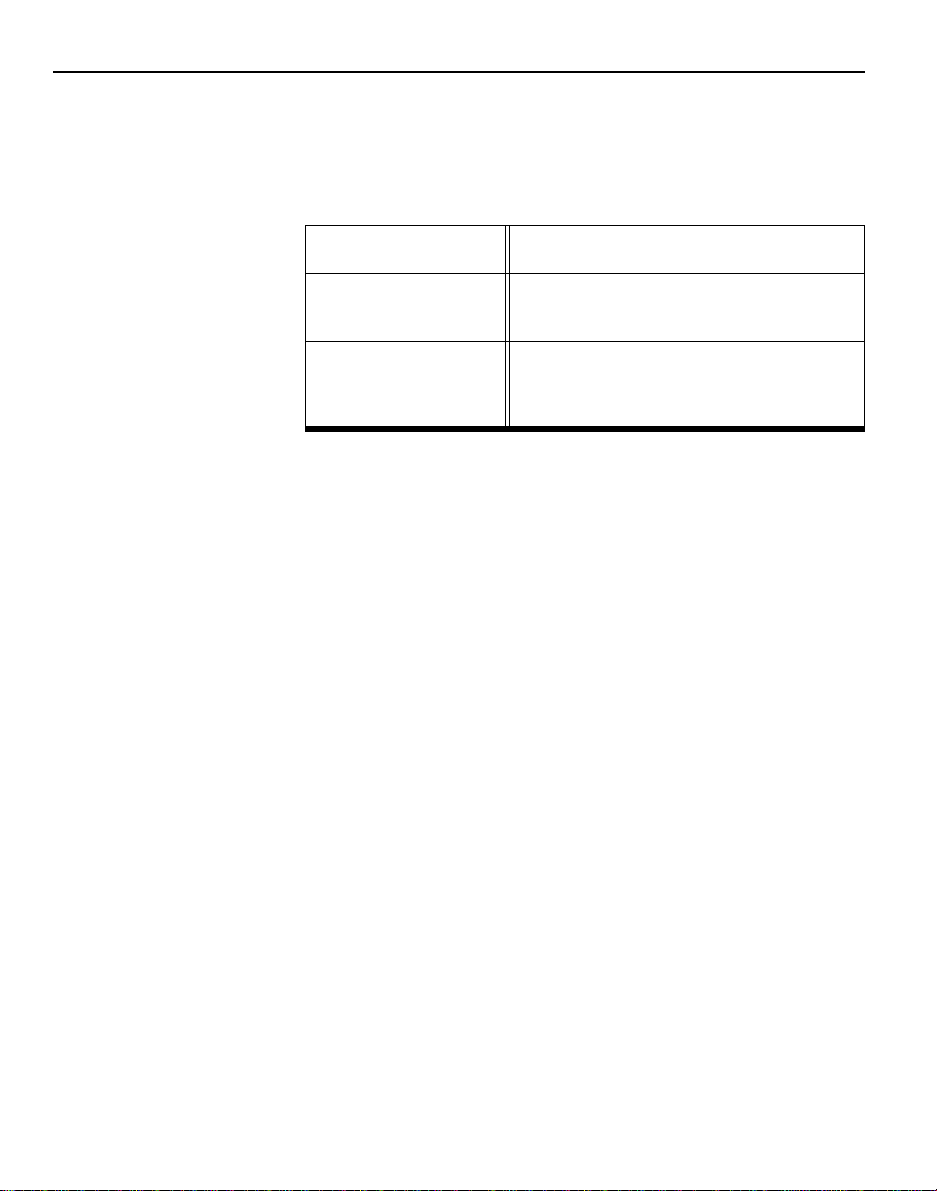
Once a Probe file is open and a device connection has been
made, the checksum of the target device is read and compared
to the checksum in the Probe file. If the checksums do not
match, probing is disabled and an error message is displayed.
Table 2 lists and explains the error messages.
To probe a node:
1. Select the node from the tree by clicking the node
name.
2. Click the PRA or PRB button. The selected node is routed
to the probe pin and the corresponding analyzer input is
switched to the debug connector. The net name is also
displayed in the waveform window.
Using the Timing Instrument
Note: This section
does not apply to
Silicon Explorer Lite.
Select Silicon Explorer from the Designer menu under Programs
in the Start menu and check the status in the lower right corner
of the display. If the COM port is properly selected and power
has been applied, then the status will read IDLE. The Timing
Instrument captures 64K samples which are then uploaded to
the host over the serial port.
Table 2. Checksum Error Messages
Error Message Explanation
Checksum: 383A v.s. ???? The checksum cannot be read
because the probe is not con-
nected or not powered.
Checksum: 383A v.s. 0000 The checksum does not match
the file.
Silicon Explorer Quick Start
6
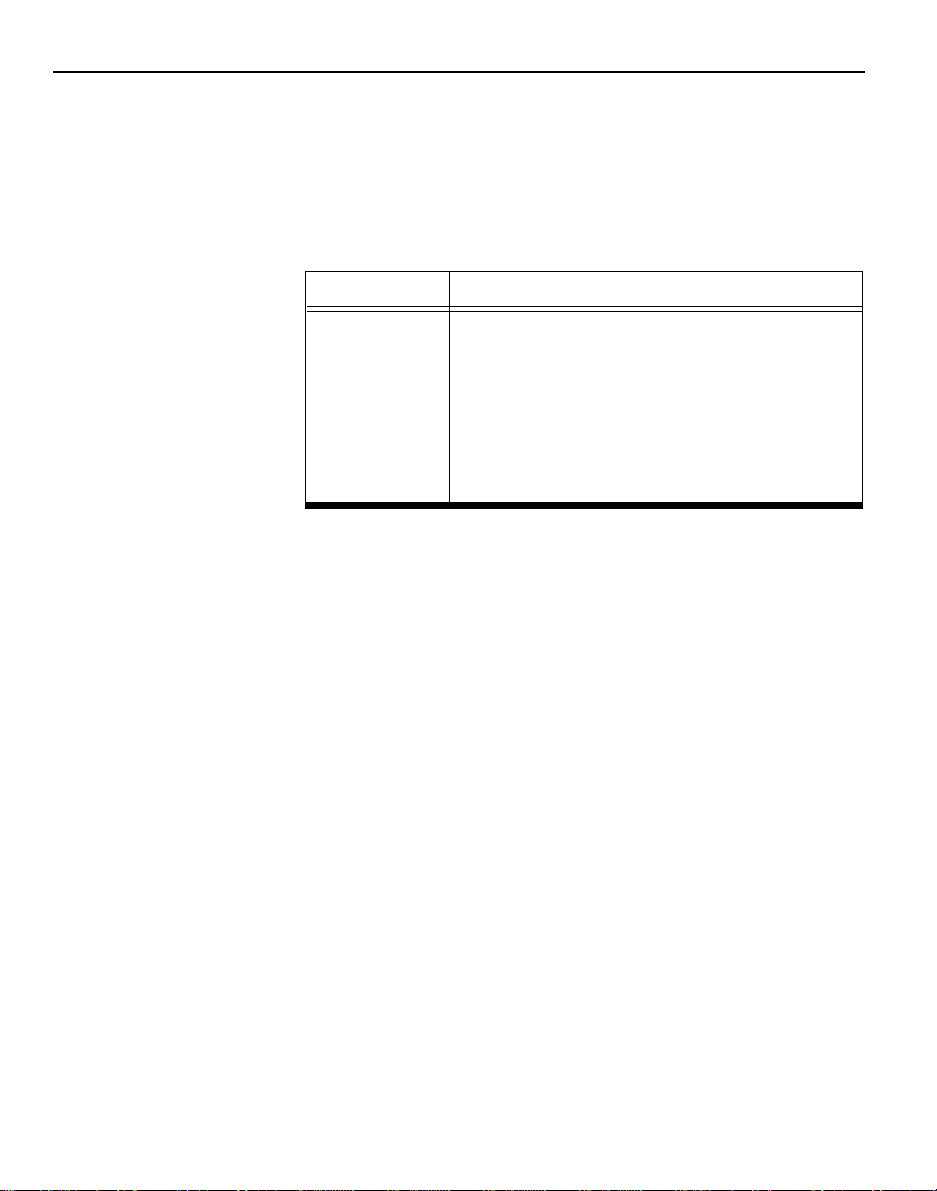
Acquisition parameters may be set from either the tool bar or the
pull-down menus. The parameters are shown in Table 3.
Once the acquisition parameters are set, click the Run button
(red triangle) in the upper left to begin acquisition. At this point
the analyzer will begin capturing data and after the initial 64K
samples are acquired, sampling will continue until either the
trigger pattern is recognized or the stop button (black square) is
pressed (see Figure 2).
During this period, the status window displays PRE for the
pre-trigger state (although you may not see it if the trigger
pattern is matched quickly).
Table 3. Acquisition Parameters
Acquisition Speed 10Khz to 100MHz asynchronous or synchronous
to 66MHz
Trigger Position
4K Pre Trigger 60K Post Trigger
32K Pre Trigger 32K Post Trigger
60K Pre Trigger 4K Post Trigger
Trigger Pattern
Left click on individual signals in the T column
to specify don’t care, low, high, rising, falling or
either edge. The trigger pattern is the logical
AND of the 18 patterns.

Using the Timing Instrument
7
Next, the POST state will be entered and data after the trigger
pattern (or stop button) will be sampled until the post trigger
requirement is fulfilled. Then the data are uploaded to the host
(READ State with progress indicator). The entire upload process
takes less than 15 seconds, although you may zoom in and view
data immediately as the buffer is uploaded as a background task.
Figure 2. Silicon Explorer Window
Signal Name Bus Control
Zoom Buttons Trigger Position
Status COM port
Silicon Explorer Quick Start
8
At this point the data may be viewed. Panning and zooming are
available from either the scroll bars, tool bar, or keyboard
control. In addition, dragging a box in the display area will
perform a zoom window. Table 4 lists keyboard equivalents.
Cursors are placed by left-clicking or right-clicking in the display
area. The time is displayed below the channel labels while the
value is displayed in the C1 and C2 columns. The L or “Live”
Column indicates the current state of the 18 channels when the
analyzer is in IDLE.
The Timing Instrument offers many convenient features for
viewing, saving and printing data. More detailed information is
available from the on-line help system.
Troubleshooting FAQs
Q1: I’ve connected Probe Pilot and the Silicon Explorer window
display reads N/C?
A: Look on the top of the Probe Pilot for the flashing yellow
“heartbeat,” if it isn’t flashing then make sure you have
properly connected an adequate power supply.
Q2: It’s flashing but still N/C!
A: There are a number of things that can prevent
communication from being established. The following lists
the most common:
Table 4. Keyboard Equivalents
Key Function
Up Arrow Zoom In 2X
Down Arrow Zoom Out 2X
Left Arrow Scroll Earlier (Data moves Right)
Right Arrow Scroll Later (Data moves Left)
Page Up Jump One Screen Earlier
Page Down Jump One Screen Later
Home Jump to Trigger

Troubleshooting FAQs
9
1. Wrong COM port. Try all four COM ports even though
you’re sure that your mouse is on COM 1.
2. No power to the Probe Pilot (see Q1).
3. Desktop Systems External connector not connected to
the COM port internally.
4. Laptop Systems external COM connector disabled (Ir
Port Override?). Use your PC’s CMOS setup program to
enable the COM port.
5. COM port IRQ reassigned for DOS program, control
panel not updated.
6. Multiple mouse drivers in system.ini.
7. Third-party serial port “enhancers” not conforming to
windows API.
Q3: I’ve got the IDLE message but when I click on Run, the
Silicon Explorer window flashes an error message and
returns to IDLE.
A: If the target power is incapable of supplying the necessary
current, then the Silicon Explorer window resets and returns
to IDLE. Many current-limiting supplies will trip when set
too close to the operating current.
Q4: The Timing Instrument acquires data and then indicates
errors on read-back?
A: The Timing Instrument bursts data back in blocks at high
speeds, with built-in retry for a bad block (both checksum
and byte count are used). Some third-party serial programs
block all interrupts forcing the analyzer into a retry loop.
Some laptops power down the UART and drop a few
characters. Try disabling “Power Saving” in the CMOS setup
menu.
Q5: When the Silicon Explorer window is open, my other
Windows programs run slow?

Silicon Explorer Quick Start
10
A: If the Silicon Explorer window is open but it is not
connected or powered up, then the system is constantly
timing out looking for a response. Either close the Silicon
Explorer window or change the COM port to DEMO.
Diagnostic Self Test
The Silicon Explorer includes a test header for the Probe Pilot to
perform functional tests of the I/O drivers. If you suspect that
your Probe Pilot has a failed I/O driver, then you can perform
the following test.
1. Connect the supplied ribbon cable from the Probe Pilot,
or Probe Pilot Lite, to the test header and apply power
to the terminals on the test header (Red is positive —
Black is negative).
2. Disconnect the target cable assembly and snap the 2mm
header into the end of the Probe Pilot, observing
polarity (not applicable on Probe Pilot Lite).
3. For both Silicon Explorer and Silicon Explorer Lite:
From the Analyze window, with the status IDLE, select
the Self-Test command from the Help menu to perform
testing on the Probe Pilot port.
4. For Silicon Explorer Lite: From the Explore window
select the Self-Test command from the Help menu to
perform testing on the Probe Pilot port.

Actel Corporation
955 East Arques Avenue
Sunnyvale, CA USA 94086 Actel Europe Ltd. Actel Japan
U.S. Toll Free Line 888.99.ACTEL Daneshill House EXOS Ebisu Bldg. 4F
Customer Service: 408.739.1010 Lutyens Close, Lychpit 1-24-14 Ebisu Shibuya-ku
Customer Service FAX: 408.522.8044 Basingstoke Toyko 150, Japan
Action Facts Technical Documents: 800.262.1062 Hampshire RG24 8AG Tel: +81.(0)3.3445.7671
Customer Applications Center: 800.262.1060 United Kingdom Fax: +81.(0)3.3445.7668
Customer Applications FAX: 408.739.1540 Tel: +44(0) 1256.305600
Fax: +44(0) 1256.355420 5199004-1
Table of contents
Other Actel Measuring Instrument manuals


Popular Measuring Instrument manuals by other brands


Sper scientific
Sper scientific 840020 instruction manual

Sierra
Sierra QuadraTherm 640i Series instruction manual

Dwyer Instruments
Dwyer Instruments 477B Series Installation & operating instructions

Sensus
Sensus 620 manual

Eilon Engineering
Eilon Engineering RON 2501 operating manual

Northern Design
Northern Design multicube operating manual


