AFM Workshop TT-AFM User manual

iI
"
-
TT-AFM
(I
(I
if
iI
"
Users
Guide
"
"
•
"
..
"
.,
"
..
.-
"
"
"
"
..
..
..
..
..
..
•
•
•
•
•
•
•
. . ....
..
AFM
Wo'~op
Part # 10-4172-10
..
--';.
"1',',.
.'
"\.
'.
.
.'
·'UsersGuide '
.
".,
'.
.
.".,
..
Vi.S·· .

•
•
•
•
•
•
•
•
•
':
..,;
..
Page
2
•Definitions and Symbols
The following terms and symbols are used
in
~his
document and also appear
on
the product where safety-related
issues occur. .
•General Warning or Caution
•
..
•
• The exclamation symbol may appear
in
warning and caution tables
in
this document. This symbol designates
an
•
· area where personal injury or damage
to
the equipment
is
possible.
•
• European Union
CE
Mark
• (E
The presence of the
CE
Mark
on
AFM Workshop equipment means that it has been designed, tested and
certified
as
complying with all applicable European Union (CE) regulations and recommendations.
• Warnings/Cautions/Notes
The following are definitions of the warnings, cautions and notes that may
be
used
in
this manual to call attention
to important information regarding personal safety, safety and preservation of the equipment, or important tips.
WARNING
Situation has the potential to cause bodily harm or death.
•
•CAUTION
Situation has the potential to cause damage
to
property
or
equipment.
• NOTE
Additional information the user or operator should consider.
•
•
-•
It
It
..
I
•
I
•
It

•
•
•
•
•
•
•
•
•
•
•
•
•
•
•
•
•
•
•
•
•
•
•
•
•
•
If
•
•
t
•
..
t
-'-
Contents
1.
Introduction
to
Atomic Force
Microscopy':
2.
Introduction
to
the TT-AFM
2.1. Computer
2.2. Stage
2.3. EBox
2.4. Video Optical Microscope
3.
Software
3.1. Loading Software
3.2. AFM-View Software
3.2.1. Pre-Scan Window
3.2.1.1. Files
3.2.1.2. Modes
3.2.1.3. Laser Align
3.2.1.4. Tune Frequency
3.2.1.5. Manual Z Motor Control
3.2.1.6. Range Check
3.2.1.7. Automated Tip Approach
3.2.2. Scan Window
3.2.2.1. Image Window
3.2.2.2. Oscilloscope Window
3.2.2.3 Scan Setup
3.2.2.4. Z Feedback
3.2.2.5. Display
3.2.2.6. Tip Retract
3.2.2.7. Control
3.2.3. System Window
3.2.3.1. Z Noise
3.2.3.2. Z High Voltage Gain
3.2.3.3. Xyz Calibration
3.3.
Virleo-View
Software
4.
Measuring Images With the TT-AFM
4.1. Operating the Video Microscope
4.2. Exchanging Samples
4.3. Exchanging Probes
4.4. Aligning the Light Lever Force Sensor
4.5. Optical Assisted Tip Approach
4.6. Contact Mode Imaging
4.7. Vibrating Mode Imaging
Appendix
A:
Setting Up the TT-AFM
A.1. Selecting a Location
A.2. Setting
Up
the Optical Microscope
A.3. Connecting the TT-AFM
to
the Cables
A.4. System Check
A.5. Aligning the Video and TT-AFM Microscopes
A.6. First Alignment
of
the Light Lever
A.7. Installing
an
Xyz Piezoelectric Scanner
.
Page
3

•
•
•
•
..
•
•
,.
..
Appendix
B:
TT-AFM Files
B.1.
Parameter Files
B.2. Scanner Files
•
..
B.3. Data Files
Appendix
C:
Calibration
, Appendix
D:
Probes
..
Appendix
E:
Technical Information
E.1. Electronic Bock Diagrams
E.2. EBox and Modes
Pin
Assignments
•E.3. Sample and Probe Holder Mechanical Drawings
•
•
it
Appendix
F:
Optimizing GPID Parameters
•
,
,
,
•
,
"
Page
4

•
•
•
•
•
•
•
•
•
•
•
•
•
•
•
•
•
•
•
•
•
•
•
•
•
•
•
•
•
•
•
•
•
•
•
•
•
•
•
1.
Introduction
to
Atomic Force Microscopy
•
In
an
AFM (atomic force microscope), a probe.
is
scanned over a
surface and the motion of the probe
is
monitored
to
create a three-
dimensional image of the
surfac~.
Such microscopes are capable of
measuring surface features of only a few nanometers
in
size. These
unique instruments are capable of measuring high-resolution images
in
ambient air and liquids.
The three-dimensional motion of the probe (or sample)
is
generated
with piezoelectric ceramics. With the piezoelectric ceramics, motions
as
small
as
a fraction of a nanometer are possible. Typically the
sample (or probe)
is
moved
in
a raster pattern
as
the probe glides
across the surface.
A light lever sensor
is
used for controlling the force of the probe
on
the surface while the sample
is
scanned. The light lever reflects a
laser beam off the surface of a cantilever into a photodetector.
As
the
probe
interacts with a surface, the cantilever deflects and the motion
is
sensed with the photodetector.
With this light lever, forces
as
small
as
a pica-newton are possible.
With such small forces, very small probes may
be
used. With micro-
machining methods, probes
can
have diameters of only a few
nanometers.
The light lever
can
be
made more sensitive by vibrating the
cantilever with a small piezoelectric ceramic and modulating the light.
When the vibrating probe interacts with the surface, the amplitude of
vibration may
be
monitored and used to control the probe's force
on
the surface.
Modern atomic force microscopes include not only a probe and
piezoelectric scanner, but additional hardware for bringing the probe
rapidly
Into
me proximity of a surface. A video optical microscope IS
very helpful for operating
an
AFM. The video microscope helps with
aligning the light lever and probe approach and for fining features for
scanning.
For
an
in-depth description ofAFM instrumentation, we recommend
the book Atomic Force Microscopy by Peter Eaton and Paul West.
This book provides a complete
theoretical-as
well
as
practical-
explanation for the design and application of
an
AFM.
•
•
Page
5
Detector
ATOMIC
FORCE
MICROSCOPY
PETER EATON
PAUL
'NEST

•
•
•
•
•
•
•
..
•
•
•
(I
2.
Introduction
to
the
TT-AFM
,.
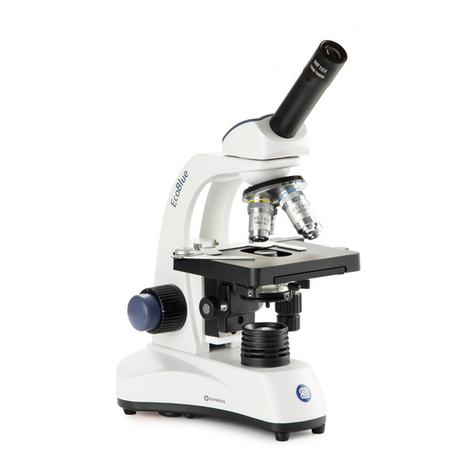
When fully assembled, the TT-AFM comprises four sub-units. They are
• the control computer, the EBox, the stage and the video optical
microscope.
2.1.
Computer
The control computer
is
a standard IBM/PC-type computer with a
Microsoft Windows operating system. There are two programs required
to operate the TT-AFM: the first
is
the AFM control software and the
second
is
the software for the color
CCO
camera.
2.2. Stage
..
Samples are held and scanned
in
the AFM stage.
On
the upright inside
the stage
is
a linear translator which moves the LL-AFM sensor
in
a
•
t»
vertical direction. Also
in
the stage
is
the light lever force sensor,
precision x-y stage and the piezoelectric scanner. Samples are held
magnetically
on
a
1"
diameter plate at the top ofthe piezoelectric
scanner.
"
•Optimal images
are
measured with the AFM stage if it
is
in
a vibration-
and acoustic-free environment. If necessary, a vibration and acoustic
"isolation system should
be
used. Appendix A provides more information
on the best location for the
AFM
stage.
•
•
~
At the front left of the stage
is
a "modes" connector. Signals reqUired for
implementing additional modes such
as
conductive AFM, STM and
EFM are provided. Additional information
on
the cable configuration
is
provided
in
Appendix
C.
2.3.
EBox
The EBox sends and receives signals from the computer through a
single USB cable. Electronic signals are then sent to the stage trough a
60-pin ribbon cable. Additionally, a grounding cable
is
connected
between the stage and the EBox. All cables are connected at the rear
uf
lilt::
CDUX.
Dt::siues [he coole
[0
[he stage, there is a plug for an
auxiliary 50-pin cable that gives access
to
the EBox's internal electronic
signals. Appendix C provides additional information regarding the
cables.
2.4.
Video
Optical
Microscope
,
It
,
It
Aligning the light lever force sensor
is
greatly facilitated
by
the
aid
of
the video optical microscope. Also, the video microscope
can
help
locate features
on
a surface for scanning. Finally, a tip approach
can
be
undertaken much more rapidly with the aid of the video microscope.
Images from the video microscope are displayed
on
a computers' video
.-
monitor.
.-
,
,
,
It
It
It
•
Page
{)
Figure 2.1. TT-AFM stage combined
with the video microscope
in
rear
mode
FigtJre
2 2 Front view ofthe TT-AFM
EBox showing the indicator lights
Figure 2.3. Video microscope
I

•
•
•
•
•
•
•
•
•
•
•
..
Page
7
•
• 3. Software
•The TT-AFM includes three separate software. modules
on
a USB memory stick.
,'.
3.1. Loading Software
• Video Microscope Software:
a)
Plug USB memory stick into
the
computer and open the folder "CCO camera." The contents of the folder are:
..
b)
Copy the folder "RZ300C"
to
the computer desktop.
c)
Plug USB cable into the camera.
..
d)
When prompted, load the camera driver from the memory stick.
e)
Open folder
and
click
on
"RZS300C"
to
launch the program.
AFM Workshop Acquisition Software:
..
a)
Plug USB memory stick into the computer.
I
b)
Copy the contents of the folder "AFMWorkshop" to the desktop.
c)
Once
on
the desktop, open the folder "AFMWorkshop"
and
select "setup.exe."
d) Follow the installation instructions.
•
•
•
I Gwyddion Image Analysis Software:
Gwyddion
is
open-source software
and
the latest version ofthis image-analysis software
is
available
on
the
I Internet
at:
http://gwyddion.net/.
~
Additionally, there
is
a directory
on
the USB memory stick named "Gwyddion." The contents ofthe file are:
IBif,p'
!
<:~~\
~[j
I"
r···'·,
n•
.'C'
';";"
."'"
"1":
~;:
'f!'14
il'k-2.12.9-wn32-2(2)
':.'
..
'
~~~~c.
L7
I
-.
"'·'L',..
._
__
J
't.i.!.,1
l·
"
a)
Launch
and
install the GK2.12.9 -win32 software.
b)
Launch
and
install the Gwyddion 2.xx software.
•
•
I
•
•
I
•
It
•
I
•

bltl~"
&';.'.J"
6;~
QOf"
._.JSlJ~
1)).11-
;~:o:"
jnli- .
~
....
15'0·'
IO.;J-
ttl·,
O·~.a~
.
•.
-.:n~·D~';~"-"'~:oU<~-'
l<."~F'-
•
,.
(I
3.2.1. Pre-Scan
Window
(I
..
The "Pre-Scan" window has
all
of the functions that are
required before
an
image
is
measured.
In
this window, when
a function
is
being used
it
appears with a green frame.
II
3.2.1.1. Files
It
Two files are required
to
operate the AFM-View software.
•
•
It
The "Parameter File" has parameters that are used
to
operate the microscope. The "Scanner File" has calibration
parameters for a specific scanner. Upon launching the AFM-
View software, default files are loaded into the software.
Changing the files used
by
the program
is
possible with the
"File" buttons. Also, these files may
be
edited to change
It
parameters with a text editor such
as
Notepad. Appendix
XX
lists the contents of both the configuration and scanner file.
•
It
It
It
,
•
t·
Page
S
3.2. AFM-View Software
Once launched, the AFM-View software has three screens that can
be
viewed
by
pressing the tabs at the top
right-hand side ofthe screen. The first tab
is
for the "Pre-Scan" window and the second tab
is
for the "Scan"
window. These two windows are pll that
are
needed for measuring AFM images. The third tab labeled "System"
is
used for several functions such
as
measuring the Z noise floor and xyz scanner calibration.
It
It
It

•
•
•
•
•
•
':;~
..
Page
9
3.2.1.2. Modes
There are two TT-AFM modes: "Contact" and "Vibrating."
.-
The modes are selected by the "Scan Mode" button.
When "Vibrating" mode
is
selected, the frequency sweep
window
is
activated.
3.2.1.3. Laser Align
The position of the laser
on
the four-quadrant
• photodetector
is
presented numerically and visually with
the "LaserAlign" window. These two indicators are both
updated
in
real time and are used for aligning the light
lever
in
the force sensor. There
is
a switch for turning the
laser "On" and "Off."
..
•
• Note: After the TT-AFM light lever
is
set up
~,.
for the first time, the thumb screws used for
~
laser alignment do not need
to
be
turned
more than a few turns.
• 3.2.1.4. Tune Frequency
The "Tune Frequency" window
is
used for selecting the
optimal conditions for making "Vibrating" mode images.
There are several controls
in
the window. They are:
"Amplitude"
"Phase"
"Lower" frequency
"Selected" frequency
"Upper" frequency
There are two oscilloscope windows
in
the "Tune
Frequency" window. One shows the amplitude of the
probe's vibration
and
the other shows the phase
between the drive frequency
and
the measured
frequency.
•
•
t
•

Page
10
3.2.1.5. Manual Z Motor Control
The Z motor, which raises
and
lowers the LL-AFM sensor
up
and
down,
is
activated with this window. The speed of
the motion can
be
controlled with the speed slider. When
the "Up" and "Down" buttons are held down, the motor
slews. The motor
is
jogged
by
touching the "Up" and
"Down" buttons.
•
•
•
•
.-
•
• Caution: Before activating the "Range Check"
function make sure that the probe
is
moved
away from the sample surface. If the probe
is
too close to the surface, the probe may
be
broken.
3.2.1.6. Range Check
The usable range of the piezoelectric scanner is measured
with the "Range Check" option. When "Started," the
piezoelectric scanner
is
moved
in
a square motion which
can
be
readily observed with the video optical microscope.
Caution: Always visually monitor the position of
the Z motor. The Z motor
can
drive the
cantilever into the xyz piezoelectric scanner
and
damage both the probe holder and the
scanner.
•
•
•
•
•
3.2.1.7. Automated Tip Approach
The "Automated
Tip
Approach" button starts the process of
the probe moving toward the surface. A woodpecker motion
is
used, which results
in
noticeable clicking sounds from the
microscope stage. This sound
is
from two sources: the
stepper motor being energized and the Z piezoelectric
ceramic being retracted.
•
•
•
•
•
..
..
•

•
•
•
•
•
•
•
•
•
•
•
•
•
•
•
.-
3.2.2. Scan Window
After the instrument
is
set-up using the "Pre-Scan"
functions, the "Scan" window
is
used for measuring AFM
images.
3.2.2.1. Image Window
Two images are displayed simultaneously while scanning.
The type of images and their appearances are selected
in
the "Display" menu window.
As
the images are displayed,
there
is
a constant normalization ofthe data
so
that the
images appear
in
full scale.
3.2.2.2. Oscilloscope Window
A Z versus X position plot of the probe
as
it
is
scanned
across a surface
is
plotted
in
two screens. The data plotted
is selected
in
the "Display" window.
3.2.2.3. Scan Setup
All of the parameters required for scanning are presented
in
the "Scan Setup" window. Once scanning
is
started, these
parameters may not
be
changed. The parameters are:
~:
The scan can
be
either 2-D, which scans just the X
axis, or 3-D, which scans the X and Yaxis.
"Scan Rate": The rate
in
Hertz that the probe
is
scanned
across the surface
in
the X direction.
"Scan Lines": The number of lines
in
the Y axis and the
number of pixels measured
in
the X axis.
"Scan Size": The range ofthe scan.
"Bits Per Bin" This
is
the number of data points signal
averaged per pixel while a scan
is
being taken.
"Center": The center of the scan
in
X and Y coordinates.
"Current Y Position": This
is
the position of the probe
in
the
Y axis as a scan
is
taken.
•
,"Scan Complete": This indicator turns green when a scan
is
completed.
,
,
,
,
Page
11
ro-oOO~
CU(T8nt
Y
j
Po);i!ion,
(10"):.
:'
••
~can
Complete
t
•
•
t

Page
12
3.2.2.4. Z Feedback
All ofthe parameters for maintaining Z feedback are
provided here. The parameters are:
,.
"Gain": Scale factor for the feed,back control signal.
"Proportional": Scale factor for the proportional term
in
the
PID feedback controller.
"Integra/": Scale factor for the integral term
in
the PID
feedback controller.
"Derivative": Scale factor for the derivative term
in
the
PID
feedback controller.
"Setpoint": Parameter that controls the magnitude of
interaction between the probe and surface.
Caution: Ifthe
"z
Feedback" parameters are
too high, the Z ceramic can begin to oscillate
and potentially cause damage to the ceramic.
. "
",
...
-,.
•.•...
'r·:
~'-'
3.2.2.5.
Display
DisI'Ja~j_
There are several options
fOf
changing the appearance of
"7e~~'ma;:,
>'
'i_~~~E~~.
the images displayed
in
the "Scan" window. They are:
Right
Image
rz_ERR
"Left Image": The source ofthe image displayed
in
the left
f
image window. I
....
Background
fLi"~;C;;;;-;g~
.
Displa~
Light
Shaded
"Right Image": The source ofthe image displayed
in
the
right image window. ! Pallet Pall"t 1
"Background": When "Line Leveling"
is
selected, the
background
is
subtracted from the image
one
line at a
time.
• "Display": Two types of displays may
be
selected: "Color
Map" and "Light Shaded."
f'!':.'"'~u;
Y
..
-
3.2.2.6. Tip Retract
C~nt[Q1
.
After scanning a sample, this function
is
used to move the j
.~Qp.
J
r'~~~~~
tip away from the surface. The "Tip Retract" function
Complete
should always
be
used
to
assure that the probe does not I• i> I
Start'·
get damaged after scanning. •
i'
I
Stop'
3.2.2.7.
Control
.j
i
~-
I-E-~i-t
.-,
, These functions start a scan, stop a scan and exit the
AFM-View software.
•
t
,
It
I
Load
T-APp
rc11
4
Z Feedback
•
t

•
•
•
•
';'
..
3.2.3. System Window
The "System" window includes functions that are used for
optimizing the TT-AFM.
':
3.2.3.1. Z Noise
Resolution
in
an
AFM depends critically upon the noise
in
the Z direction. This function permits measuring the
system's Z noise under the same conditions used for
measuring images. However, the probe
is
not scanned
while making the Z noise measurements.
3.2.3.2. Z High Voltage Gain
The high-voltage amplifier that drives the Z ceramic
in
the
xyz scanner can have
14
gains. This function allows
reducing the Z gain
of
the high-voltage amplifier. Reducing
the gain reduces
the
dynamic range of the ceramic, but
reduces the noise floor of the instrument.
3.2.3.3. Xyz Calibration
When scanning a standard test pattern, the values
in
this
sub-window are changed. Appendix C explains how to
calibrate the TT-AFM.
& Note: Changing the calibration values will change
, the scale
on
images measured with the TT-AFM.
• Only change the values when calibrating with a
reference sample.
..
Page
13
Z
Noise
__
st_a_rt
__
1
Finished
l
High~VoltagE!
Gain
"
.'
.
;".:J----'-----.-~
.j
Gain
1jf"o'
-,'
'Calibration
Y
cal
~
r":::-
..
.'
1
, ,
__
sa
...
Ye;..···
....
_1
,
,
•

•
•
•
•
•
it
..
,
•
,
•
,
,
,.
•
•
»
•
-.
•
•
•
•
,
•
•
.-
I
t
•
•
•
•
•
•
,
•
•
•
It
it
"
..
3.3. Video-View Software
Software for visualizing images from the video optical
microscope allows real time visualization of
th'e
probe and
surface. Additionally, the softwqre allows real time capture of
images as well
as
videos. Opera1ion of the video software
requires substantial computer processing speed; when
computers with slower processing speeds are used, the image
can often change contrast. The change
in
contrast is triggered
by other programs using the computer's processing capacity.
Below is a brief description of the function found
in
the
software package.
We
recommend optimizing the parameters
for the particular type
of
sample you want
to
visualize. Before
operating the video camera,
it
must be properly aligned; see
Appendix A
To
launch the video view software:
a)
From the desktop, open folder "RZ300C."
b)
Click
on
the "RZ300C" icon
to
launch the software.
Start Image Display English/Chinese
Capture Image
Pause Image Display Image Pixel Density
Signal Al.€rage Images
The quality of the image viewed with the video microscope depends directly
on
the reflectivity of the sample
being viewed. Thus it is not possible
to
give instructions for optimizing the video microscope images.
It
is
recommended that operators experiment
to
find the best parameters.
Page
14
..
;;;'::7"
t{~c1iii!H!;fuT±tH"'.tA19t.~%!IIUft_&l1!lWit1iht1iJ.$t
~
................
-
....
--.
.....
,--

•
•
•
Page
15
(I
•
4.
Measuring Images With the TT·AFM
Once put together, you
can
expect
to
take a few hours
to
learn how
to
measure images with the TT-AFM, It
is
very important that you learn how
to:
':
a)
operate the video
microscop~.
b)
change samples.
c)
change probes.
d)
align the light lever force sensor,
e)
perform video-microscope-assisted probe approach.
if
" Once these techniques are learned, measuring images
is
relatively simple,
4.1. Operating the Video Microscope
II
"Operating the video microscope
is
essential for efficient operation of the TT-AFM, We suggest that you practice
" operating the video microscope before attempting
to
replace probes or measure images,
XY Position Translator: At the base of the support pole
is
an
XY
position translator used for centering the probe
II
in
the video microscope window.
• Zoom Adjust: The zoom lens allows viewing a surface at high or low magnification. The light intensity must be
adjusted when using the zoom lens.
" Light Intensity Adjust: It
is
often critical
to
adjust the intensity of the light
on
a sample
to
get the best image.
Focus Adjust: Adjusting the location of the microscope's focus
is
very important.
Note: If you are not familiar with the operation of a video optical microscope,
please review the contents of Appendix
A,
section
2,
•
•
•
~
"
..
Focus Adjust
•
•
•
It
Zoom
Adjust
XY
Position Translator
I Light Intensity Adjust
t
It
I
t
,
,
t

•
•
•
•
•
•
•
•
•
•4.2. Exchanging Samples
Metal disks serve
as
the sample holders for the TT-AFM. Samples
may be attached
to
the disks with double sticky tape or with glue.
It
•
•
It Once a sample is attached
to
the
disk, it
is
held
on
the microscope's
sample holder magnetically.
It
is
critical that the sample
be
tightly
bound
to
the sample disk. If it can vibrate, then the image resolution
will be substantially degraded.
II
To
Exchange Samples:
a)
Raise the Z motor
all
the way up with the "Z Motor Control"
function
in
the "Pre-Scan" window.
•
it
It
•
b)
Remove the probe holder (see section 4.3.)
•
,
•
II
II
•
c)
Place the sample disk
on
the top of the sample holder.
Caution: Do not place excessive force
on
the sample
"'.
holder:
as
it
could break away from the piezoelectric
• ceramic. .
•
..
&
d)
Slide new sample disk/sample onto the sample holder.
•
•
t
e)
Replace the probe holder.
It
•
•
t
t
Page
16
Sample
Tape(glue)
Metal Disk
Scanner
Top
"
Magnets
,
-~·;:··l
~:-It':=:.jl:
__
J
t
,
~
•
~

.:,
Page
17
4.3. Exchanging Probes
Exchanging probes takes less than three minutes
in
the TT-AFM if
the following steps are used:
;:
•
•
~
a)
Raise the Z motor until the probe is about
Y.
"from the sample's
surface.
"
..
,
b)
Remove the probe holder.
,
,
,
,
c)
Place the probe holder upside down
on
the probe exchange tool.
,
,
,
,d) Put the probe that you want to install
on
the pedestal of the probe
exchange tool.
,
,
,
,
e)
Push down
on
the probe module such that the spring
is
moved up
,and then slide the probe into position.
To
slide the probe into the
spring, use a sharp pair
of
tweezers.
,
,
,
,f) Place the probe holder back into the microscope.
,
,
•
•
•
t
a
,

Page
18
4.4. Aligning the Light Lever Force Sensor
Aligning the light lever force sensor is greatly facilitated by understanding the optical path
of
the light
in
the
sensor. The following figure shows the light path and the effect
of
turning the adjustment knobs on the light lever.
Gain
Switch
Laser
Left to Right
Up
Down
Detector
Left to Right
Up
Down
Red
Dot
in
Pre-Scan Video Microscope
View
• Motion ofthe laser spot
vvhen
the
Motion ofthe
red
dot
in
the "Pre-Scan"
window
vvhen
the detector adjust knobs are
laser adjust knobs are turned
clockwise.
tumed clockwise.
Tips for aligning the laser
in
the light lever force sensor:
a)
After replacing a cantilever, the laser and photodetector adjustments are usually less than a single turn.
b) It
is
often difficult to see the laser spot on the cantilever because the cantilever reflects the light.
c)
Bringing the cantilever within a mm
of
the sample's surface can help because you can see the laser on the
sample's surface.
d)
If
the cantilever does not alight within a few minutes, try another cantilever.
e) The adjustment screws have backlash, so sometimes the motion
is
not perfectly linear.
f) When
in
"Vibrating" mode, if the resonance peak appears inverted at the top, move the detector gain from
"High" to "Low."

•
•
•
•
Page
19
Light Lever Alignment Procedure:
These instructions assume that the light lever
is
already set up and
aligned. If not, please see the instructions
in
Appendix A.6.
a)
Make sure that the laser light
is
turned
on.
b)
Position the laser and detector position mechanisms at the center
of their range.
It
II
•
c)
Turn the detector knob
at
the top ofthe sensor counter clockwise
(to
the left) until light
is
visible
on
the cantilever substrate. This
should only require one or two turns.
(j
d)
Use the two laser alignment knobs
to
"walk" the laser onto the
cantilever.
,
lit
,
,
•
,
5)
When the laser
is
on
the cantilever
in
the right position (contact
"
a
,position
is
different the vibrating position), move the two
photodetector adjustment knobs until the red dot
is
in
the correct
place.
,
,
,
,
,
•

•
•
•
•
Page
20
4.5. Optical Assisted Tip Approach
Tip
approach
in
the
TI-AFM
is achieved using a woodpecker algorithm
activated
in
the "Pre-Scan" window. Before activatihg the "Automatic Tip
Approach" function
it
is desirable to move the probe as close
to
the surface
as
possible. The video microscope'can
be
helpful.
a)
Focus the video microscope
on
the sample's surface.
b)
With the manual motor control, move the tip down until
it
can
be
seen
in
the video microscope image.
c)
Slowly use the "Jog" function
in
the manual motor approach
and
move the
it
probe down until
it
is
also
in
focus.
At the right are two images of a probe as
it
moves toward a surface. Care
.,
it
must
be
taken not to hit the surface with the probe.
"
•
it
•
.-
it
Note:
If
the tip touches the surface before the "feedback" is activated, the tip
may
be
damaged or even broken.
..
,
,
lip
Away From Surface
..
Typically when doing tip approach with the AFM, the laser
is
on.
The laser
,focus spot can
be
seen
on
the cantilever when the cantilever
is
a sizable
,distance from the surface. As the probe gets close to the surface, a second
laser spot is seen
on
the surface. As the probe gets closer to the surface, the
,v
two spots appear to merge. This effect is useful for judging the distance of
the probe from the sample.
lip
Near
Surface
,.v
,. :..
,..
~
~I
.
,
,
,
,
,
,
..
Table of contents
