Alicat FlowVision 2.0 User manual

USER MANUAL
™

Contact Information September, 2022 • Rev. 2 • FlowVision 2.0™ user manual 2
Contact Information
Alicat Scientific
World Headquarters
7641 N Business Park Dr.,
Tucson, AZ 85743 USA
info@alicat.com • alicat.com
+1 888-290-6060
India
M/s Halma India Pvt. Ltd.
C/O Avire India Pvt. Ltd.
Plot #A-147, Rd. #24
Wagale Ind. Estate, Thane (West) 400604,
Maharashtra, India
india@alicat.com
+1 888-290-6060
China & SE Asia
2nd Floor, Block 63,
No. 421, Hong Cao Rd,
Shanghai, PRC 200233
+86-21-60407398 ext. 801
info-cn@alicat.com
alicat.com.cn
Europe
Geograaf 24
6921 EW Duiven
The Netherlands
+31 (0) 26 203.1651
DOC-MANUAL-FLOWVISION2 · Rev. 2 · September, 2022
Table of Contents
Welcome to FlowVision 2.0™!
System Requirements
Installation
Layout
Workspace and Tabs
Module Panel
Arranging and Docking Tabs
Connecting to a device
Connecting Using a COM Port
Connecting Using Bluetooth
Devices Tab
Device Actions
Changing Gas (Mass Flow Devices)
Setpoints (Controllers)
Totalizer Batch (Mass Flow and Liquid Controllers)
Device Settings
Connection
Measurements
Controller
Totalizer (Mass Flow or Liquid Devices)
Memory Settings
Removing a Device
Logs Tab
Creating a Data Log
Editing Log Entries
Charts Tab
Creating a Chart
Interacting With a Chart
Chart Functions
Other Charts Module Functions
Variables Tab
Variables
Expressions
Scripts Tab
Creating a Script
Edit Script Window
Script Tab
Sample Script
Terminals
Terminal Actions
Flowvision 2.0™ Settings
Bootloader
Updating Flowvision 2.0™
Troubleshooting and FAQs

Introduction September, 2022 • Rev. 2 • FlowVision 2.0™ user manual 3
Welcome to FlowVision 2.0™!
FlowVision 2.0™ is a graphics-based software for operating
any Alicat flow or pressure device via a graphical user
interface (GUI). FlowVision 2.0™ is the latest version of Alicat
Scientific’s FlowVision™ software.
FlowVision 2.0™ can be used to:
• Access information from Alicat devices
• Make configuration changes to Alicat devices
• Monitor performance
• Log data
• Chart data
• Script/automatedevice operations
• Communicate directly with the
device via a terminal tab
! Note: Identifiers and scripts from
earlier versions of FlowVision™ are
not recognized by FlowVision 2.0™
System Requirements
• Microsoft Windows 7 SP1, Windows
8/8.1, Windows 10, Windows 11
• Microsoft .NET Core 3.1*
• An internet connection (if installing via web)
• Serial port**
* Microsoft .NET Core 3.1 can be downloaded at:
https://dotnet.microsoft.com/download/dotnet/3.1/runtime
** Some computers are not equipped with physical serial ports. A
virtual serial port can be utilized with a USB to serial adapter.

Installation September, 2022 • Rev. 2 • FlowVision 2.0™ user manual 4
Installation
Follow these instructions to install the FlowVision 2.0™
software onto the computer intended for use with the Alicat
device.
▲Caution: Do not turn off or restart the
computer during the installation process,
as this causes FlowVision 2.0™ to not install
properly and may damage the computer.
.
Open a browser and go to the FlowVision 2.0™ software
page on the Alicat Scientific website, located here:
alicat.com/flowvision.
2.
Click Download FlowVision 2.0™ to download the file.
Open the file (Setup_FlowVision_2.0_Latest.exe) to
begin the installation.
3.
Choose which folder to installFlowVision2.0™.By
default, the program creates a program folder and
subfolder in AppData. If you want to use another install
directory, click Browse and navigate to the desired
location.Click Next to proceed to the next step when
ready.
4. Review the information on the screen. Once the infor-
mation has been confirmed to be correct, click Install
to begin the installation. If the information is not correct,
click Back and review the previous steps.
5. When the installation process is complete, click Close
to exit.
To start the FlowVision2.0™program, select the program
shortcut from the Start Menu: Alicat Scientific → FlowVision
2.0™.

Layout September, 2022 • Rev. 2 • FlowVision 2.0™ user manual 5
Layout
FlowVision 2.0™ is a modular program with access to layout
customizations that best suit your needs. This section
covers the Flowvision 2.0™ visual space and details how
to customize the software windows and tabs.
Workspace and Tabs
The workspace is the main window of Flowvision 2.0™
(figure 1). The modules list on the left provides access to
the software functions. When tabs are opened, they attach
at the top of the workspace in the tabs group (figure 2).
• Click on a tab for it to expand and fill the workspace.
Tabs are the access point for data, charts, information,
and allow interaction with your device. Tabs are
individually selected by clicking on the tab title.
• Close a tab by clicking the close button
(X) in the right of the tab’s title.
• Separate a tab by clicking and dragging
the tab’s title away from the tabs group it
separates and floats on its own. A separated
tab can leave the workspace window.
Module Panel
See figure 3 and 4
When FlowVision 2.0™ starts, it displays a panel of modules
on the left-hand side. These modules are the main compo-
nents that allow for interaction with your Alicat devices.
Collapsing and Expanding Modules
Clicking on a module expands it with a list of the saved
entries for that module. Within that this expanded space
is also a search bar and a green plus icon that is used to
add new entries. Clicking outside of the expanded module
collapses it back into the Module Panel.
Adding and Deleting Entries
Click the green plus sign to the right of the search bar to
add an entry to a module. Once a model is added it is added
to the saved entries just below the search bar. Entries are
sorted by the order they are added to the module.
• Click on a saved entry to open a tab for that entry
• Hover over the an entry and click the gear icon
( ) to edit or remove an entry from a module.
Figure 1. Workspace.
Figure 2. Tabs group.
Figure 3. Module panel.
Figure 4. Expanded module.

Layout September, 2022 • Rev. 2 • FlowVision 2.0™ user manual 6
Arranging and Docking Tabs
Tabs can be individually maximized, resized, docked various
portions of the workspace, or re-attached to the tabs group.
• To separate a tab, click and drag the tab name away
from the tabs group. The tab breaks o and creates
a separate window from the rest of the workspace.
• Dock a separated tab to a side of the screen
by dragging the tab. An overlay with available
docking options appears in the middle of your
screen. Drag the tab over an icon to dock the tab
to that location. When the floating icon turns white
and a portion of the screen turns red, release the
mouse button to drop the tab into the dock.
• Re-attach an entry tab to the tabs group by clicking
and dragging the tab over another tab and releasing
the mouse button. Alternatively, drag the tab over the
center icon before releasing the mouse button. When
the screen is highlighted in red, release the tab to
return it to the tabs group (figure 5).
Figure 5. Re-attaching module to the tabs group.

Connecting to a Device September, 2022 • Rev. 2 • FlowVision 2.0™ user manual 7
Connecting to a device
To use FlowVision 2.0™ with a device, the device needs to
be added to the Devices module saved items. There are
two ways to connect to devices in FlowVision 2.0™.
Connecting Using a COM Port
See figures 6, 7, and 8
If adding a single device or multiple devices that are
connected to the computer’s ports, use this option.
.
Connect the device to the computer via a cable and then
click the green plus sign in the Devices module. The
Add Device window appears with two options, Wired
or Bluetooth. Select Wired.
2.
Specify the Device ID,Baud Rate, and port of
the device.
• Unless otherwise specified, Alicat devices have
a default device ID of A and a baud rate of 19200
(CODA devices have a default unit ID of 1 as Modbus
RTU is the default communication protocol).
• If the computer has a built-in serial port, it
is typically registered as COM 1. USB to
serial adapters determine the next available
port name and register it as such.
• To find the exact port number you are
connecting to, look at your computer’s Device
Manager under the Ports tab. If using a USB
cable and the port number is still uncertain,
try unplugging and plugging the USB cable in at
the computer. The port disappears when
unplugged and reappears when plugged in. If
issues continue, use the port troubleshooter
at alicat.com/support/software-drivers/
or contact Alicat for assistance.
• If the name field is left blank, the name
generator creates a name using the value of
the device’s ID, model, and serial number.
3.
Clicking Advanced adds a timeout for how long in
milliseconds to wait before the device is considered
unreachable.
4.
Click Add. If all the parameters are entered correctly, the
device is saved as an entry under the Devices module.
Click the close button (X) in the top right-hand corner
to exit adding a device.
If the device is not detected by FlowVision 2.0™, a new
window appears asking if you still want to add the device
or cancel. If the device is properly connected to the
computer but is still not showing up in the Devices module,
try searching for the device by clicking the arrows next to
Device ID and Baud Rate This created new fields to search
to create a range to search for the device through (Figure
8). You can also select multiple ports to search. When
the search function discovers a device, FlowVision 2.0™
prompts you to select which device(s) to connect.
Figure 6. Green plus sign for adding a device.
Figure 7. Connecting using a COM port.
Figure 8. Searching for a device.

Connecting to a Device September, 2022 • Rev. 2 • FlowVision 2.0™ user manual 8
Connecting Using Bluetooth
See figure 9
If your Alicat device has Bluetooth capabilities, you can
connect to FlowVision2.0™ wirelessly using the steps below.
! Note: Alicat devices with Bluetooth
include the FP-25 and the MB units
with the Bluetooth configuration
(–BT in the part number).
. With your device powered on and within the Bluetooth
range, click the green plus sign to the right of the
search bar in the Devices module. The Add Device
window appears.
2.
Select the Bluetooth option. The window automatically
starts scanning for Alicat devices over Bluetooth. Once
detected, the device appears with Alicat, its model, and
its serial number.
3. Select the device and click the Add button.
4.
Click the Close button (X) at the top-right corner to
exit the add device window. Once the device has been
added, it appears as an entry under the Devices module
in its saved entries list.
Figure 9. Connecting using Bluetooth.

Devices September, 2022 • Rev. 2 • FlowVision 2.0™ user manual 9
Devices Tab
See Figure 10
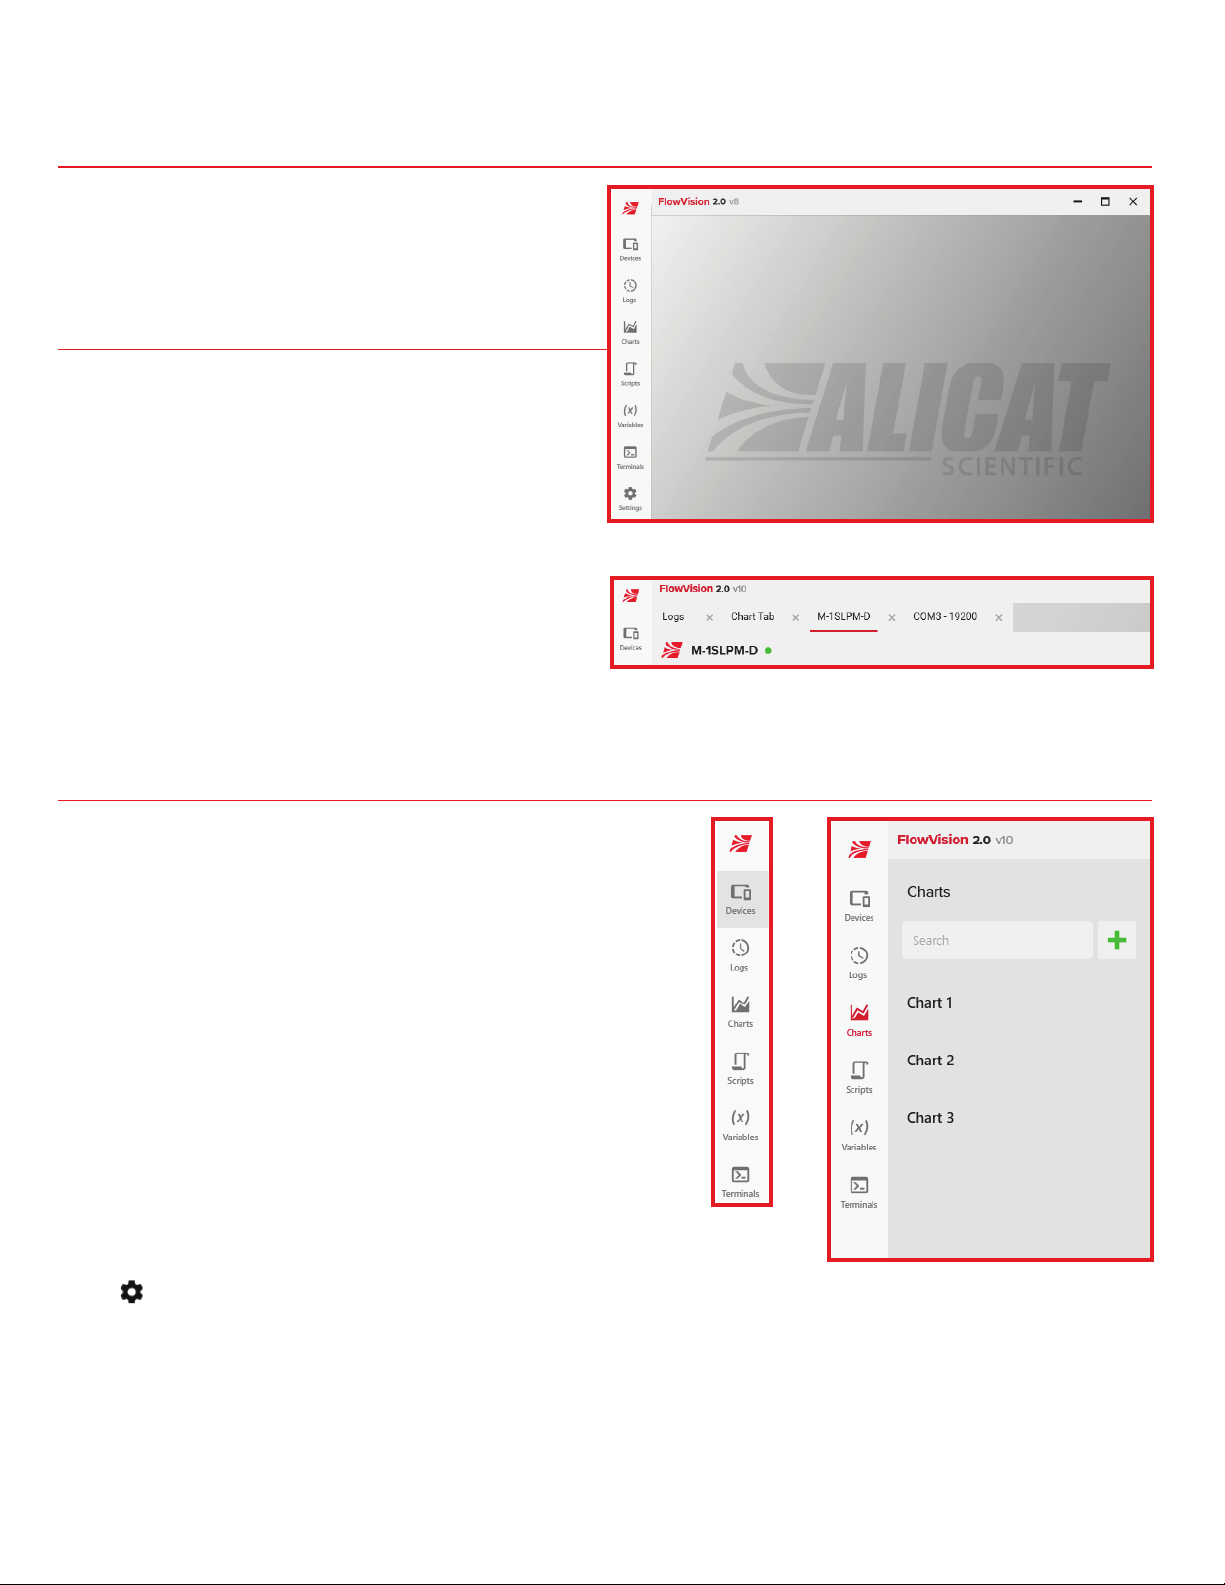
Open the device tab by clicking a device’s name in the
Devices module saved items.
• The colored circle to the right of the
device name is the status indicator.
• The indicator is green if the device
is communicating properly.
• The indicator is red if the device is in
error or not communicating.
• Below the device name is a row of buttons. This
is referred to as the device actions panel.
• These are items like reset totalizer, lock screen,
refresh, and more depending on the device.
• The left side has buttons and fields that
you can use to control the device.
• Depending on the device, this can include items
like setpoint, gas selection, batch, and more.
• The right side of the tab shows live measurements
from the device (updated every 150ms by default).
• To obtain information on the device (Model, serial
number, firmware version, and full scale range), click
the information button in the top right hand of the tab
(figure 11).
Device Actions
Just beneath the device name are the device actions. These
are quick functions that perform simple tasks on the device
or in the tab. Not all actions are available on all devices.
Reset the Totalizer
Devices that have an enabled totalizer can track the total
mass and volume that flows through the device. When this is
the case, the Reset Totalizer button appears in the device
actions panel.
• Reset the totalizer by clicking Reset Totalizer. The
value resets immediately, without confirmation.
• This will also resets the amount that’s
been batched, starting a new batch if it
has been completed (page 10).
Lock/Unlock the Screen
If your Alicat device is equipped with a screen, it can be
locked and unlocked using FlowVision 2.0™. The Lock
Screen option is located in the device actions panel near
the Reset Totalizer and Refresh buttons.
• Lock/Unlock the screen by toggling Lock
Screen. The icon has a check mark in the bottom
right when the device’s screen is locked.
Refresh Device
The refresh button manually polls the device and updates
the live measurements.
Tare Function
The tare function sets the zero flow reading on a meter or
gauge and is not present on controllers. Tare the meter by
clicking the Tare button. Taring occurs immediately, with no
confirmation. Controllers use the auto-tare function found
in the device settings (page 12).
! Note: The tare function is discussed in detail
in the instruction manual for your device.
▲Warning: Tare flow only when there is no
flow through the unit. Tare pressure only
when the device is venting to atmosphere.
Duplicate
The Duplicate button creates a second tab for the device
and adds it to the tabs group.
Figure 10. Device tab.
Figure 11. Device information.

Devices September, 2022 • Rev. 2 • FlowVision 2.0™ user manual 10
Changing Gas (Mass Flow Devices)
To change the gas that the device measures:
.
Select the device from the Devices module list to open
its tab.
2.
Click the drop-down menu under Selected Gas and
scroll down to the gas that you are flowing.
3.
Click the desired gas. The device is now set to measure
that gas.
! Note: If you do not see the gas you are
flowing on the list, please contact Alicat
before proceeding to verify if your unit
is compatible with the desired gas.
▲Caution: Do not flow gases that are not
on the gas list. Doing so voids the device
warranty and may cause permanent damage
to your flow device. Contact Alicat with
any questions about supported gases.
Setpoints (Controllers)
See figure 13
The setpoint field allows you to change the setpoint on
a controller. The type of setpoint is displayed under the
selected gas in the device tab.
• Change the setpoint by entering the desired
value in the setpoint text box, then click Apply.
• Reset the setpoint to zero by clicking Zero.
• Change the setpoint type by going into the
device’s settings. Under the Controller tab,
change the selected setpoint type.
! Note: If your device’s setpoint source
is set to analog, the setpoint entry is
hidden. The Setpoint source is changed
to Serial/Front-Panel through the device’s
settings under the Controller tab.
Totalizer Batch (Mass Flow and Liquid Controllers)
Controllers with an enabled totalizer have the option to
dispense gas in batches of a desired volume. To do so,
perform the following:
. Reset the setpoint to zero.
2.
Enter the desired amount in the Totalizer Batch field
and click Apply.
3. Enter a valid setpoint and click Apply.
Once the desired amount of flow has passed through the
device, the valve shuts, but the setpoint remains the same.
The valve will remain shut until either the batch size is zero,
or Reset Totalizer is clicked. Clicking Reset Totalizer with
a defined setpoint starts a new batch.
The engineering units of the batch are determined by the
Total Mass Unit box in the Measurements tab of the
device settings.
! Note: If the totalizer is not enabled,
please refer to your device’s manual
(alicat.com/manuals) on how to enable it.
Figure 13. Device Tab. Note the setpoint on the left.
Figure 12. Selecting a different gas.

Devices September, 2022 • Rev. 2 • FlowVision 2.0™ user manual 11
Device Settings
Device settings control a number of dierent functions and
features of your device. To access the device settings, click
the gear icon ( ) next to the name of the device entry in
the device modules saved entry list or the gear in the top
right portion of the device tab. Below are explanations of
each section within these settings.
Connection
See figure 14
The connection section controls how the device commu-
nicates with Flowvision 2.0™.
Connection Settings
Connection settings is used to modify things like the device
name, port, baud rate, device ID, and the polling rate.
If port or baud rate are modified, connection to the
device is lost until it’s connected to the new port and
the baud rate is updated on the device itself.
Changing the Polling Rate modifies how often the device
information is updated. The default rate is 150ms.
Measurements
See figure 15
The Measurement section in the device settings window
allows you to adjust units of measurement, averaging,
and STP/NTP settings for an Alicat device.
Units of Measure
You can adjust the desired units for each type of measure-
ment displayed by an Alicat device. By default, only related
units of measurement are displayed in each dropdown
menu.
• Change the unit of measurement by selecting a new
unit from the dropdown menu underneath each
measurement type, and clicking Apply. The device
updates to display the new unit of measurement.
Averaging
Averaging the flow over a longer time is useful in smoothing
fluctuating readings. Values correspond to the time constant
(in milliseconds) of the averaged values. Higher numbers
generate a greater smoothing effect. The maximum
averaging time is 255 ms.
• Adjust the averaging by setting the number in
one of the Flow Avg text boxes to your desired
time in milliseconds (ms), and click Apply.
STP/NTP
If the device measures mass flow, you can adjust the STP
(Standard Temperature and Pressure) or NTP (Normal
Temperature and Pressure) values of a device to reflect a
controlled environment.
When the unit of measurement for mass flow is set to a
standardized unit, such as , the STP settings display.
However, when the unit of measurement is set to a
normalized unit such as , the settings display.
• Adjust the STP or NTP by setting the number in
the Temperature textbox to your desired value in
°C, and set the number in the Pressure text box
to your desired value in ATM. Then click Apply.
Figure 14. Connection settings.
Figure 15. Measurement settings.

Devices September, 2022 • Rev. 2 • FlowVision 2.0™ user manual 12
Fluid Density (CODA Devices)
See figure 16
CODA devices use density to calculate a volumetric flow
rate. A standardized density can be set if desired.
• Select Fluid Type, Fluid, and Temp to
set the new standardized density.
• Click Apply. This density displays in the device tab
and is used for the volumetric flow rate calculation.
Controller
See Figure 17
The Controller section adjusts the setpoint source, auto-
tare function, and valve tuning of an Alicat controller.
This section is not present on meters and gauges.
Control
The control portion of the Controller section manages the
setpoint of the controller. The Setpoint Source manages if
the setpoint is controlled by an analogue input or through
serial communication and the front panel display (if a display
is present).
• Adjust the source by using the dropdown
menu under Setpoint Source to make
a selection, then click Apply.
• Adjust the setpoint type by clicking the Setpoint
Type dropdown menu and selecting a type of setpoint
(mass flow, volumetric, pressure etc), then click Apply.
Valve Oset
Gas pressure in the system exerts a mechanical force on
the control valve that, depending upon the gas pressure,
may slow the valve’s response when opening from a zero
setpoint. To compensate for this, adjusting the valve
offset (or “preload”) may speed up integration time.
• Adjust valve oset by setting the value of the
number under the Valve Offset label, then
click Apply. Valve oset is a percentage value
between 0 and 100, with 0 being little to no
oset and 100 being the maximum oset.
PID
If you require specialized valve tuning, adjusting the
values of a device is necessary. Adjustment of values
changes valve stability and speed.
▲Caution: It is strongly recommended
that adjustments to settings not be
made unless you have experience with
proportional valve tuning. Improper
tuning may damage the device or valve.
• Adjust tuning by clicking the dropdown
menu under PID Type and selecting either PD/
PDF or PDDI. Set the new values for each
parameter in the fields below, then click Apply.
Auto Tare
Enabling auto tare sets the device to tare after a zero
setpoint is established for a given amount of time. The delay
field below the toggle indicates how long the device waits
before taring. This wait is measured in seconds.
Figure 16. Fluid density settings.
Figure 17. Controller settings.

Devices September, 2022 • Rev. 2 • FlowVision 2.0™ user manual 13
Totalizer (Mass Flow or Liquid Devices)
Devices with a totalizer enabled have an extra setting. The
totalizer section controls what measurement the totalizer
counts, mass flow or volumetric. On liquid devices, this will
only be volumetric.
Memory Settings
See Figure 18
The Memory section controls whether the setpoint
and gas type values are saved to the device’s EEPROM
(electronically-erasable programmable read-only
memory).
.
Under the EEPROM section, click the button to the
right of each setting to toggle it on or o. When the
button is active (red), the setting saves to EEPROM and is
remembered as the device powers on. When the button
is inactive (gray), the setting is not saved and resets to
the default value as the device turns on.
2.
Click Apply to confirm the new settings or Cancel to
revert to the original settings.
Removing a Device
Removing a device is found in the bottom left hand corner
on the device settings window. Clicking Remove prompts
a confirmation window to appear. Clicking Yes removes the
device and clicking No closes the confirmation window and
returns the screen to the device settings options.
Figure 18. Memory settings.

Logs September, 2022 • Rev. 2 • FlowVision 2.0™ user manual 14
Logs Tab
You can use data logs to keep records of measured data
over time. Data logs are viewed outside of FlowVision 2.0™
or are incorporated into an external database.
Creating a Data Log
See figure 19 and 20
.
To create a data log, click the green plus sign to the
right of the search bar in the Logs module. Define a
name for the new log and click Add.
2.
The Edit Log window appears allowing to configure the
new log. The log name entered in step 1 is automatically
filled in, but can be changed at this stage.
3. Below the name is the Logging Rate. Enter how often
you want the device to record its current state to the log
using days, hours, minutes, and seconds.
4.
Below these fields is the Log Type option in a dropdown
menu. Select either a CSV File or a Database to write
the log data to.
When selecting CSV File, specify a file path under File that
your computer has permission to write to. Click the red
folder icon to the right of the File text box to browse for a
location to save on your computer. When the log is active,
FlowVision 2.0™ continuously writes to this file. Depending
on the rate and amount of data being logged, there is a
potential for the log to exhaust the space on your hard
drive. Splitting the CSV file into smaller pieces may make
the data more manageable. To do so, toggle the button from
No Split to Split Every. Then set how often the log splits.
If you select Database, specify the type of database from
the dropdown menu (only Microsoft SQL Server, MySQL
Server, and PostgreSQL are currently supported). Then,
provide a connection string with sign-in credentials and the
name of the table in the database. Note that since these logs
are handled by external programs, the splitting functionality
is disabled for database types.
Once the log is created, it needs to be manually started.
Click on the log name inside of the Logs module saved
items list. This opens a tab with all of the saved logs inside
of it. Press the play button next to a log’s name to start
it. When running, the log’s box turns green and the play
button becomes a pause button. Press the pause button
to stop the log (figure 20).
! Note: A log continues to run at the
specified interval until stopped manually
or until the program exits. Closing
the tab does not stop the log.
Figure 19. Edit log window.
Figure 20. Running a log in the logs tab.

Logs September, 2022 • Rev. 2 • FlowVision 2.0™ user manual 15
Editing Log Entries
See figure 21 and 22
The Entries panel is beneath the options in the Edit Log
section. Adding items here determines the data being
logged. The CSV file creates columns for each entry item
along with the timestamp when data was recorded. There
are many options for dierent possible entries that can be
recorded. These instructions use a Device Measurement
value as an example of adding a log entry. If further
assistance is needed, please contact Alicat (page 26).
.
To add a new entry to the log, click Add on the right side
of the Entries section. The edit log entry window opens.
2. Enter a Name for the entry. The name can only contain
letters, numbers, and underscores.
3. Under the Device Measurement drop-down, select a
device measurement, constant, variable, or expression
to be recorded by the logger. This drop-down dictates
the other options for the entry, and the other entries
change based on this selection. For this example, select
Device Measurement.
4. Select a Device from the dropdown menu to log data
from. Once a valid device has been selected, the Value
dropdown menu populates with data types that can be
collected from the device.
5.
Click the Value dropdown menu to select a value to
be recorded.
6.
In the Unit dropdown menu, select the unit of measure-
ment to be used. The default unit of measurement for
the given measurement Value is automatically selected.
Click Apply when finished. The entry is added to the
Entries list.
7. Repeat steps 1 through 6 for each data point you want
to be recorded in the log.
8. When finished adding entries, click Apply on the Edit
Log window to save the log.
Figure 21. Edit log entry window.
Figure 22. Selecting an entry to log.

Charts September, 2022 • Rev. 2 • FlowVision 2.0™ user manual 16
Charts Tab
Charts are line graphs that are continuously updated with
live data. A chart can log multiple measurements and also
provide reference points to compare data.
Creating a Chart
See figure 23
FlowVision 2.0™ allows you to create charts to display data.
Like logs, charts can cover several dierent options. The
following instructions are for adding a chart for a device
measurement. The process for other options is similar, but
if further assistance is needed, please contact Alicat (page
26).
.
To the right of the search bar, click the green plus sign.
2.
Define a name for the new chart and click Add. The Edit
Chart window appears (figure 23)allowing you to add
data series for the chart. The name you entered in the
previous step is automatically filled in, but can still be
changed if desired.
3. Click Add to the right of Series to add a data series to
the chart. This opens a new Edit Chart Series window
to set up the data series.
4.
Clicking Import From Data Frame polls the device’s
serial data frame and creates a series for each item that
is found there. (See the Serial Communications Primer at
alicat.com/manuals for more information on data frames).
5. Enter a Name for the series if desired. To automatically
generate a name for the series, leave the name field
blank. If no name is provided, FlowVision 2.0™ assigns a
name with the device and entry value type. Occasionally,
if the value type is too complex to generate a name
automatically, an error window asks you to manually
enter a name.
6. Click the colored square to open a window and select
a color for the data series. Clicking outside the window
sets the color value with the chosen color’s hex code
prefixed by a pound sign/hashtag (#). It is also possible
to type the hex code for the desired color.
7.
Select Device Measurement. (This is the same system
used in the Logs module and each option has dierent
fields to choose from. Device measurement is covered
in this example).
8.
Click the Device menu to select an device to chart from.
After a device is selected, the Value dropdown menu
populates with data types that can be collected from
the device.
9. Click the Value dropdown menu and select a value to
chart.
0.
Click the Unit dropdown menu to see the available units
of measurement. Select the unit of measurement you
want to be displayed in your chart, and click the Apply
when finished. The series is added to the Series list
back in the Edit Chart window.
. Repeat steps 3-10 for each data series to be charted.
2.
Click Apply in Edit Chart to complete the process. The
chart opens in a new tab and starts displaying data.
Figure 23. Editing a chart.

Charts September, 2022 • Rev. 2 • FlowVision 2.0™ user manual 17
Interacting With a Chart
Chart Functions
See Figures 24 and 25
The icons along the top left of the chart tab (just under the
chart name) are the chart functions. These control features
about how the chart is viewed, how it moves, and what data
series is currently present on the chart.
Rate
By default, new data is charted every 50 milliseconds, but
this can be sped up or slowed down by adjusting the value
of the Rate field. The new rate takes eect when selecting
the enter key or clicking outside the Rate field. Note that
the chart continues to receive and display data until its tab
is closed or until FlowVision 2.0™ exits.
Auto Track X
The chart tracks data while moving the X-axis forward and
presents the latest data in the process. You can toggle
this function by clicking the Auto Track X button( ).
Disabling this option prevents FlowVision 2.0™ from moving
the X-Axis forward but doesn’t prevent it from receiving
or charting new data. Auto tracking is also automatically
disabled while zooming in and out of the chart (it enables
again once zooming is complete).
Auto Scale Y
The minimum and maximum values are visible at all times
by default using the Auto Scale Y function. This prevents
the chart data growing beyond the Y-axis. If data grows
beyond the visible range, the chart will pull back the Y-axis
to make it visible. To enable/disable, click the Auto Scale Y
button ( ). Disabling allows you to freely zoom and move
around the chart, but new data points may be displayed
outside of the visible range.
Show Labels
Hovering over the chart displays the labels of the data
series and their charted values at that given moment. This
is enabled by default and can be toggled on/o by clicking
the Show Labels button ( ).
Show Legend
To show or hide the chart legend from view, you can use
the Show Legend toggle ( ). Inside the legend are also
boxes to enable and disable specific entries within the chart.
Clicking the red check mark hides the entry, but data is still
being charted even when the entry is not visible.
Drag to Pan
Drag to pan() allows for clicking and dragging to move
the chart view along the X-axis. To view previous data
without this enabled, you must zoom out and then zoom
back in on the desired data.
Show Range Selectors
It is possible to dictate a range of data to view by using
the Show Range Selectors ( ) function. This adds two
vertical lines to drag along the charted data. The data
lines between these two lines becomes the selection.
This function is disabled by default. Enabling Show Range
Selectors disables Auto Track X, but it can be re-enabled
without disabling Show Range Selectors.
Zoom Functions
See Figures 25 and 26
Most of the zoom functions are found on the top right of
the chart tab.
Zoom In and Zoom Out
Use the Zoom In () and Zoom Out ( ) buttons in the
chart actions panel to perform their respective functions.
You can also hover over the chart and scroll with the mouse
wheel up to zoom in and down to zoom out.
Zoom on X-Axis and Zoom On Y-Axis
To enable/disable the zooming function on an axis, click
either the Zoom On X-Axis ( ) or Zoom On Y-Axis
buttons ( ). When disabled, the chart will not zoom along
the respective axis. These are found on the top left of the
chart tab
Reset Zoom
To reset the zoom scale of the Y-Axis back to the current
minimum/maximum values of data, click Reset Zoom ( )
to the left of the Zoom In and Zoom Out buttons.
Figure 24. Charts tab.
Figure 25: Chart functions(left to right): Polling Rate,
Auto Track X, Auto Scale Y, Show Labels, Show Legend,
Drag to Pan, Show Range Selectors,
Zoom on X-Axis, Zoom on Y-Axis.

Charts September, 2022 • Rev. 2 • FlowVision 2.0™ user manual 18
Zoom to Selection
The Zoom To Selection ( ) function is available when
the Show Range Selectors function is enabled. Zoom to
Selection fills the chart view with the selected range. Auto
Track X should be disabled before performing this action
or else the chart will continue to move with the new data.
Other Charts Module Functions
See figure 26
Located in the top right of the chart tab are further functions
used to interact with the chart.
• Open the Edit Chart window by clicking the gear icon
( ). This window allows you to edit the data series for
this chart.
•
Save image is activated by clicking the camera icon( ).
It is recommended to disable Auto Track X temporarily
so that the chart isn’t moving while saving the image.
•
Reset the scale of the Y-Axis to the current minimum and
maximum values in the data series with the Refresh icon
(). This button does not clear any existing data points
already added to the chart and only resets the view.
•
Create a copy of the current chart in a new tab using
the duplicate icon( ). A second tab opens using the
same chart. Interacting with one chart doesn’t aect
the other chart.
Figure 26. Zoom and other chart functions (left to
right): Reset Zoom, Zoom to Selection, Zoom Out,
Zoom In, Save image, Refresh, Duplicate.

Variables September, 2022 • Rev. 2 • FlowVision 2.0™ user manual 19
Variables Tab
Expressions and variables are ways to create formulas,
equations, and data variables inside FlowVision 2.0™
modules. These are options that can be selected in the
measurement type option for logs, charts, or scripts to help
FlowVision 2.0™ adapt to your desired data and processes.
Variables
See figure 27
There are three possible variable choices, Conditional
Variable, Numerical Variable, or Device Variable. A
conditional variable can hold a true or false value, a numer-
ical variable can hold a number (integer or decimal), and a
device variable holds a connected device.
These variables allow for the option to modify expressions,
scripts, or other items quickly and as needed. When
expressions use a custom variable, updating the variable
also aects the expression. This cuts down on having to
manually update multiple expressions or scripts that use
the same variable. A device variable can be changed on the
fly and all expressions and scripts update with the change.
To create a variable, perform the following:
. Click the green plus sign to the right of the search bar
in the Variables module.
2.
Define a name for the new variable and then select either
Conditional Variable, Numerical Variable, or Device
Variable from the Variable Type dropdown menu. Click
Add. The Edit Variable window opens and you can
define a value for the device (figure 27).
3.
Click Apply when you have selected or entered a value
for the variable.
The new variable appears in the variables list with other
expressions and variables. To edit or delete a variable, click
on the gear icon. The Edit Variable window opens and
allows for changes before clicking Apply. Clicking Delete
Variable opens a prompt to confirm removing the variable
from the saved items.
Expressions
All expressions can be considered variables, but not all
variables are expressions. Expressions are more complex
elements that you program to use an equation or react to
certain conditions in the desired data point.
There are two possible expressions within FlowVision 2.0™,
Numeric and Conditional. A Numeric Expression has
multiple options such as binary math, unary math, time, and
most things involving numeric values. Each of these options
has further options to define and program the expression
to provide the desired information.
The Conditional Expression provides the option for
creating contingencies. These are contingencies such as
or, and either-or. This allows for creating an expression
that reacts to a specified condition when it is present in an
application. It is very useful when creating a script to dictate
how a device reacts when certain conditions are met.
Figure 27. Edit variable window.

Variables September, 2022 • Rev. 2 • FlowVision 2.0™ user manual 20
Below is one example of the steps for creating an expression
for converting Celsius to Fahrenheit (figure 28). There are
a large number of possibilities with expressions, however,
so if there are any questions, please contact Alicat support
for assistance (page 26).
. Click the green plus sign to the right of the search bar
in Variables.
2.
Define a name for the new variable, select the Numeric
Expression option from the Variable Type dropdown
menu, and click Add. The edit variable window opens
to define a value for the expression.
3.
Enter “DegreesInFahrenheit” for the name and from
the first dropdown menu, set the type to Binary Math.
This creates dropdown menus to select options for the
operands. Think of each box as a set of parentheticals
in a math equation. Everything within the box performs
before moving to the next part of the equation.
4. Select Binary Math again from the second dropdown
menu. The first operand group is the measurement from
an Alicat device in degrees Celsius multiplied by 1.8.
5.
Select Device Measurement from the third drop-down
menu. In the options to the right, select the Device to
be used and the Value to read from. The value in this
example is temperature.
6.
Set the Unit to Default (°C) for Celsius. Then, select
the operator to multiply (x * y) the first group by the
next group. In the second group, set the first option as
a Constant and give it a value of 1.8.
7.
Set the second operator to add (x + y), and set the option
to Constant with a value of 32. The expression now
looks like this:
8.
Click Apply below to save this expression and close the
Edit Variable window. The new expression is displayed
in the Variables module list.
After the expression is complete and found in the Variable
list it can be selected in the logs, charts, or scripts like any
other variable.
Figure 28. Expression variables.
Table of contents
Other Alicat Measuring Instrument manuals