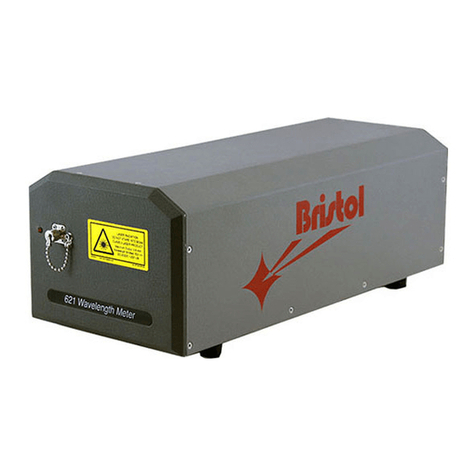
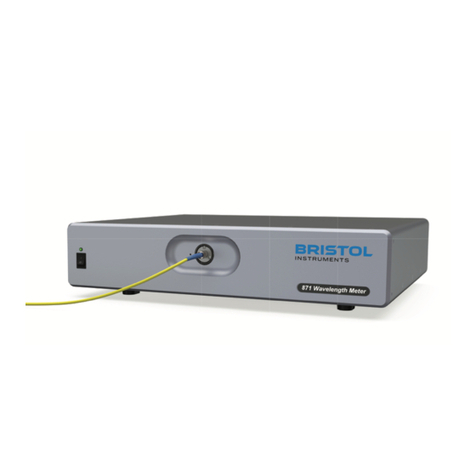
Bristol 428 User manual

MODEL 428
MULTI-WAVELENGTH METER
3/18/16
USER’S MANUAL

The information contained in this publication is subject to change without notice.
2016 Bristol Instruments, Inc.

CONTENTS
1INTRODUCTION.......................................................................................................................4
Welcome....................................................................................................................................4
Safety Notices............................................................................................................................4
General Safety Considerations..................................................................................................5
Inspection ..................................................................................................................................6
2INITIAL INSTRUMENT SETUP ................................................................................................7
General......................................................................................................................................7
Power Supply Connections .......................................................................................................7
Signal Output Connections........................................................................................................8
3OPERATION .............................................................................................................................9
Start Up......................................................................................................................................9
Front Panel................................................................................................................................9
Optical Signal Input .................................................................................................................10
Front Panel Controls................................................................................................................11
Display Screens.......................................................................................................................11
Configuration Screens.............................................................................................................17
4OPTICAL SPECTRUM ANALYZER SOFTWARE.................................................................24
Software Installation ................................................................................................................24
Spectrum Screen.....................................................................................................................25
Function Descriptions..............................................................................................................26
Wavelength Screen .................................................................................................................31
Menu Function Descriptions....................................................................................................31
5REMOTE COMMUNICATIONS ..............................................................................................37
Communications Setup ...........................................................................................................37
SCPI Communications Scheme..............................................................................................40
SCPI Command Detail ............................................................................................................44
APPENDIX A –SPECIFICATIONS...............................................................................................62
APPENDIX B –WARRANTY & SERVICE ...................................................................................63
Warranty..................................................................................................................................63
Service.....................................................................................................................................63
APPENDIX C –CODE UPDATES ................................................................................................64
APPENDIX D –MONITOR PORT.................................................................................................65
APPENDIX E –TROUBLESHOOTING.........................................................................................66
APPENDIX F –SPECTRAL CALCULATION...............................................................................68
Declaration of Conformity...........................................................................................................69

Model 428 User’s Manual INTRODUCTION
Bristol Instruments, Inc. 4
1 INTRODUCTION
Welcome
Thank you for purchasing the 428 Multi-Wavelength Meter from Bristol Instruments. Two different
versions of this system are available, the 428A and the 428B. The 428A measures the absolute
wavelength of CW lasers to an accuracy of ±0.2 parts per million (±0.3 pm at 1550 nm). The
428B has an accuracy of ±0.65 parts per million (±1.0 pm at 1550 nm). The operational
wavelength range of these systems is 1270 –1650 nm (236 –182 THz).
This User’s Manual includes information about the 428A and 428B Multi-Wavelength Meters. It
covers all the topics necessary to help you operate your system.
If you have any questions about the operation of your 428 system, please do not hesitate to call
Bristol Instruments at (585) 924-2620. Or, you can contact us at service@bristol-inst.com.
Bristol Instruments, Inc.
50 Victor Heights Parkway
Victor, NY 14564
Tel: (585) 924-2620
Fax: (585) 924-2623
service@bristol-inst.com
www.bristol-inst.com
Safety Notices
Warning denotes a hazard. It calls attention to a procedure that, if not correctly performed or
adhered to, could result in injury or loss of life. Do not proceed beyond a warning sign until the
indicated conditions are fully understood and met.
Caution denotes a hazard. It calls attention to a procedure that, if not correctly performed or
adhered to, could result in damage to or destruction of the product. Do not proceed beyond a
caution sign until the indicated conditions are fully understood and met.

Model 428 User’s Manual INTRODUCTION
Bristol Instruments, Inc. 5
General Safety Considerations
This product has been designed and tested in accordance with IEC 61010-1 and has
been supplied in a safe condition. The instruction documentation contains information
and warnings that must be followed by the user to ensure safe operation and to maintain
the product in a safe condition.
This instrument is classified as an FDA Class I Laser Product (IEC Laser Class 1).
If this instrument is not used as specified, the protection provided by the
equipment could be impaired. This instrument must be used in the specified mode
without deviation from the written instructions. Use of this product in any manner
other than described herein may cause permanent damage to eyesight and
therefore is strictly prohibited.
Never inspect or clean a fiber-optic cable without first disconnecting the entire
cable assembly from the optical source. Failure to take this precaution can
permanently damage your eyesight.
No user serviceable parts are inside. Refer servicing to Bristol Instruments or its
representatives only. To prevent electrical shock, do not remove covers.
To prevent electrical shock, disconnect this instrument from mains before
cleaning. Use a dry cloth or one slightly dampened with water to clean the
external case parts. Do not attempt to clean internally.
This is a Safety Class 1 product (provided with protective ground). The mains plug
shall only be inserted in a socket outlet provided with a protective ground contact.
Any interruption of the protective conductor inside or outside of the product is
likely to make the product dangerous. Intentional interruption is prohibited.

Model 428 User’s Manual INTRODUCTION
Bristol Instruments, Inc. 6
Always use the three-prong AC power cord supplied with this instrument. Failure to
ensure adequate grounding by not using this cord may cause instrument damage.
Do not connect AC power until you have verified the line voltage is properly grounded
and within the specified range (90–260 VAC and 47–63 Hz). Damage to the instrument
could result.
This instrument has autoranging line voltage input. Be sure the supply voltage is within
the specified range.
Maximum safe input is 65 mW of optical power. Laser input power in excess of 65 mW
can result in damage to the instrument.
Use care in handling fiber-optic connectors. Always clean the fiber end prior to insertion
into the instrument’s fiber-optic connector for optimum performance. Failure to do so can
result in damage to the instrument. To prolong instrument service life, it is advantageous
to attach a new fiber-optic patchcord to the instrument and use its other end for the
connect/disconnect procedure.
Inspection
The 428 Multi-Wavelength Meter is packed in a carton designed to give maximum
protection during shipment. If the outside of the shipping carton is damaged, notify your
shipping department immediately. Your shipping department may want to notify the
carrier.
If the shipping carton is not damaged, carefully remove and identify all of the components
listed below. Contact Bristol Instruments or your local representative if any of the
components are missing. We recommend that you save the shipping carton for future
storage or transportation.
The 428 system includes the following components:
Multi-Wavelength Meter chassis
Power cord (North America and Japan only)
USB 2.0 cable
Rack mount kit
CD with User’s Manual and NuView Display Software

Model 428 User’s Manual INITIAL INSTRUMENT SETUP
Bristol Instruments, Inc. 7
2 INITIAL INSTRUMENT SETUP
General
1 Place the 428 Multi-Wavelength Meter on a firm horizontal surface.
2 Make sure that there is at least 2 inches (50 mm) of clearance on all sides of the
instrument to allow for ventilation.
Power Supply Connections
This is a Safety Class 1 product (provided with protective ground). The mains plug
shall only be inserted in a socket outlet provided with a protective ground contact.
Any interruption of the protective conductor inside or outside of the product is
likely to make the product dangerous. Intentional interruption is prohibited.
Always use the three-prong AC power cord supplied with this instrument. Failure to
ensure adequate grounding by not using this cord may cause instrument damage.
Do not connect AC power until you have verified the line voltage is properly grounded
and within the specified range (90–260 VAC and 47–63 Hz). Damage to the instrument
could result.
This instrument has autoranging line voltage input. Be sure the supply voltage is within
the specified range.
1 Verify that the line power meets the requirements shown below.
95 to 260 VAC
47 to 63 Hz
Protective Ground
2 Connect the line-power cord to the power input connector on the instrument’s back
panel (Figure 2.1).
3 Connect the other end of the line-power cord to the power receptacle.

Model 428 User’s Manual INITIAL INSTRUMENT SETUP
Bristol Instruments, Inc. 8
Figure 2.1: Back Panel
Signal Output Connections
The 428 Multi-Wavelength Meter has the following connections for signal output and
communications. These connections are located on the instrument’s back panel
(Figure 2.1).
USB Port –Interface to a PC for instrument control and data reporting.
Ethernet Port –Interface to a PC or network for instrument control and data reporting.
GPIB (Optional) –Interface to a PC for instrument control and data reporting.
DB-9 Monitor Port –Used to monitor the interference fringe pattern and
instrument timing signals with an oscilloscope. A full description is provided in
Appendix D.
Rack Mount Kit Installation
The 428 Multi-Wavelength Meter can be mounted in a standard 19” instrument rack by
attaching the rack mount brackets. These brackets are attached to the front bezel of the
system using the 8-32 x 5/8” flat head socket screws included in the rack mount kit. For
proper fit, the feet under the chassis may be removed.
Do not reinsert the screws once the feet are removed. Damage to the internal
components of the instrument may result.
When the system is mounted in an enclosed instrument rack, be careful not to block the
fan on the back panel. Adequate ventilation must be provided inside the instrument rack
to prevent overheating.

Model 428 User’s Manual OPERATION
Bristol Instruments, Inc. 9
3 OPERATION
Start Up Turn on the power switch located on the instrument’s front panel. The instrument’s self-
test takes approximately 20 seconds, at which point the model 428B is ready for
operation. The model 428A displays the message “Reference Laser Stabilizing” until the
laser is stabilized. Typical laser warm-up time is about 15 minutes, or less if the
instrument has been used within the past several hours.
Front Panel
The front panel of the model 428 is shown in Figure 3.1. The display reports wavelength,
power, and OSNR in various formats. It also displays configuration information that
defines how data is collected and reported. The buttons control how data is collected and
reported.
Figure 3.1: Front Panel
Power Switch
Turns the system on and off.
Power LED
Shows the power status. When lit (green), the unit is on.
Fiber Input
The optical signal under test enters the system through an FC/UPC or FC/APC
fiber-optic connector.
Display
Reports the measurement data in several formats and shows various
configuration parameters.
Control Buttons
Select and change parameters that affect how data is collected and reported.

Model 428 User’s Manual OPERATION
Bristol Instruments, Inc. 10
Optical Signal Input
Never inspect or clean a fiber-optic cable without first disconnecting the entire
cable assembly from the optical source. Failure to take this precaution can
permanently damage your eyesight.
Use care in handling fiber-optic connectors. Always clean the fiber end prior to insertion
into the instrument’s fiber-optic connector for optimum performance. Failure to do so can
result in damage to the instrument. To prolong instrument service life, it is advantageous
to attach a new fiber-optic patchcord to the instrument and use its other end for the
connect/disconnect procedure.
Maximum safe input is 65 mW of optical power. Laser input power in excess of 65 mW
can result in damage to the instrument.
The optical signal under test enters the 428 system through an FC/UPC or FC/APC fiber-
optic connector on the front panel of the instrument (Figure 3.1).
1 Ensure that all fiber-optic connectors are clean and dry.
2 Connect your fiber-optic patchcord to the pre-aligned FC/UPC or FC/APC fiber-
optic connector on the instrument’s front panel. Make certain that the alignment
key on the fiber-optic patchcord’s connector (Figure 3.2) is properly seated in the
slot of the input connector.
Figure 3.2: Basic Components of an FC/PC Fiber-Optic Connector
3 Tighten the mechanical retainer with a light to medium finger-tightness.
Exceeding this torque may result in a poor connection or may damage the
connector.

Model 428 User’s Manual OPERATION
Bristol Instruments, Inc. 11
Front Panel Controls
Five control buttons on the front panel select and change parameters that affect how data
is collected and reported (Figure 3.1). These control buttons switch between the different
Display and Configuration Screens, and change the value or status of parameters on
each screen. The names and functions of the Control Buttons are listed below (from left
to right).
Mode This button is used to cycle between the different Display and Configuration
Screens: Main, List, and Config. Within Config mode, there are six separate
Configuration Screens that can be accessed using the Change button.
Up () and Down () Arrows
These buttons are primarily used to scroll through a list of wavelength values on
the List Mode Display Screens. Pressing the Arrow buttons will also cycle
through the values or status options for the highlighted parameter if other options
are available.
Change
This button is used to cycle through a highlighted parameter’s values or status options.
Select This button cycles between the user-changeable parameters on the currently
displayed screen.
Display Screens
Two Display screens are used to report measurement data. Pressing the Mode button
cycles between the Main Mode Display Screen, the List Mode Display Screen, and the
Config Mode Display Screen.
Main Mode Display Screen
Displays both wavelength and power, in the chosen units, of either the highest-
power laser channel (Peak), a single chosen laser channel (Chan), or the
weighted average of all wavelengths and powers (FPAv).
1523.4888
-9.93
A v g : O f f
P o f f s : O f f
nm- v a c
d B m
c h 5 o f 8
P e a k
M a i n
M o d e
C h a n g e
S e l e c t
Figure 3.3: Main Mode Display Screen
Wavelength –Displays the measured wavelength (nm), wavenumber (cm-1),
or frequency (THz) of the optical signal under test.

Model 428 User’s Manual OPERATION
Bristol Instruments, Inc. 12
Wavelength Units and Medium –Identifies the units chosen for the
measurement of wavelength (nm), wavenumber (cm-1), or frequency (THz).
Also identifies the medium to which the measurement is referenced. The
options are vacuum (-vac) or standard air (Std Air) at 20°C, 760 mm Hg, and
0% relative humidity. The Wavelength Units and Medium can be changed
from Config Screen 1.
Power –Displays the measured optical power in the user selected units.
Power Units –Identifies the units chosen for the measurement of power.
The options are mW or μW (scaled automatically) or dBm. This parameter
can be changed from Config Screen 1.
Peak/Chan/FPAv –Identifies the channel or measurement method
displayed. Use the Select button to highlight the displayed measurement
method, and the Change or Arrow buttons to cycle through the three options.
–Peak –Displays the wavelength of the highest power channel. The
channel number is given below the wavelength units.
–Chan –Displays the wavelength of a user-selected channel. The
channel number is indicated below the wavelength units, and can be
changed using the Arrow keys.
–FPAv –Displays the power-weighted average wavelength of all peaks
measured. This is useful when the center wavelength of a group of input
lines is desired, such as that of a typical Fabry-Perot laser.
Average (AVG) –The instrument displays the results from each
measurement, or the result from an averaged number of measurements
(2, 4, 8, 16, 32, 64, or 128) chosen in Config Screen 1. The instrument will
display a measurement after the chosen number of interferograms is
collected, averaged, and analyzed. For averages between 2 and 32, the
display will then be updated with each successive measurement. For
averages of 64 or 128, the display will be updated after each block of
interferograms has been averaged.
Use the Select button to highlight the Average value, and the Change or
Arrow buttons to cycle through the averaging states. Off indicates that the
average function is disabled, while a numeric value indicates that an average
is being calculated.
Power Offset (Poffs) –The instrument can adjust the power measurement
to account for an external attenuator by using a Power Offset value equal to
the external attenuation. This is useful if the optical input power would
otherwise exceed the maximum measurable input of 10 mW (10 dBm). The
Power Offset value (1-20 dB) is chosen in the Config Screen 1.
Use the Select button to highlight the Power Offset value, and the Change or
Arrow buttons to adjust the Power Offset state. Off indicates that the Power
Offset is disabled, while a numeric value indicates that the Power Display is
adjusted by the specified Power Offset.

Model 428 User’s Manual OPERATION
Bristol Instruments, Inc. 13
List Mode Display Screen –Main
Displays wavelength, power, and optical signal-to-noise-ratio (OSNR) for up to 5
channels simultaneously. This data can be sorted by wavelength (Wav) or power
(Pow).
1 1 3 1 0 . 6 1 0 7
1 1 . 8 5 3 7 . 2
1 : 0 0 : 0 0
2 1 3 1 0 . 6 2 0 3
1 1 . 0 5 3 1 . 2
3 1 3 1 2 . 1 5 7 0
1 2 . 6 3 3 4 . 7
A v g : O f f
4 1 3 1 3 . 1 6 3 1
1 2 . 0 2 2 8 . 4
P o f f s : O f f
5 1 3 1 4 . 7 0 6 3
9 . 4 4 3 5 . 5
S N R : U s e r
nm- v a c
uW
dB
W a v
L i s t
M o d e
C h a n g e
S e l e c t
Figure 3.4: List Mode Display Screen –Main
Wavelength List –Displays the current wavelength, wavenumber, or
frequency value for up to 5 channels. If the optical signal has more than 5
channels, the Arrow buttons can be used to scroll to any of the up to 1000
computed wavelengths. The scrolling may be done either by line (Smooth) or
by page (Page). The scrolling method is selectable in Config Screen 1.
Wavelength Units and Medium –Identifies the units chosen for the
measurement of wavelength (nm), wavenumber (cm-1), or frequency (THz).
Also identifies the medium to which the measurement is referenced. The
options are vacuum (-vac) or standard air (Std Air) at 20°C, 760 mm Hg, and
0% relative humidity. The Wavelength Units and Medium can be changed
from Config Screen 1.
Power Values List –Displays the measured optical power, in the user
selected units, directly to the right of its corresponding wavelength or
frequency value.
Power Units –Identifies the units chosen for the measurement of power.
The options are mW or μW (scaled automatically) or dBm. This parameter
can be changed from Config Screen 1.
Signal-to-Noise Ratio (SNR) –The OSNR for each channel, expressed in
dB, is displayed directly to the right of its corresponding power value. The
OSNR is calculated as the ratio of the power in the optical channel relative to
either a user selected noise location (User) or relative to the interpolated
noise at the channel location (Auto).The noise at the channel location is
interpolated by calculating the average of the noise measured 100 GHz to
the left and to the right of the peak location. If another channel is less than
200 GHz from the peak, then the noise is calculated midway between the two
channels.
Measurement Timer –Displays the time in hours, minutes, and seconds
that the instrument has been tracking channel values. The timer is reset
when the instrument is restarted, or can be manually restarted with the Reset
option on List Mode Display Screen –Drift.

Model 428 User’s Manual OPERATION
Bristol Instruments, Inc. 14
Average (AVG) –The instrument displays the results from each
measurement, or the result from an averaged number of measurements
(2, 4, 8, 16, 32, 64, or 128) chosen in Config Screen 1. The instrument will
display a measurement after the chosen number of interferograms is
collected, averaged, and analyzed. For averages between 2 and 32, the
display will then be updated with each successive measurement. For
averages of 64 or 128, the display will be updated after each block of
interferograms has been averaged.
Use the Select button to highlight the Average value, and the Change or
Arrow buttons to cycle through the averaging states. Off indicates that the
average function is disabled, while a numeric value indicates that an average
is being calculated.
Power Offset (Poffs) –The instrument can adjust the power measurement
to account for an external attenuator by using a Power Offset value equal to
the external attenuation. This is useful if the optical input power would
otherwise exceed the maximum allowed input of 10 mW (10 dBm). The
Power Offset value (1-20 dB) is chosen in Config Screen 1.
Use the Select button to highlight the Power Offset value, and the Change or
Arrow buttons to adjust the Power Offset state. Off indicates that the Power
Offset is disabled, while a numeric value indicates that the Power Display is
adjusted by the specified Power Offset.
Signal-to-Noise Ratio (SNR) –This indicates how OSNR values are
calculated. Use the Select button to highlight the SNR value, and the Change
or Arrow buttons to adjust the SNR state. OSNR is calculated relative to the
interpolated noise at the channel location (Auto), or at a user selected noise
location (User). The noise location and noise bandwidth are chosen in Config
Screen 3.
Sorting Type –Displays the current sorting type for the list data. Use the
Select button to highlight the Sorting Type value, and the Change button to
cycle through the options (Wav or Pow).
List Mode Display Screen –Drift
Displays each channel’s tracked measurement behavior in a variety of ways. The
different options for display are the difference between each channel’s maximum
and minimum wavelength/power values (Max-Min), each channel’s maximum
wavelength/power values (Max), each channel’s minimum wavelength/power values
(Min), and the difference between each channel’s current wavelength/power values
and the wavelength/power values at the start of the measurement period (Diff). Use
the Select button to highlight the Drift value, and use the Change button to cycle
through the display options.

Model 428 User’s Manual OPERATION
Bristol Instruments, Inc. 15
Max-Min –Displays the difference between the maximum and minimum
values that each channel has recorded. The first column displays the
difference in wavelength, and the second column displays the difference in
power. The third column displays the channel number, current wavelength,
and current power of a chosen channel. Use the Arrow buttons to select a
channel, which is indicated by the tip of the dashed arrow.
1 0 . 0 0 2 4
1 . 1 2
1 : 0 0 : 0 0
2 0 . 0 0 3 7
1 . 2 3
R e s e t
3 0 . 0 0 3 4
0 . 6 6 3 o f 8
A v g : O f f
4 0 . 0 0 3 6
0 . 8 3 1 5 3 9 . 2 9 3 3
P o f f s : O f f
5 0 . 0 0 3 8
0 . 5 8 - 2 1 . 3 1
D r i f t
nm- v a c
d B m
Max- M i n
L i s t
M o d e
C h a n g e
S e l e c t
Figure 3.5: Drift –Max-Min
Max –Displays the maximum value that each channel has recorded. The
first column displays the maximum wavelength values, and the second
column displays the maximum power values. The third column displays the
channel number, current wavelength, and current power of a chosen
channel. Use the Arrow buttons to select a channel, which is indicated by the
tip of the dashed arrow.
1 1 5 3 7 . 0 2 3 0
- 2 0 . 7 6
1 : 0 0 : 0 0
2 1 5 3 8 . 1 5 7 1
- 1 3 . 7 4
R e s e t
3 1 5 3 9 . 2 9 4 6
- 1 5 . 3 8 3 o f 8
A v g : O f f
4 1 5 4 0 . 4 3 3 5
- 1 3 . 3 3 1 5 3 1 . 5 8 7 8
P o f f s : O f f
5 1 5 4 1 . 5 7 5 1
- 9 . 4 2 - 2 1 . 3 1
D r i f t
nm- v a c
d B m
Max
L i s t
M o d e
C h a n g e
S e l e c t
Figure 3.6: Drift –Max
Min –Displays the minimum measurement value that each channel has
recorded. The first column displays the minimum wavelength values, and the
second column displays the minimum power values. The third column
displays the channel number, current wavelength, and current power of a
chosen channel. Use the Arrow buttons to select a channel, which is
indicated by the tip of the dashed arrow.
1 1 5 3 7 . 0 2 3 0
- 2 2 . 7 6
1 : 0 0 : 0 0
2 1 5 3 8 . 1 5 7 1
- 1 5 . 7 4
R e s e t
3 1 5 3 9 . 2 9 4 6
- 2 1 . 3 1 3 o f 8
A v g : O f f
4 1 5 4 0 . 4 3 3 5
- 1 4 . 3 3 1 5 3 1 . 5 8 7 8
P o f f s : O f f
5 1 5 4 1 . 5 7 5 1
-10. 4 2 - 2 1 . 3 1
D r i f t
nm- v a c
d B m
M i n
L i s t
M o d e
C h a n g e
S e l e c t
Figure 3.7: Drift –Min

Model 428 User’s Manual OPERATION
Bristol Instruments, Inc. 16
Diff –Displays the difference between the start measurement and currently
displayed measurement values for each channel. The first column displays
the difference in wavelength, and the second column displays the difference
in power. The third column displays the channel number, current wavelength,
and current power of a chosen channel. Use the Arrow buttons to select a
channel, which is indicated by the tip of the dashed arrow.
1 0 . 0 1 2 4
- 1 . 1 2
1 : 0 0 : 0 0
2 0 . 0 2 3 7
- 1 . 2 3
R e s e t
3 0 . 0 1 3 4
- 0 . 6 6 3 o f 8
A v g : O f f
4 0 . 0 2 3 6
- 0 . 8 3 1 5 3 9 . 2 9 3 3
P o f f s : O f f
5 0 . 0 2 3 8
- 0 . 5 8 - 2 1 . 3 1
D r i f t
nm- v a c
d B m
D i f f
L i s t
M o d e
C h a n g e
S e l e c t
Figure 3.8: Drift –Diff
Measurement Timer –Displays the time in hours, minutes, and seconds
that the instrument has been tracking channel values. The timer is reset
when the instrument is restarted, or can be manually restarted with the Reset
option.
Reset –Restarts the tracking of channel values. Use the Select button to
highlight Reset, and use the Change button to reset the timer.
List Mode Display Screen –Delta
Displays the difference between each channel’s measured wavelength and a
chosen reference channel (Ref) or the wavelength of the nearest 100 GHz ITU
grid line (ITU). Use the Select button to highlight the Delta value, and use the
Change button to cycle through the Delta states.
REF –Displays the difference in wavelength between each channel and the
reference channel (chosen in Config Screen 2). The first column displays the
difference in wavelength values, and the second column displays the current
power values. The third column displays the channel number, current
wavelength, and current power of a chosen channel. Use the Arrow buttons
to select a channel, which is indicated by the tip of the dashed arrow.
1 0 . 0 0 0 0
- 2 0 . 7 6
1 : 0 0 : 0 0
2 1 . 0 5 4 3
- 1 3 . 7 4
R e s e t
3 2 . 0 7 3 8
- 2 1 . 3 1 3 o f 8
A v g : O f f
4 3 . 0 1 6 3
- 1 3 . 3 3 1 5 3 1 . 5 8 7 8
P o f f s : O f f
5 4 . 0 1 3 3
- 9 . 4 2 - 2 1 . 3 1
D e l t a
nm- v a c
d B m
R e f : 1
L i s t
M o d e
C h a n g e
S e l e c t
Figure 3.9: Delta –REF

Model 428 User’s Manual OPERATION
Bristol Instruments, Inc. 17
ITU –Displays the difference in wavelength between each channel and the
nearest 100 GHz-spaced ITU gridlines covering 1528.77 nm to 1563.86 nm.
The first column displays the difference in wavelength values, and the
second column displays the current power values. The third column displays
the channel number, current wavelength, and current power of a chosen
channel. Use the Arrow buttons to select a channel, which is indicated by the
tip of the dashed arrow.
1 - 0 . 0 2 9 6
- 2 1 . 6 7
1 : 0 0 : 0 0
2 - 0 . 0 5 4 3
- 1 4 . 9 5
R e s e t
3 - 0 . 0 7 3 8
- 2 1 . 6 7 3 o f 8
A v g : O f f
4 - 0 . 0 1 6 3
- 1 3 . 6 6 1 5 3 1 . 5 8 7 8
P o f f s : O f f
5 - 0 . 0 1 3 3
- 9 . 5 2 - 2 1 . 6 7
D e l t a
nm- v a c
d B m
I T U
L i s t
M o d e
C h a n g e
S e l e c t
Figure 3.10: Delta –ITU
Configuration Screens
Six Configuration Screens are used to change and report instrument setup details. These
screens are shown in Figures 3.11 to 3.16. To access the Configuration Screens, press
the Mode button until the Config indicator appears in the illuminated status bar, then use
the Change button to select the desired Config Screen.
Configuration Screen 1
Displays and allows changes to parameters that affect how the instrument makes
and displays the wavelength, frequency, and power measurements.
W a v e U n i t s : cm- 1
P o w e r U n i t s : mW
M e d i u m : V a c u u m
P o w e r O f f s e t : 10
A v e r a g e E n : O f f
P o w e r O f f s e t E n : O f f
A v e r a g e s : 4
D i s p B r i g h t n e s s : 6
P o w e r N u l l : n o w
S c r o l l C o n t r o l : S m o o t h
Config: 1
Config
M o d e
C h a n g e
S e l e c t
Figure 3.11: Configuration Screen 1
Wave Units –Identifies the units chosen for the measurement of wavelength
(nm), wavenumber (cm-1), or frequency (THz). Use the Select button to
highlight the Wave Units value, and use the Change or Arrow buttons to set
the desired units.
Medium –Identifies the medium in which the measurement occurs as
vacuum (-vac) or standard air (Std Air) at 20°C, 760 mm Hg, and 0% relative
humidity. Use the Select button to highlight the Medium value, and use the
Change or Arrow buttons to set the desired medium.

Model 428 User’s Manual OPERATION
Bristol Instruments, Inc. 18
Average En –Identifies the status of the Average function. Use the Select
button to highlight the Average En value, and use the Change or Arrow
buttons to turn averaging on or off.
Averages –Determines the number of measurements used for averaging
wavelength and power when the Averaging function is enabled. The choices
are 2, 4, 8, 16, 32, 64, or 128 measurements. Use the Select button to
highlight the Average value, and use the Change or Arrow buttons to set the
desired number.
Power Null –Resets the null value used for the power calculation. Use the
Select button to highlight the Power Null value, and use the Change or Arrow
buttons to activate the Power Null. When activated, the instrument will
display the message “Done.”
NOTE: For best results, use this feature when the fiber connector’s
protective cap is attached, ensuring that stray light does not affect the
baseline power measurement.
Power Units –Identifies the units chosen for the display of the power
measurement. The choices are mW or μW (scaled automatically), or dBm.
Use the Select button to highlight the Power Units value, and use the
Change or Arrow buttons to set the desired units.
Power Offset –Determines the Power Offset value when the Power Offset
function is enabled. The Power Offset options are 1-20 dB. Use the Select
button to highlight the Power Offset value’s left most digit, use the Change or
Arrow buttons to set the desired number, and use the Select button to highlight
the next digit to the right. Repeat to set the second digit.
Power Offset En –Identifies the status of the Power Offset function. Use the
Select button to highlight the Power Offset En value, and use the Change or
Arrow buttons to turn the Power Offset on or off.
Disp Brightness –Determines the brightness of the display on a scale of 1
to 7, with 7 being the brightest. Use the Select button to highlight the Disp
Brightness value, and use the Change or Arrow buttons to increase or
decrease the brightness setting.
Scroll Control –Selects the method of scrolling through optical channels
while in the List Mode display screen. The options are scrolling one line per
Arrow button press (Smooth) or scrolling one page of 5 lines per Arrow
button press (Page). Use the Select button to highlight the Scroll Control
value, and use the Change or Arrow buttons to set the Scroll Control method.

Model 428 User’s Manual OPERATION
Bristol Instruments, Inc. 19
Configuration Screen 2
Displays and allows changes to parameters specifying the conditions for valid
channel recognition.
W a v e L i m i t s : On
s t a r t : 1 2 6 7
e n d : 1 6 0 0
E x c u r s i o n : 1 0 d B
P e a k T h r e s h : 1 0 d B
T h r e s h T y p e : R e l
Def Ref#:
1
Config: 2
Config
M o d e
C h a n g e
S e l e c t
Figure 3.12: Configuration Screen 2
WaveLimits –This parameter limits the wavelength range from which the
instrument will find and display channels. When the WaveLimits are on, the
instrument will display only the channels found between the Start and End
wavelengths. When off, the instrument will display all channels that it finds.
Start –Identifies the lower end of the wavelength range (nm only) of the
WaveLimits parameter. Use the Select button to highlight the Start value’s
left most digit, use the Change or Arrow buttons to set the desired number,
and use the Select button to highlight the next digit to the right. Repeat until
all four digits are set.
End –Identifies the upper end of the wavelength range (nm only) of the
WaveLimits parameter. Use the Select button to highlight the End value’s left
most digit, use the Change or Arrow buttons to set the desired number, and
use the Select button to highlight the next digit to the right. Repeat until all
four digits are set.
Excursion –One of two user-specified criteria for a spectral feature to be
recognized as a valid channel by the instrument. Excursion defines the
minimum distance between the peak and the measurement noise floor on
either side of the peak. This parameter’s options are 1-30 dB, with a default
value of 10 dB. If a different Excursion value is desired, use the Select button
to highlight the Excursion value’s left most digit, use the Change or Arrow
buttons to set the desired number, and use the Select button to highlight the
next digit to the right. Repeat to set the second digit.
PeakThresh –One of two user-specified criteria for a spectral feature to be
recognized as a valid channel by the instrument. PeakThresh defines the
minimum height that a spectral feature must reach to be designated as a
channel. This parameter’s values are 0-40, in units of dB or dBm, with a
default value of 10 dB. If a different threshold value is desired, use the Select
button to highlight the PeakThresh value’s left most digit, use the Change or
Arrow buttons to set the desired number, and use the Select button to
highlight the next digit to the right. Repeat to set the second digit.
ThreshType –Determines whether the peak threshold is relative to the most
intense peak in the optical signal (Rel) or an absolute value from the noise
floor (Abs). Use the Select button to highlight the ThreshType value, and use
the Change or Arrow buttons to set the ThreshType method.

Model 428 User’s Manual OPERATION
Bristol Instruments, Inc. 20
Def Ref # –Identifies the reference channel for the Delta calculation. The
options for the Def Ref # are channels 1-999. Use the Select button to
highlight the Def Ref # value’s left most digit, use the Change or Arrow
buttons to set the desired number, and use the Select button to highlight the
next digit to the right. Repeat to set the second digit.
Configuration Screen 3
Displays and allows changes to the parameters that specify how the Optical
Signal-to-Noise Ratio (OSNR) is computed.
S N R A u t o : O n
S N R U s e r : 1 4 7 0 n m
S N R B W : 0 . 1 0 n m
Config: 3
Config
M o d e
C h a n g e
S e l e c t
Figure 3.13: Configuration Screen 3
SNRAuto –The OSNR is calculated as the ratio of the power in the optical
channel, either relative to the interpolated noise at the channel location (On),
or relative to a user selected noise location (Off). The noise at the channel
location is interpolated by calculating the average of the noise floor, measured
100 GHz to the left and to the right of the peak location. If another channel is
less than 200 GHz from the peak of interest, then the noise is calculated at
the midpoint between the two channels.
Use the Select button to highlight the SNRAuto value, and use the Change or
Arrow buttons to change the SNRAuto status on or off.
SNRUser –Identifies the wavelength, in nanometers, where the noise is
measured for use in the OSNR calculation if SNRAuto is off. Use the Select
button to highlight the SNRUser value’s left most digit, use the Change or
Arrow buttons to set the desired number, and use the Select button to
highlight the next digit to the right. Repeat until all four digits are set.
SNRBW –Identifies the noise bandwidth used in the ONSR calculation if
SNRAuto is off. When SNRAuto is on, the noise bandwidth is 0.10 nm. Use
the Select button to highlight the SNRBW value’s left most digit, use the
Change or Arrow buttons to set the desired number, and use the Select
button to highlight the next digit to the right. Repeat until all four digits are
set.
Table of contents
Other Bristol Measuring Instrument manuals
Popular Measuring Instrument manuals by other brands

Schweitzer Engineering Laboratories
Schweitzer Engineering Laboratories SEL-734 quick start guide

BRONKHORST
BRONKHORST EL-FLOW Select Series Quick installation guide

Konexx
Konexx USB Phone 2 PC manual

Edsyn
Edsyn LONER ATMOSCOPE 971HAe instructions

National Instruments
National Instruments InsightCM quick start

Balmac
Balmac 205ce Operation manual