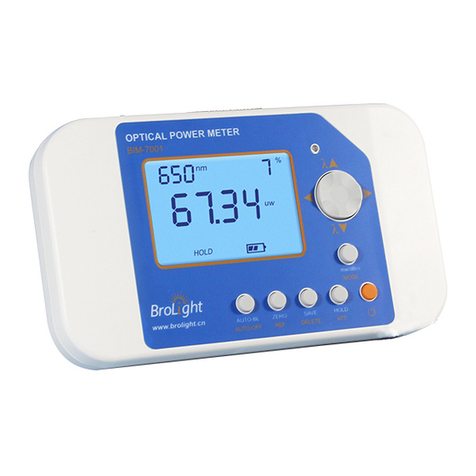
Brolight BIM-76 Series User manual

WIRELESS POWER METER
无线功率计
User Manual

WIRELESS POWER METER
User Manual
Hangzhou Brolight Technology Co., Ltd.
Ver. :
B
Date :
2018,1,29

Content
1 Introduction ....................................................................................................2
2 Function .......................................................................................................... 3
3 Operation Instructions....................................................................................6
3.1 Supported Software Version........................................................................6
3.2 Windows PC(Bluetooth & USB)....................................................................6
3.2.1 System Requirement.................................................................................6
3.2.2 Installation step ........................................................................................6
3.2.3 Connecting ................................................................................................6
3.2.4 Function Operation...................................................................................9
3.3 IOS APP(Bluetooth) .................................................................................... 18
3.3.1 System Minimum requirements .............................................................18
3.3.2 Installation steps..................................................................................... 18
3.3.3 APP Function Operation..........................................................................19
4 Typical Applications .....................................................................................27
4.1 Absolute Power Measurement.................................................................. 27
4.2 Relative Power Measurement ...................................................................28
5 Detector instructions ....................................................................................30
5.1 Calibration Service ..................................................................................... 30
5.2 Uniformity..................................................................................................30
5.3 Clearness....................................................................................................30
5.4 Temperature and Humidity ....................................................................... 30
6 Appendix ....................................................................................................... 31
6.1 Technical Datasheet...................................................................................31

DOCID#: CD-M-BIM-76XX-B
U S E R M A N U A L
- 2 -
1. Introduction
This manual is for BIM-76 Series optical power meter
Thank you for purchasing
hank you for purchasing Brolight high performance optical power meter This power meter can
connect with devices equipped with Windows or IOS system by USB or Bluetooth
Agreement
The “Photodetector” mentioned in this manual (if not specified) implies the BIM-76 Series optical power
meter
Purpose
The purpose of the manual is to help users to get familiar and operate this power meter correctly.
Chapter 1
T

DOCID#: CD-M-BIM-76XX-B
U S E R M A N U A L
- 3 -
2. Function Unit
Technical Features
Features
Absolute measurement with laser beams power up to 250W
Large spectral response range(UV-MIR)
5s rising time
EEPROM store Calibration Data
Bluetooth/USB data module for remote control
Figure 1. Front View of Detector Unit
Chapter 2

DOCID#: CD-M-BIM-76XX-B
U S E R M A N U A L
- 4 -
Figure 2. Side View of detector unit
Figure 3. Detecting Window

DOCID#: CD-M-BIM-76XX-B
U S E R M A N U A L
- 5 -
Serial No.
Function Description
(1)
Power Switch
(2)
Power Light (Red)
(3)
USB, connecting with computer
(4)
USB Light (Green)
(5)
Bluetooth External Antennae
(6)
Bluetooth Light(Blue)
(7)
Analog Signal Output: 0-5v
(8)
External Triggering, Rising Edge
(9)
PWM output, frequency:1Hz-100KHz,Step change
1Hz duty cycle: 0.1%-99.9%, step change 0.1%, high level 3.3V
(10)
12V power adapter interface, Power for the fan and Bluetooth/USB data module
(11)
Heat Sink
(12)
70,mm×70mm Fan
(13)
Thermopile power sensor
Bluetooth
The Bluetooth external antenna is for extending the transmission distance up to 8 meters. It is able to
disassemble, but not recommend to take it off because of losing. Please make sure the antenna has
been well installed before Bluetooth communication.
Power Supply
12V power supply plug for the fan and the entire device. Note: for accurate result, external 12V should be
connected, such that the fan works well for cooling .

DOCID#: CD-M-BIM-76XX-B
U S E R M A N U A L
- 6 -
3. OperationGuides
3.1Supported Software Version
(1) Remote control is available for PC Windows user. This can be achieved by the Bluetooth or USB2.0
communications
(2) IOS devices (e.g. iPad, iPhone) can also remotely control the power meter by Bluetooth.
3.2 Windows PC (Bluetooth & USB)
3.2.1 Minimum system requirements
CPU: >1.6GHz
RAM: 1GB
Hard Disk Space: 100GB
Operating System:Win XP, 7, 8
Display Resolution:>1024*768
CD-ROM
USB 2.0 or higher
3.2.2 Installation
(1) Read the CD with BPM softwares
(2) Install power meter driver:
a. BIM-7001 power meter: Run “Brolight BIM7001 USB Drivers.exe”;
b. BIM-76XX power meter: Run “Brolight BIM76XX USB Drivers.exe”.
(3) Install application program: Run “BPM_Install_V2.0.4.exe”.
Note: For Bluetooth communication, please make sure that the Bluetooth driver has been already installed
successfully. If the Bluetooth connection is failed, please contact Bluetooth supplier for the driver
installation.
3.2.3 Connection
(1) USB Connection
The wireless power meter can connect to the computer by USB cable. Open the Power Meter
Software BPM or click the [Select devices] button or the icon in the Setup Pane to pop up the Device
Manager window, as shown in Figure 4.
Chapter 3

DOCID#: CD-M-BIM-76XX-B
U S E R M A N U A L
- 7 -
Figure 4. Device Manager page
The leftmost window lists out the detected devices, the middle window shows the selected devices,
and the rightmost window is the information of the selected device.
【Add】button
Select a device in the Available Devices window on the far left and click the Add button, the power
meter would be automatically added to the Selected Devices window, and the measurement channel
is created.
【Remove】button
As a device in the Selected Devices window is selected, then click the Remove button, the selected
device moves back to the Available Devices window.
(2) Bluetooth connection
For Bluetooth communication, please check【Search wireless devices】as shown in Figure 4,
Bluetooth devices would be found out automatically.
Before adding a Bluetooth device, make sure that your computer’s Bluetooth functions well. The
procedure for Bluetooth connection may not be the same in different operation systems or different
Bluetooth manufacturers. Here is an example for WIN7 operation system:
On the taskbar in the lower right corner of the computer screen, right-click the Bluetooth icon and
choose Add Device. As the wireless power meter is detected, a device with BIM-7XXX-XXXX would be
shown as Figure 5:

DOCID#: CD-M-BIM-76XX-B
U S E R M A N U A L
- 8 -
Figure 5. Searching Device
Figure 6. Connecting Device successfully

DOCID#: CD-M-BIM-76XX-B
U S E R M A N U A L
- 9 -
3.2.4 Function Operation
(1)BPM Software Structure
Double-click the icon on desktop to invoke the BPM software as shown in Figure 7.
Figure 7. BPM main page
(2) Setup Pane
Figure 8 .Measurement Setup
Name
Description
Add device button (Invoking device manager page)
Start measurement button

DOCID#: CD-M-BIM-76XX-B
U S E R M A N U A L
- 10 -
Pause measurement button
End measurement button
Wavelength(nm)
Center wavelength of the light source, nm
Sampling(Hz)
Sampling frequency, Unit Hz
ATT
OUT: not using attenuator, IN: using attenuator
Range
Optical power range, use mouse to select the range or type-in
manually
Average
Averaging the data and show in the analysis page
NONE: Averaging all data
11sec, 3sec, 10sec, 30sec: Averaging the data collected in 1, 3, 10,
30sec respectively
Offset
Set power offset
Tick for activating the offset ,
Click this to set the current value as the offset
Scale factor
Factor for multiplying the measured values to show as the results
dBm
Use dBm as the unit or not
dB offset
Use dBm as the offset unit. The power offset is invalid once this dB
offset is applied
Trigger mode
Default setting is normal. External trigger mode can be selected,
please see below for the details
Zero
Set zero. Click this to take a measurement under no light
environment , the reading would be set as zero
Logging
Control data logging running or stop
Stop Condition
Condition to stop data logging:
Manual: Stop manually
TimeOut: set timer to stop the data logging
Duration
Set measurement Duration
Trigger Mode
External trigger can adapt TTL with 5V maximum. While the wireless power meter is operating in this mode,
it is stand-by until receiving the first rising edge of the external trigger signal, then power meter starts to
collect data once getting another rising edges of external trigger signal.
Zero
Before measurement, “set zero”function should be used for removing the background noise within the
detector and instrument. This can minimize the influence of background noise to the result.
Shield the detector window such that it is completely in the darkness
Click button to set zero
Take measurement
(3) Spectrum Pane

DOCID#: CD-M-BIM-76XX-B
U S E R M A N U A L
- 11 -
Figure 9. Power spectrum
Real-time graph displays the spectrum when the spectrometer is running, X-axis for the time, Y-axis
for the power.
Setting Spectrum Pane:
Adjust Y-axis range:
Put cursor on the Y-axis until appearing an icon, scroll the mouse wheel, or press the left button
and drag the cursor up or down to adjust the Y-axis range. Alternatively, the range can be selected
in the setup pane.
Adjust X-axis range:
Put cursor on the X-axis until appearing an icon, scroll the mouse wheel, or press the left button
and drag the cursor up or down to adjust the X-axis range. Alternatively, the range can be also
changed by putting the value in Time Frame.
Move pane:
Put the cursor to the pane, press right button, move anywhere wanted.
Zoom-in/Zoom-out
Put the cursor to the spectrum, scroll the mouse wheel.

DOCID#: CD-M-BIM-76XX-B
U S E R M A N U A L
- 12 -
(4) Power display area
Firgure 10. Real-time value display
Click here to display the readings on different detectors.
(5) Statistical Analysis Pane
Figure 11. Real-time Displace
Display in this area: Minimum, Maximum, Average, Standard Deviation, Over range, and PTP
(6) Plot setting Pane
Figure 12.Plot setting
Time Frame:Click the corresponding slot and adjust the value by the arrows
Merge:Merge the spectra collected by different detectors
Split:Split the spectra collected by different detectors into different panes
Reset:Reset the setting

DOCID#: CD-M-BIM-76XX-B
U S E R M A N U A L
- 13 -
Figure 13. Merge and Split the spectra
(7) Import data
File -> Import Data, select the file to be imported, and click "Open". A log view would be seen and then
click the close button to close the log view window.
Figure 14. Choose the imported file

DOCID#: CD-M-BIM-76XX-B
U S E R M A N U A L
- 14 -
Figure 15. import the log file
(8) Export Data
File -> Export Data, input file name, then Save.
Figure 16. Indicate the path and name of log file

DOCID#: CD-M-BIM-76XX-B
U S E R M A N U A L
- 15 -
(9) Preferences
Option -> Preferences
Figure 17.User Preferences Dialog Box(StartUp)
Startup page: The following actions can be set as the program starts
Restart devices on application start up
Show select devices dialog
Open all devices
Open last configuration
Figure 18. User Preferences Dialog Box (Logging)

DOCID#: CD-M-BIM-76XX-B
U S E R M A N U A L
- 16 -
Logging page:Set the export data format
Two formats can be chosen:
Standard format (HH:MM:SS)as Figure 19
Excel friendly format as Figure 20
Default: setting the path for saving data.
Figure 19. Portion of a 2-channel log file in NotePad
Figure 20.Opening Log Files in Excel

DOCID#: CD-M-BIM-76XX-B
U S E R M A N U A L
- 17 -
(10) PWM Output
Output frequency: 1Hz-100KHz,step:1Hz; Duty Cycle: 0.1%-99.9%,Step 0.1%,Maximum output 3.3V。
【Option 】-> 【PWM 】,frequency and duty ratio can be set Click 【Start 】, “Set PWM
successfully!”would be observed,PWM output would provide according to the setting.
【Stop】: Stop the PWM output.
Figure 21. PWM Setting
(11) Analog Output
This power meter has analog output which provides real-time value for close-loop monitoring.
The output range can be controlled by setting the maximum and minimum values.
The minimum and maximum powers can be set to have the interested power range
The analog output voltage and power have linear relationship. Please check the product manual for the
voltage output range of the power meter.
For example, the minimum and maximum power are set 4.5W and 45W respectively, the minimum
and maximum value of analog signal output would be 0.45V and 4.5V. If the power is 30W, the
analog voltage output would be 3V.
Note: For having accurate analog signal output, the maximum output voltage should not be set
greater than 4.8V.

DOCID#: CD-M-BIM-76XX-B
U S E R M A N U A L
- 18 -
【Option】【Analog output】:
Figure 22. Analog output
3.3 IOS APP operation
3.3.1 Minimum requirement for the system:
CPU: >1GHz
RAM: 512MB
Hard disc: 16GB
Operation System: IOS7.1 or above
Display resolution>1024*768
Bluetooth
3.3.2 Installation procedure
(1)Install iTools.
(2)Connect iPad or iPhone to PC, open iTools.
(3)Add “BPM-ipad_V1.0.2”in the application page.
(4)Turn on the iPad or iPhone WiFi and Bluetooth, then "Settings" → "General" → "description
file" → "DATACUBE SCIENTIFIC LTD", click ‘Trust’, the installation is complete.
Table of contents
Other Brolight Measuring Instrument manuals