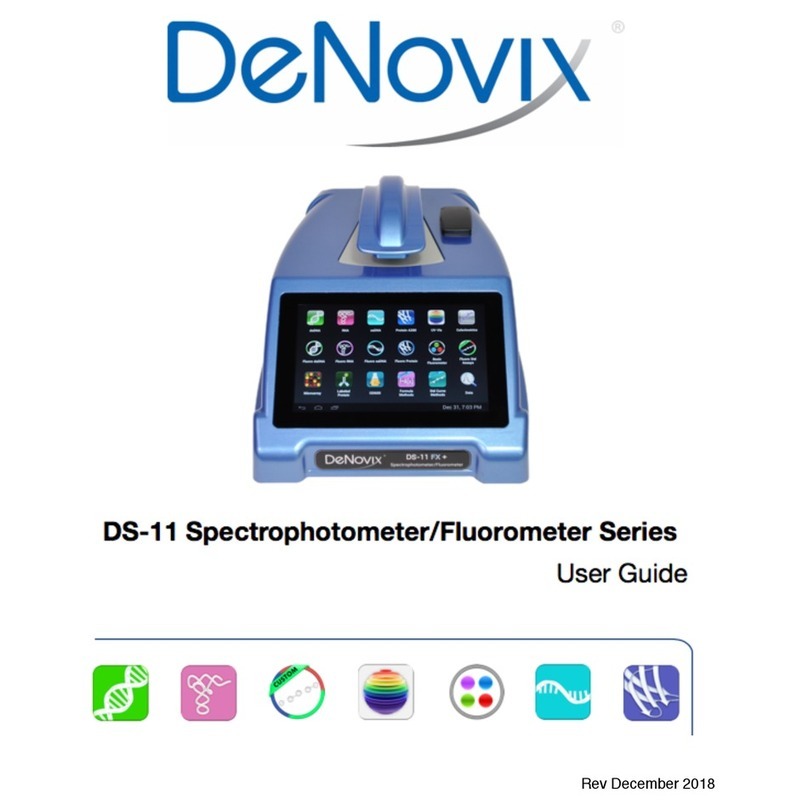
DeNovix DS-11 Series User manual

DS-11 Spectrophotometer
User Guide
Rev June 2013

Table of Contents!
...................................................................................................Introduction 4
.................................................................................Installation and Safety 5
............................................................................................Basic Operation 6
................................................................................Software Quick Guides 8
.........................................................................................Software Icons 8
.....................................................................................Software Buttons 9
..............................................................................Software Navigation 10
..................................................................Tab and Overflow Functions 11
...........................................................................General Screen Features 12
...........................................................................................Run Screen 12
.......................................................................................Report Screen 13
........................................................................................Graph Screen 14
.......................................................................................Nucleic Acid Apps 15
...................................................................................................dsDNA 16
.......................................................................................................RNA 17
...................................................................................................ssDNA 18
.............................................................................................Microarray 19
...............................................................................................Protein Apps 23
..........................................................................................Protein A280 24
...................................................................................Labeled Proteins 26
..........................................................................Colorimetric Applications 29
.....................................................................................Standard Curve 30
.......................................................................................................BCA 32
.................................................................................................Bradford 32
....................................................................................................Lowry 32
.............................................................................................Pierce 660 32
2

...........................................................................................................UV/Vis 33
.........................................................................................................OD 600 35
........................................................................................................Kinetics 37
..............................................................................................User Methods 40
.....................................................................Custom Formula Methods 41
......................................................................Standard Curve Methods 43
.......................................................................Screen Capture and Export 45
..................................................................................................Utility Apps 47
...............................................................................................Accounts 47
.......................................................................................................Data 49
.................................................................................................Settings 50
..................................................................................................Updater 50
..................................................................................................Updater 51
.............................................................................................Lab Tool Apps 52
............................................................................................Calculators 52
.....................................................................................................Timer 53
................................................................................................Maintenance 54
................................................................................................Cleaning 54
.............................................................Troubleshooting and Diagnostics 56
.............................................................................................Quick Help 56
................................................................................................Software 57
................................................................Printer and Barcode Scanner 57
..................................................................................DS-11 Self Check 58
.....................................................Microvolume Pathlength Verification 59
.......................................................Verification Check Troubleshooting 61
......................................................................................Customer Support 62
..................................................................................................Contact 62
Table of Contents
3

1. Introduction
Product Technology
The DeNovix DS-11 Spectrophotometer is a compact instrument with an
integrated processor and a high-resolution touchscreen. The software utilizes
application specific icons along with the Android operating system to provide an
intuitive, easy-to-use spectrophotometer for microvolume absorbance
measurements.
The SmartPath™ technology automatically adjusts the microvolume mode
pathlengths to enable measurements of samples with absorbances that range
between 0.04 to 500 AU (1 cm pathlength equivalent).
The preconfigured applications make it easy to determine the concentration of
nucleic acids and proteins. The UV/Vis application is used when measuring other
types of molecules in solution. New user methods are quick and simple to create,
use and manage.
The DS-11+model also enables cuvette-based measurements for low
concentration samples and basic kinetic studies.
Key Features include:
•Integrated Processor and Hi-Def 7 inch Touchscreen
•Custom Android™ Control Interface
•Simple, Intuitive Apps
•Microvolume and Cuvette Measurements
•Full Spectrum Analysis
•Broadest Concentration Range
4

2. Installation and Safety
1. Remove all packing materials including the screen cover and the black rubber
cap protecting the post located midway on the instrument arm.
2. Plug in the unit to a 110/120V 50Hz/60Hz receptacle.
3. Turn on rear power switch located in the back of the instrument. The Android
based operating system will boot up in less than a minute.
Cautions
DO NOT REMOVE COVER
No operator serviceable components inside. Refer servicing to
qualified personnel.
The DS-11 is designed for indoor use under the following
conditions:
Temperature: 15˚ to 35˚ C
Humidity: 35-65 %
Use only the power supply provided with the instrument. Use of the
instrument in any manner not specified by the manufacturer may
impair the protection provided by the supplied power cord and
power supply.
5

3. Basic Operation
Microvolume Measurements
1. Ensure both top and bottom sample surfaces are clean.
2. Pipette 1 μl of the blank solution onto the lower sample surface. Lower the
top arm and tap the Blank button.
3. Remove the solution from both the bottom and top sample surfaces using a
clean, dry lab wipe.
4. Pipette 1 μl of the sample solution onto the lower sample surface.
5. Lower the to arm and tap the Measure button.
AutoRun Measurements
1. Select the Auto checkbox on the app Run screen. Pipette 1 μl of the sample
solution onto the lower sample surface.
2. Lower the arm for automatic measurements. Unselect the feature to
perform new Blank measurements.
Cuvette Measurements
1. Insert a cuvette pre-filled with the Blank solution. Tap the Blank button.
2. Insert a cuvette pre-filled with the sample solution. Tap the Measure button.
•Use UV transparent cuvettes with Z heights of 8.5 mm.
•Use the light path arrow as a guide when inserting a cuvette
6

Sample Measurement Modes
•The measurement mode is displayed on the top bar of all measurement
applications.
•All measurements are reported in 10 mm equivalent absorbance values.
•The Microvolume mode uses 1.0 μL samples pipetted onto the sample
surface.
•The microvolume Short Path mode uses 0.5 μL samples. The 0.5 mm path is
not used when the Short Path mode is selected.
•The cuvette mode enables the use of 10, 5, 2 and 1 mm path cuvettes.
•A new blank measurement must be made when the mode is changed between
sample measurements.
Measurement Sessions
•New measurement sessions begin each time the application is accessed from
a closed state or when the account is changed while the application is open.
•In addition, new sessions automatically when the number of sample records
in the report exceeds 9999.
Basic Operation
7

4. Software Quick Guides
Software Icons
The Overflow icon is used to access secondary features and selections.
The Select All icon is used to highlight all samples in a list.
Use the Undo icon to restore the most recent edit or delete in tables and
lists.
Modify input fields by first tapping the table or list cell and then tapping
the Edit icon.
Highlighted fields in a table or list can be deleted by tapping the Delete
icon. This icon is also used to cancel an action on a pop-up message
box.
Highlighted sample records in a Report screen table may be exported
using the Share icon as described in the chapter entitled “Export/Print”.
The Checkmark icon is used to save information to a list or approve an
action on a pop-up message box.
The Search icon is used to filter for specific information in the Data
applications.
The Lock icon is used in the Colorimetrics app to indicate an imported
save curve is not in an editable state.
8

Software Buttons
Software Quick Guides
9
Blank
The Blank button function is used to establish a reference
absorbance within each measurement app. The absorbance
graph will not display a spectrum for a blank measurement.
Measure
The Measure button is used to take sample absorbance
measurements. It is deactivated until at least one Blank
measurement is complete. When changing measurement
modes (i.e from microvolume to cuvette), the Measure
button will be deactivated until a new Blank is complete.
Drop-down Menus
Fields with drop-down menus are indicated by the black
triangle located on the bottom right.
Input Fields
Fields with black underlines are editable by the user.
Tapping on the field will enable a keyboard, a numeric
keypad or a dialog box.
Accept
The Accept button found in the lower right of some screens
is used to accept a change in a setting or to include
selections to a list.
Stop
The Stop button replaces the Measure button Kinetics app
during the measurement. It is used to stop a Kinetics run.

Software Navigation
Home Screen Apps
Applications are launched using Home screen icons.
Swipe the Home page to the left for additional icons.
Up and Back Button
The bottom bar Back button is generally used to
navigate to the main level of the current app. If
accessed from the main level of an app, the button will
bring up an Exit app dialog box.
Home Button
The bottom bar Home button is used to navigate to
Home screen.
Recents Button
The bottom bar Recents button is used to as a means
of displaying recently used apps. Swiping an app to the
left from the "Recents" lists will close the app.
Collapse Button
The bottom bar Collapse button is used in place of the
Up and Back button whenever a soft keyboard is
enabled. Use this button to dismiss the keyboard.
Top Level Screens
The Application Run Screen, Report and Graph Screens
are accessed either by the tabs on the top bar or by
swiping the screens left to right. Swipe outside of
graph view to move between screens.
Lists/ Selections
Application specific lists can be accessed using the
Edit List selection found at the bottom of most drop-
down menus. Examples include the Dye, Sample Type
and the Colorimetrics Standard Curve lists.
Software Quick Guides
10

Tab and Overflow Functions
Mode
Application specific measurement mode selections are
available from the Run, Report and Graph screens.
Account
The selection of a specific account for defined app
settings and data segregation is available from the Run,
Report and Graph screens.
Screen
Capture
A .jpg of the current screen of the current page may be
emailed, saved to a USB device or printed to a DeNovix
accessory printer.
Export
Selected
Samples
A .csv file of selected sample data may be emailed,
saved to a USB device or printed to a DeNovix accessory
printer.
Clear
Samples
This function deletes all sample records form the Report
and Graph screens and resets the sample number to 0.
User Guide
The User Guide may be accessed either by using the
Overflow icon on top level screens.
About
The About selection is used to find the current app
version number. The latest app versions are available at
www.denovix.com.
Exit
Use the Exit function to close an application. When the
application is reopened, the software will open under the
General Account and reset the sample number to 0.
Software Quick Guides
11

5. General Screen Features
Run Screen
•Blank, Measure and Auto: Use these buttons to perform Blank and Sample
measurements. Tap the Auto box to enable automatic measurement upon
lowering the arm.
•Sample Name and Sample Number: Tap the input box to enable a keyboard. A
DeNovix approved barcode scanner may be used to enter sample names.
•Sample Type and Factor Fields: Displays current sample type and associated
factors used for concentration calculations. The fields may be fixed or
selectable depending on the application.
•Absorbance Graph: The spectral plot displays data for the current sample
normalized to a 10 mm path for microvolume measurements. Pinch and zoom
anywhere in the graph to rescale the X or Y-axis.
•Results Fields: Displays key results specific to each application.
12

Report Screen
•Tap a record to highlight and select a record for export. More than one sample
may be highlighted.
•All highlighted sample records will be cleared from both the Report and Graph
screens if the Delete icon is used.
•Tap a sample name and then tap the Edit icon to add or modify a sample
name. The change will be applied to the Report, Graph and Data app records.
•Highlighted sample data may be exported or printed using the Overflow
Screen Capture or Export functions.
•The Android share icon is also available as a shortcut option to export
selected data via email or USB. Additional information is provided in the
chapter entitled Print/Export.
•The Report screen list will include application specific data fields for each
sample measured in the current measurement session.
•All current and previous data may be accessed and exported using the Data
app.
General Screen Features
13

Graph Screen
•Tap a record to highlight and display the sample absorbance spectrum on the
graph. More than one sample spectrum may be added to the graph.
•Tap a sample name and then tap the Edit icon to add or modify a sample
name. The change will be applied to the Report, Graph and Data app records.
•All highlighted sample records will be cleared from both the Report and Graph
screens if the Delete icon is used. The data is not deleted from the Database.
•Color blocks are used as a legend convention.
•Highlighted sample data may be exported or printed using the Overflow
Screen Capture or Export functions. Additional information is provided in the
chapter entitled Print/Export.
General Screen Features
14

6. Nucleic Acid Apps
Quick Protocol
1. Launch the appropriate application from the Home screen.
2. Establish a Blank using the appropriate buffer.
3. Enter a sample name.
4. Select a sample type.
•Enter optional user-defined factor (ssDNA and Microarray)
•Select a dye type (Microarray only)
5. Measure a fresh aliquot of sample using the Measure button.
•Blank with TE if the sample is dissolved in TE.
•Ensure that the sample isolation procedure is optimized and that samples are
purified prior to making absorbance measurements.
•Ensure all solutions are homogenous and well-mixed prior to sampling.
•Use fresh aliquots for each microvolume measurement.
15
dsDNA
RNA
ssDNA
Microarray

dsDNA
The dsDNA application is used to quantify samples based upon absorbance
values at 260 nm.
Screen Features
•Sample Type: The sample type selection of dsDNA is preselected for this
application.
•Factor: The wavelength-dependent extinction coefficient factor of 50 is
preselected for this application.
•Concentration Results: Concentration results are reported in units of ng/μl.
•A260: Reports the baseline-corrected 260 nm absorbance value.
•260/230: Displays the ratio of the 260 nm and 230 nm absorbance values.
•260/280: Displays the ratio of the 260 nm and 280 nm absorbance values.
Baseline Correction Options
•340 nm - default selection
•None
•User Defined between 300 and 340 nm
Nucleic Acid
16

RNA
The RNA application is used to quantify samples based upon absorbance values
at 260 nm.
Screen Features
•Sample Type: The sample type selection of RNA is preselected for this
application.
•Factor: The wavelength-dependent extinction coefficient factor of 40 is
preselected for this application.
•Concentration Results: Concentration results are reported in units of ng/μl.
•A260: Reports the baseline-corrected 260 nm absorbance value.
•260/230: Displays the ratio of the 260 nm and 230 nm absorbance values.
•260/280: Displays the ratio of the 260 nm and 280 nm absorbance values.
Baseline Correction Options
•340 nm -default selection
•None
•User Defined between 300 and 340 nm
Nucleic Acid
17

ssDNA
The ssDNA application is used to quantify samples based upon absorbance
values at 260 nm.
Screen Features
•Sample Type: The sample type selection of ssDNA is the default option for
this application.
• A Factor Input option is also available from the selector field.
•Factor: The wavelength-dependent extinction coefficient factor of 33 is the
default selection for this application.
•Concentration Results: Concentration results are reported in units of ng/μl.
•A260: Reports the baseline-corrected 260 nm absorbance value.
•260/230: Displays the ratio of the 260 nm and 230 nm absorbance values.
•260/280: Displays the ratio of the 260 nm and 280 nm absorbance values.
Baseline Correction Options
•340 nm -default selection
•None
•User Defined between 300 and 340 nm
Nucleic Acid
18

Microarray
The Microarray application is used to quantify nucleic acid samples based upon
absorbance values at 260 nm and dyes based upon dye specific analysis
wavelengths.
Screen Features
•Sample Type: The sample type selection of ssDNA is the default option for
this application. Additional options include:
• ssDNA (Factor = 33 for nucleic acid concentration calculation.)
• RNA (Factor = 40 for nucleic acid concentration calculation.)
• Factor Input to enable a user-defined nucleic acid factor.
•Dye Type: Cy3 is default selection for this application.
•Nucleic Acid Concentration Results: Concentration results are reported in
units of ng/μl.
•Dye/Fluorophore Concentration Results: Concentration results are reported
in units of μM.
•A260*: Reports the baseline and dye corrected 260 nm absorbance value.
•AXXX: The baseline-corrected dye specific analysis wavelength absorbance
value.
Nucleic Acid
19

Baseline Correction
The software anchors the visual spectrum display to the baseline at 750 nm for all
measurements and automatically calculates a sloping baseline between 400 nm
and 750 nm for dye concentration calculations.
Dye List
There are 12 preconfigured dye types in available for both the Microarray and
Labeled Proteins applications. The Add New option in the drop-down list enables
the user to save additional dyes to the list.
Dyes saved to the list are accessible for both the Microarray and Labeled Proteins
applications. The new dyes may be used by all accounts, including the General
Account. The user added dyes may only be edited or deleted by the account holder
or an administrator account holder.
The following information is required in order to save a new dye to the list:
•Dye name
•Analysis wavelength
•Analysis wavelength specific extinction coefficient (M -1 cm-1)
•260 nm absorbance correction factor
•280 nm absorbance correction factor
Nucleic Acid
20
Other manuals for DS-11 Series
1
Table of contents
Other DeNovix Measuring Instrument manuals
Popular Measuring Instrument manuals by other brands

Siemens
Siemens ULTRAMAT 23 operating instructions
Gossen MetraWatt
Gossen MetraWatt PROFISIX instruction manual
AIDETEK
AIDETEK DM4070 Operation manual
Absolute Process Instruments
Absolute Process Instruments API 4003 G I quick start guide
Sierra Wireless
Sierra Wireless AirPrime HL Series Customer Process Guidelines
PRECISION DIGITAL
PRECISION DIGITAL Loop Leader PD6620 Series instruction manual
