DeNovix DS-11 Series User manual

Rev December 2018

Table of Contents
1. Introduction 5..............................................................................................
2. Set up and Safety 6.....................................................................................
3. Software Quick Guides 8............................................................................
Software Icons 8.......................................................................................
Software Buttons 9.....................................................................................
Software Navigation 10..............................................................................
Top Bar Overflow Functions 11...................................................................
4. Report and Graph Screens 12....................................................................
5. Absorbance Apps: Basic Operation 15....................................................
Typical Absorbance Run Screen 17...........................................................
Best Practices Absorbance Measurements 19...........................................
6. Absorbance Nucleic Acid Apps 20............................................................
dsDNA, RNA and ssDNA 21......................................................................
Microarray 22..............................................................................................
7. Absorbance Purified Protein, Peptide Apps 28........................................
Protein A280 29..........................................................................................
Labeled Proteins 31....................................................................................
Peptides 33................................................................................................
8. Absorbance Colorimetrics App 36............................................................
Generating a Standard Curve 37...............................................................
BCA 40
Bradford 40
Lowry 40
Pierce 660 40.............................................................................................
9. Absorbance UV-Vis App 41........................................................................
10. Absorbance OD 600 App 43......................................................................
2

11. Absorbance Kinetics App 45.....................................................................
12. Absorbance Custom Methods Apps 49...................................................
Custom Standard Curve Methods 50.........................................................
Custom Formula Methods 51.....................................................................
13. Fluorescence: Basic Operation 53...........................................................
Best Practices 54.......................................................................................
14. Fluorescence: Standard Curve Method Apps 55....................................
15. Basic Fluorometer App 62........................................................................
Excitation Selection and Emission Results 63............................................
16. Data Export and Print Options 64............................................................
Export Options 64.......................................................................................
Export Via Email 65....................................................................................
Export to a Network Folder 66...................................................................
USB 68
Print Options 70..........................................................................................
17. Utility Apps and Functions 72..................................................................
Accounts App 72.........................................................................................
Data App 74................................................................................................
Export vs Archive 75..................................................................................
Settings App 77..........................................................................................
Updater App 80...........................................................................................
18.Lab Tool Apps 81........................................................................................
Calculator App 81.......................................................................................
Timer App 82..............................................................................................
19. Maintenance 83.........................................................................................
Cleaning 83
Solvent Compatibility 84.............................................................................
3

20. Diagnostics 85...........................................................................................
DS-11 Self Test 85....................................................................................
Microvolume Pathlength Verification 86....................................................
Verification Check Troubleshooting 87.......................................................
FX- Diagnostics 89.....................................................................................
21. Troubleshooting 90....................................................................................
Quick Help 90.............................................................................................
Software Errors 92......................................................................................
22. Customer Support 93................................................................................
4

1. Introduction
Product Technology
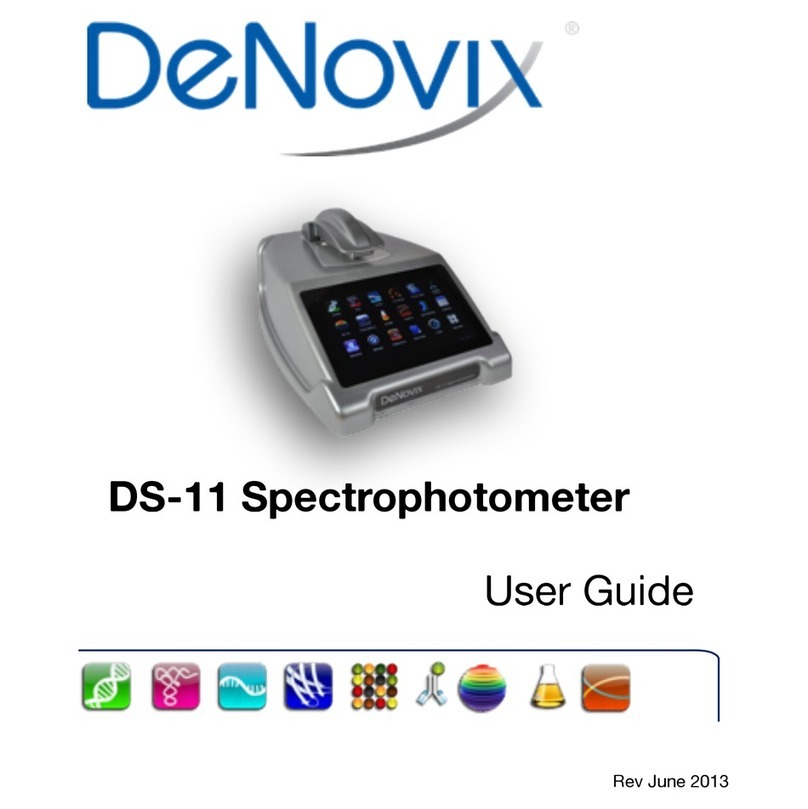
DeNovix Spectrophotometers / Fluorometers are compact instruments with an
integrated processor and a high-resolution touchscreen. The software utilizes
application specific icons along with the Android™ operating system to provide
an intuitive, easy-to-use instrument for both absorbance and fluorescence
measurements.
The SmartPath®"Technology automatically adjusts the microvolume mode
pathlengths to enable a sample measurements across a broad concentration
range. Absorbance range specifications can be found at www.denovix.com.
FX models include a fluorescence mode while the DS-11+ and DS-11 FX+
instruments also enable cuvette-based measurements for low concentration
samples and basic absorbance kinetic studies.
Key Features include:
•Integrated Processor and Hi-Definition 7-inch Touchscreen
•Custom Android™ Control Interface
•Simple, Intuitive EasyApps®
•1 μL and Cuvette Full Spectrum UV-Vis Analysis
•Four Channel Fluorescence mode
"
5

2. Set up and Safety
1. Remove all packing materials including the protective cover on the screen.
2. Plug the unit into a 100-240 VAC, 50-60/Hz receptacle using the grounded
power supply (CUI MPN: ETSA120330U-P5P-SZ, Transformer Dest Top 12V
40W, Lead free /"RoHS Compliant) included with each unit.
3. For instruments with red LED power indicators, turn on the power switch
located in the back of the instrument. For instruments with green LED power
indicators, press and release the power switch.
The Android-based operating system will boot up in less than a minute.
4. Use the Shut Down icon (accessed from within each app or on the Home
screen) to do a soft power down.
Cautions
NE PAS OUVRIR L’APPAREIL."
Aucun composant réparable par un utilisateur est inclus. Confiez l'entretien à du
personnel qualifié .
DO NOT REMOVE COVER
No operator serviceable components inside. Refer servicing to qualified
personnel.
The DS-11 is designed for indoor use under the following conditions:
Temperature: 15˚ to 35˚ C
Humidity: 35 to 65 %
Use only the power supply provided with the instrument. Use of the
instrument in any manner not specified by the manufacturer may impair the
protection provided by the supplied power cord and power supply.
!
6

Installation and Safety
Le DS- 11 est conçu pour une utilisation en intérieur dans les conditions suivantes :
Température : 15° à 35˚C
Humidité: ........35 à 65%
Utilisez uniquement le bloc d'alimentation inclus avec l'instrument. Utiliser l’appareil dans
des conditions non spécifiées par le fabricant peut compromettre la protection offerte par
le cable d’alimentation et le bloc d'alimentation fournis avec l’appareil.
VCCI (Class B) compliance statement for users in Japan:
This is a Class B product based on the standard of the Voluntary Control Council
for Interference (VCCI) from Information Technology Equipment. If"this is used
near a radio or television receiver in a domestic environment, it may cause radio
interference. Install and use the equipment according to"the instruction manual.
This equipment has been tested for radio frequency emissions and has been
verified to meet CISPR 22.2 Class B.
Instrument Rear Panel
The DS-11 comes equipped with one Ethernet and three USB ports. The Ethernet
feature is provided for internet connectivity only. The USB ports are used to
facilitate data transfer to a FAT32 formatted USB storage device and connect to
the accessory FX Module. In addition, the USB ports support the use of selected
DYMO printers*and an Opticon OPI 3601 USB barcode reader. USB mouse and
keyboard devices may also be used with the DS-11 FX+ series of instruments.
*Please refer to www.denovix for a list of supported Dymo printers.$
7

3. Software Quick Guides
Software Icons
Add
Select All
Export
Delete
Purity Ratio Alert
Sort
Edit
Copy
Info
Undo
Paste
Shut Down
!
!
!
!
!
!
The Overflow (top action bar) is used to access secondary features
such as Select Units, Screen Capture, User Guide and Exit.
Progress bars or busy indicators are used to indicate the
instrument is in the process of making a measurement. Please wait
until the icon has disappeared before performing additional actions.
The USB Flash Drive Eject icon appears in the bottom notification
bar when a drive is detected. The software will automatically safely
unmount the flash drive after a screen capture or a report is exported
to the drive. Tap the icon to remove a flash drive when nothing was
exported or saved.
The Quick Print icon is only displayed on Report or Graph screens
when a DYMO label printer is connected to the instrument.
Auto Export status icons are displayed at the top right of a Run
screen. Ensure WiFi is connected prior to making a measurement.
!
!
8

Software Quick Guides
Software Buttons
9
The absorbance apps Blank button is used to establish a reference
absorbance within each measurement app. The graph will not
display a spectrum for a Blank measurement.
The absorbance apps Measure button is used for sample
measurements. It is inactive until at least one Blank measurement is
complete.
The fluorescence apps Standards Measure button is used to
measure standards when building a standard curve.
The Samples Measure button is used to quantitate samples.
The fluorescence apps Replicates On/Off button is used to define if
the standards curve enables one or up to three replicates.
The fluorescence apps Basic Measure button is used to make
single measurements not being read from a standard curve.
Fields with Drop-Down Menus are indicated by black or white
triangles located on the center bottom.
Fields with black underlines are editable by the user. Tapping on the
field will enable a keyboard, a numeric keypad or a dialog box.
Application specific editor options can be accessed using the List
Add/Edit button found to the right of some drop-down menus.
Options buttons are used for such purposes as change units or
trend line analysis parameters in the fluorescence apps.
An accept and return to previous screen button is found in the
lower right of some screens. All changes made to a selection are
immediate.

Software Quick Guides
Software Navigation
Notification Bar
Information such as available updates, scheduled system backups reminders
and WiFi connectivity status are located on the bottom action bar adjacent to the
date and time display. Swipe the notification up for details. Tap outside the
notification box to minimize the information.
Apps are launched using Home screen icons. Swipe the Home
page to the left for additional icons.
The app Run, Report and Graph screens are accessed either
by the tabs on the top bar or by swiping the screens left or
right.
Use the Current Account Tab drop-down menu on the top
action bar in the Run, Report and Graph screens to select a
specific account within an app. Use the Accounts app to
create and manage accounts.
The bottom bar Back button is used to navigate to the main
level of the current app.
The bottom bar Home button is used to navigate to the Home
screen without closing the app.
The bottom bar Recents button is used to as a means of
displaying recently used apps. Swipe the app to the left from
the Recents list will close the app.
The bottom bar Collapse button is used in place of the Back
button whenever a keyboard is enabled. Use this button to
dismiss the keyboard.
10

Software Quick Guides
Top Bar Overflow Functions
Screen
Capture
A .jpg may be exported as described in the chapter entitled
"Screen Capture and Export" using this option.
Export
Selected
Samples
A .csv file of sample data may be may be exported as
described in the chapter entitled "Screen Capture and Export".
Network printing is also enabled using this option.
Change
Units
Concentration units may be changed in some apps using this
option.
Archive
Selected
Samples
The Archive function exports data as a .csv file to a network
folder or USB flash drive and permanently deletes it from the
instrument.
Clear
Samples
This function saves and then clears all current sample records
from the Report and Graph screens.
Baseline
Correction
Some apps enable Baseline Correction changes from the
Overflow function on the Run screen.
User Guide
The User Guide may be accessed either from the Overflow
icon within any app or by launching the User Guide app.
About
The About feature brings up an information box displaying the
current app version number.
Lamp Reset
The Diagnostics app Lamp Reset is used as a means to re-
optimize a lamp when necessary.
Tech
Support
The Diagnostics app Tech Support feature is used to send
instrument related diagnostics files to DeNovix customer
support.
Exit
Use the Exit function to close an application.
11

4. Report and Graph Screens
The measurement apps generally use a three page structure consisting of the
Run, Report and Graph screens. The various screens are accessed either by
using the top tabs or by swiping the touch screen left or right.
The typical Run screen varies significantly between the absorbance and the
fluorescence apps. Refer to the "Basic Operation" section for the absorbance
mode and the individual fluorescent app sections for more information.
Report Screen
!
•The Report screen list includes application specific data fields for each sample
measured in the current measurement session.
•Tap rows to highlight and select data for export. The Select All /UnSelect All
icons are used to quickly select or deselect all rows.
12

Report and Graph Screens
•The change will be applied to the current Report and Graph screen rows as
well as to the sample information retrieved using the Data app.
•Clear highlighted sample records from the both the Report and Graph screens
using the Delete icon. The data is removed from the current report but is still
available using the Data app.
•Highlighted sample data may be exported or printed using the top action bar
Overflow Screen Capture or Export Selected functions. Additional
information is provided in the chapter entitled "Screen Capture and Export".
Graph Screen
!
•Tap rows to highlight and select data to display the spectra. The Select All /
UnSelect All icons are used to quickly select or deselect all rows.
•Up to 24 samples may be overlaid on the graph. Absorbance apps will display
sample spectra while the fluorescence apps will display the concentration
calculated from the standard curve trend line.
13

Report and Graph Screens
•Color blocks are used as a legend convention.
•Highlight a single row and then tap the Edit icon to add or modify a sample
name. The change will be applied to the current Report and Graph screen
rows as well as to the sample information retrieved using the Data app.
•Clear highlighted sample records from the both the Report and Graph screens
using the Delete icon. The cleared data will be available using the Data app.
•Highlighted sample data may be exported or printed using the top action bar
Overflow Screen Capture or Export Selected functions. The data will will
exported as a .csv file and spectra may be re-graphed using a spreadsheet
chart function. Additional information is provided in the chapter entitled
"Screen Capture and Export".$
14

5. Absorbance Apps: Basic Operation
Microvolume Measurements
1. Ensure both top and bottom sample surfaces are clean.
2. Pipette 1 μL of the blank solution onto the lower sample surface. Lower the
top arm and tap the Blank button.
3. Remove the solution from both sample surfaces using a clean, dry lab wipe.
4. Pipette 1 μL of the sample solution onto the lower sample surface.
5. Lower the arm and tap the Measure button. All microvolume measurements
are reported in 10 mm equivalent absorbance values.
Cuvette Measurements
Refer to the light path arrow as a guide when inserting a cuvette. Use cuvettes
that meet the following specifications:
• Width: 12.5 mm Length: 12.5 mm Height: 45 mm Z height: 8.5 mm
• UV wavelength region: Use quartz or UV transparent plastic cuvettes
• Visible wavelength region: Use quartz or plastic cuvettes
1. Insert a cuvette pre-filled with the Blank solution. Lower the arm and tap the
Blank button.
2. Insert a cuvette pre-filled with the sample solution. Lower the arm and tap the
Measure button.
15

Basic Operation: Absorbance
Auto Run Measurements
1. Perform a Blank measurement as previously described and then select the
Auto Run checkbox on the app Run screen. Pipette 1 μL of the sample
solution onto the lower sample surface.
2. Lower the arm for automatic measurements. Deselect the feature to perform
new Blank measurements. Note: This feature may be used for both
microvolume and cuvette mode measurements.
Sample Measurement Modes
•Measurement mode selections are made using the drop-down menu found
next to the Measure button on the Run screen.
•The Microvolume mode uses 1.0 μL samples pipetted onto the sample
surface.
•The microvolume Short Path mode requires 0.5 μL samples pipetted onto the
sample surface. This mode is for high concentration samples and does not use
the 0.5 mm pathlength.
•The microvolume Fast Mode option is primarily for samples in the range
measured by the 0.5 mm pathlength although it may be used for higher
concentration samples .
•The DS-11+ enables the use of 10, 5, 2, 1, 0.5, 0.2 and 0.125 mm pathlength
Cuvette modes.
• Report screens will include actual absorbance values measured using a
specific cuvette pathlength. Graph screens will display all cuvette
absorbance values normalized to a 10 mm value.
•A new Blank measurement must be made when changing between
microvolume and cuvette modes.
16

Basic Operation: Absorbance
Typical Absorbance Run Screen
•Blank, Measure, AutoRun and Mode: Use the Blank button when measuring
the reference solution and the Measure button for samples.Tap the AutoRun
box to enable automatic measurements upon lowering the arm. Use the drop-
down menu to select either microvolume or cuvette mode measurements.
•Sample Name: Tap the input box to display an on-screen keyboard or use a
Opticon OPI 3601 USB scanner to enter sample names.
•Sample Type and Factor Fields: Displays current sample type and associated
factors used for concentration calculations. The fields may be fixed or
selectable depending on the application.
•Absorbance Graph: The spectral plot displays data for the current sample
normalized to a 10 mm pathlength for microvolume measurements. Pinch and
zoom anywhere in the graph to rescale the X or Y-axis.
•Baseline Correction nm: Displayed at bottom of screen. Use the top action bar
Overflow function to modify. Additional baseline correction details are provided
within each relevant measurement app chapter.$
17

Basic Operation: Absorbance
Screen Saver
•The backlight for the screen will automatically turn off after 10 minutes of
inactivity. Simply tap anywhere on the screen to resume the last function.
•Although the screen is turned off for the screen saver mode, functions such as
the Timer and Kinetics measurements continue in the background. Always
check that these apps are not in use in the background prior to turning off the
instrument.
Mechanism Busy Indicator
•A progress bar will be displayed on the screen when the measurement
mechanism is busy.
•Please do not lift the arm, push software buttons or turn the instrument off
while a progress bar or other busy indicator is displayed.
Measurement Sessions
•New measurement sessions begin each time an app is accessed from a
closed state or when the account is changed while the application is open.
•In addition, new sessions automatically begin when the number of sample
records on the Report screen reaches 9999.
18

Basic Operation: Absorbance
Best Practices Absorbance Measurements
•Clean both sample measurement surfaces prior to making the Blank
measurement.
•Use dH2O, not detergents or alcohol, for routine sample measurement surface
cleaning.
•Use a dry lab wipe to remove measurement liquids from both the top and
bottom surfaces immediately after each measurement.
•Use 1 μL samples for routine microvolume measurements.
Note: Select the Short Path mode for high concentration 0.5 μL samples.
•Use a fresh aliquot for each measurement.
•Use a fresh tip to deliver each sample aliquot.
•Avoid introducing bubbles when pipetting samples onto the measurement
surfaces.
•Ensure sample concentrations fall within absorbance limits of the instrument
for accurate results.
•Use the same buffer a sample is suspended in for the Blank measurements.
•Avoid using buffers such as RIPA buffers that contain components with strong
absorbances at the wavelength of interest.
•Measure a fresh aliquot of the buffer using the Measure button and ensure the
spectrum is relatively flat along the baseline before measuring samples.
•For cuvette mode measurements, use cuvettes with 8.5 mm Z heights. Select
the Cuvette option using the drop-down menu next to the Measure button and
ensure the cuvette is inserted in the proper orientation.$
19

6. Absorbance Nucleic Acid Apps
The four preconfigured nucleic acid apps are used to quantify nucleic acid
samples based upon absorbance values at 260 nm.
Quick Protocol
1. Launch the appropriate application from the Home screen.
2. Establish a Blank using the appropriate buffer.
3. Enter a sample name.
4. Select a sample type if applicable.
•Enter optional user-defined ng-cm/μL factor (ssDNA and Microarray).
•Select a dye type (Microarray only).
5. Measure a fresh aliquot of sample using the Measure button.
Notes:
•Blank with TE if the sample is dissolved in TE.
•Ensure that the sample isolation procedure is optimized and that samples are
purified prior to making absorbance measurements.
•Ensure all solutions are homogenous and well-mixed prior to sampling.
•Use fresh aliquots for each microvolume measurement.!
20
dsDNA
RNA
ssDNA
Microarray
!
!
!
Other manuals for DS-11 Series
1
This manual suits for next models
2
Table of contents
Other DeNovix Measuring Instrument manuals
