Deprag ME6000 User manual

015165en
Operating Instruction
- Translation of the original instructions -
Electronic Torquemeter
Type: ME6000
Order No.: 385565 A
NOTICE ALL DOCUMENTATIONS !
Before beginning work this operating instruction booklet and the enclosed
safety instructions (no. 016000, pink-colored booklet) have to be read through
carefully. Always follow the instructions during operation. Give this operating in-
struction booklet and the appropriate safety instructions to the operator.

2
Table of Contents
1DEFINITION OF SIGNAL WORDS AND SYMBOLS.......................................................5
2SAFETY INSTRUCTIONS................................................................................................6
3INTENDED USE ...............................................................................................................6
4SCOPE OF DELIVERY.....................................................................................................6
5SHORT DESCRIPTION....................................................................................................7
5.1 Terminology.....................................................................................................................8
6FRONT-, REAR- AND CONNECTION STRIP..................................................................9
6.1 Top View of the ME6000 .................................................................................................9
6.2 Front View of the ME6000.............................................................................................10
6.3 Rear View and Connection Strip of the ME6000.........................................................11
7PORT DESCRIPTION.....................................................................................................12
7.1 Strain Gauge Transducer (DMS) and External Transducer.......................................12
8ACCESSORIES..............................................................................................................13
8.1 Measuring Transducer..................................................................................................13
8.2 Connector Cable ...........................................................................................................14
9GETTING STARTED ......................................................................................................15
9.1 Set Up and Connection.................................................................................................15
10 HOW THE MEASURING ELECTRONIC ME6000 WORKS...........................................17
10.1 General Function...........................................................................................................17
10.2 General Measurement/Technical Information ............................................................17
10.3 Test of Tool Function Capability .................................................................................17
10.3.1 Tool Performance Index (Cm)......................................................................................18
10.3.2 Tool Performance Index (Cmk) ...................................................................................18
10.4 Functionality of the Measuring Instrument.................................................................19
10.4.1 Piezo Electric Effect ....................................................................................................19
10.4.2 Function of Piezo Measuring Transducer....................................................................19
10.4.3 Drift (Piezo Measuring Transducers)...........................................................................19
10.4.4 DMS-Bridge.................................................................................................................19
11 SOFTWARE DESCRIPTION..........................................................................................20
11.1 The Main Window..........................................................................................................20
11.1.1 DMS Settings ..............................................................................................................21
11.1.2 Piezo Settings .............................................................................................................21
11.1.3 External Transducer Settings......................................................................................22
11.1.4 Additional Settings.......................................................................................................22
11.1.5 Limit Value Monitoring.................................................................................................24
11.1.6 Measurement Process ................................................................................................25
11.1.7 Minimise Program .......................................................................................................28
11.2 Graph Analysis..............................................................................................................30
11.2.1 Zoom In Graph Display ...............................................................................................30
11.2.2 Retrieving Original Graph Display...............................................................................32
11.2.3 Display Scale...............................................................................................................32
11.2.4 Set Markers.................................................................................................................32
11.2.5 Delete Markers............................................................................................................33
11.2.6 Load Graph .................................................................................................................33
11.2.7 Save Graph .................................................................................................................34
11.2.8 Save Graph Display ....................................................................................................35
11.2.9 Print Graph Display .....................................................................................................36
11.2.10 Copy Graph Display ................................................................................................36
11.3 Statistics ........................................................................................................................37
11.3.1 Changing the Limit Values ..........................................................................................38

3
11.3.2 Delete Measurement Values.......................................................................................39
11.3.3 Save Values and Results ............................................................................................40
11.4 Instantaneous Value Display .......................................................................................41
11.5 Set Up.............................................................................................................................43
11.6 Change Calibration Values...........................................................................................45
11.7 Help ................................................................................................................................45
12 MEASURING RANGES..................................................................................................46
12.1 Strain-Gauge Transducer (DMS)..................................................................................46
12.2 Piezo Electric Transducer ............................................................................................46
12.3 Torque Transducer with Rotating Shaft......................................................................47
13 SERVICE AND MAINTENANCE....................................................................................48
13.1 Cleaning.........................................................................................................................48
13.2 Software Updates..........................................................................................................48
14 TROUBLE SHOOTING...................................................................................................49
15 TECHNICAL DATA ........................................................................................................50
16 PLACING OUT OF OPERATION...................................................................................51
17 CE-CONFORMITY DECLARATION...............................................................................52
18 SERVICE LOCATIONS AND AUTHORIZED PARTNERS............................................53

4
Table of Figures
Picture 1: Top view of the ME6000............................................................................................9
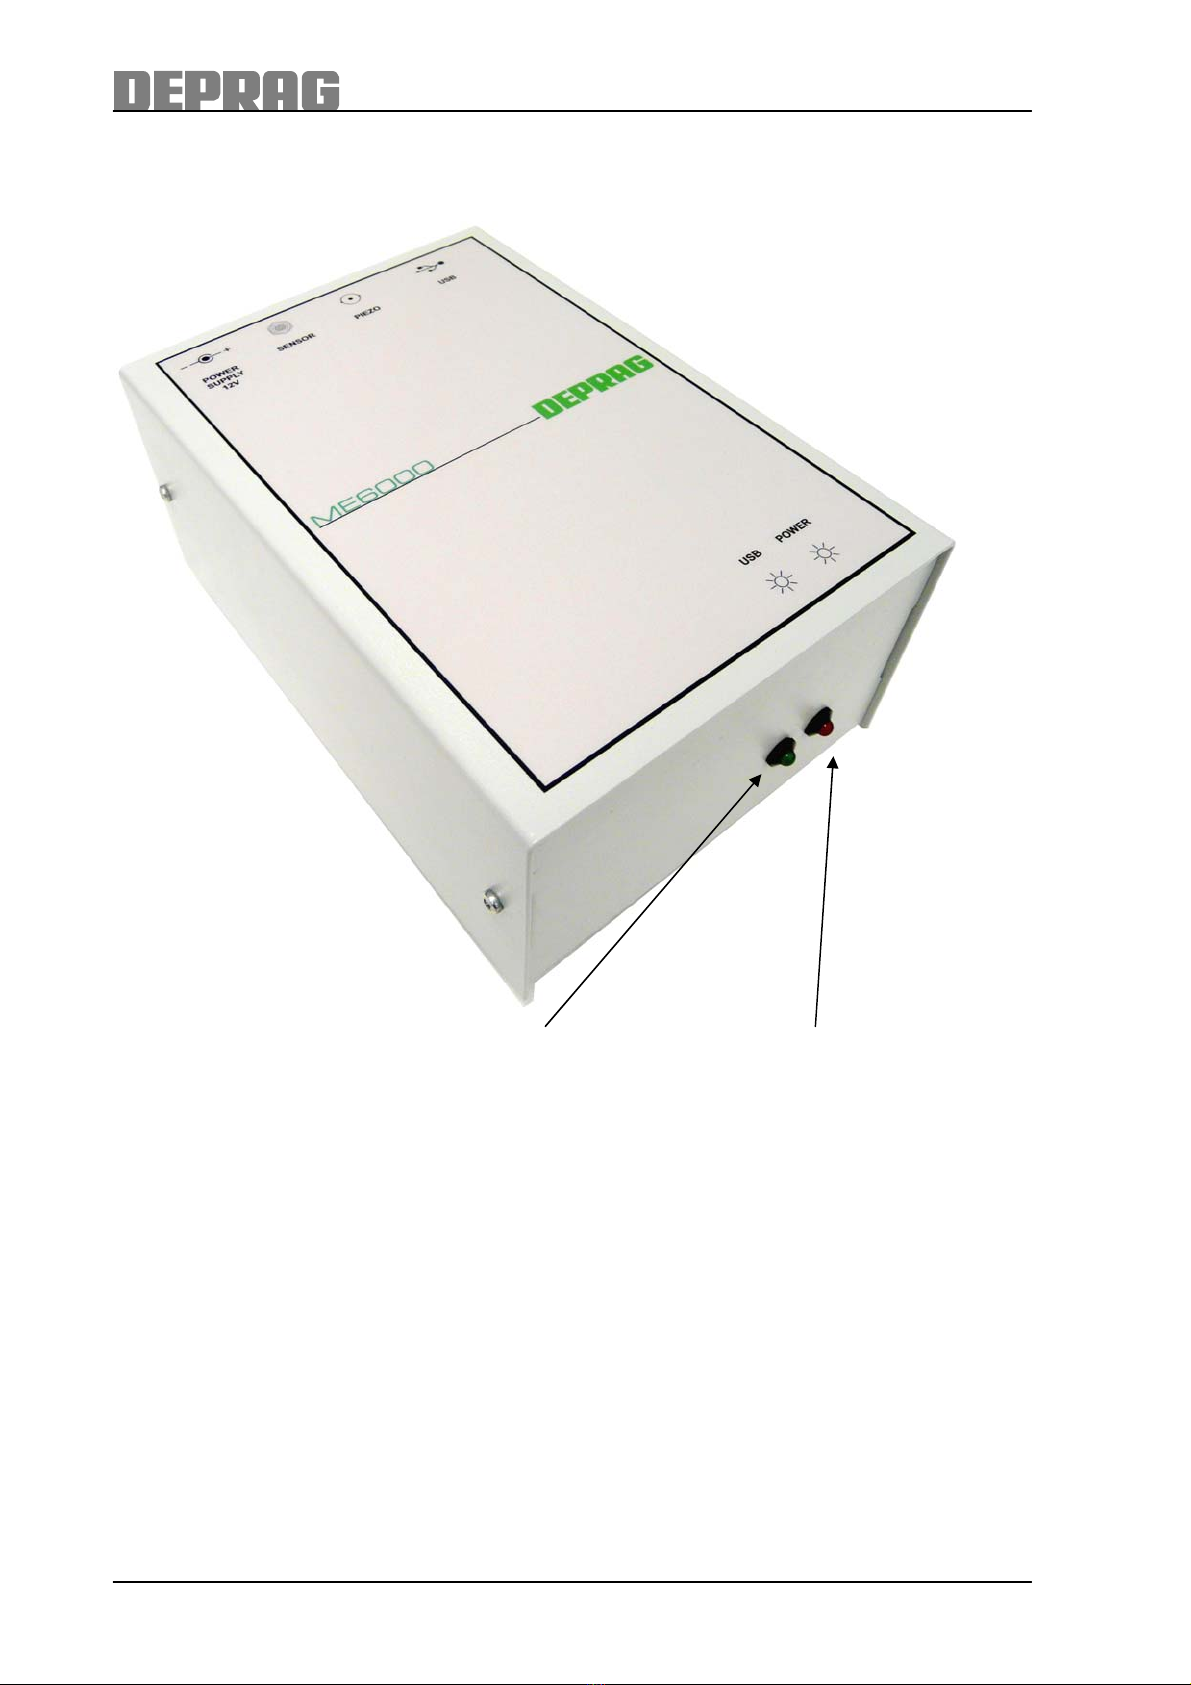
Picture 2: Front view with LEDs...............................................................................................10
Picture 3: Rear view with connectors ......................................................................................11
Picture 4: Main program ..........................................................................................................20
Picture 5: Settings for DMS sensor .........................................................................................21
Picture 6: Settings for a different manufacturer’s DMS sensor................................................21
Picture 7: Settings for piezo sensor.........................................................................................21
Picture 8: Settings for external transducer ..............................................................................22
Picture 9: Settings for a different manufacturer’s external transducer.....................................22
Picture 10: Graph with default settings..................................................................................23
Picture 11: Graph with delay = 5 ...........................................................................................23
Picture 12: Graph with delay = 5 and trigger = 25%..............................................................24
Picture 13: Example of measurement with limit value monitoring .........................................25
Picture 14: Choose the measurement unit ............................................................................25
Picture 15: Dropdown menu to choose the measurement unit..............................................25
Picture 16: Choosing measurement by START and STOP ...................................................26
Picture 17: Choosing automatic measurement......................................................................26
Picture 18: popup-window for setting the limit values............................................................27
Picture 19: Choosing series measurement............................................................................27
Picture 20: Setting the amount of measurements within a series..........................................27
Picture 21: Series measurement ...........................................................................................28
Picture 22: Minimise ME6000 program .................................................................................28
Picture 23: Minimised ME6000 program ...............................................................................28
Picture 24: Maximise ME6000 program ................................................................................29
Picture 25: Graph display ......................................................................................................30
Picture 26: Magnify tool .........................................................................................................30
Picture 27: Marking an area to enlarge .................................................................................31
Picture 28: Magnified graph display ......................................................................................31
Picture 29: Display graph in original size...............................................................................32
Picture 30: Display scale .......................................................................................................32
Picture 31: Graph display with scale displayed .....................................................................32
Picture 32: Mark point on the graph ......................................................................................32
Picture 33: Graph display with three markers set..................................................................33
Picture 34: Delete last set marker from the graph .................................................................33
Picture 35: Open a saved graph............................................................................................33
Picture 36: Choosing a graph ................................................................................................34
Picture 37: Saving a Graph ...................................................................................................34
Picture 38: Choose where to save graph ..............................................................................35
Picture 39: Save the graph display........................................................................................35
Picture 40: Choosing where to save the graph display..........................................................35
Picture 41: Print the graph display.........................................................................................36
Picture 42: Copy the graph display into the clipboard ...........................................................36
Picture 43: Statistics ..............................................................................................................38
Picture 44: CMK settings .......................................................................................................39
Picture 45: Absolute value for upper and lower limits............................................................39
Picture 46: Deviation from average for upper and lower limits in percentage .......................39
Picture 47: Delete individual measurement values................................................................40
Picture 48: Choosing where to save measurement results ...................................................41
Picture 49: Instantaneous value display ................................................................................42
Picture 50: Select Language, Limit and other settings ..........................................................43
Picture 51: Setting the calibration values ..............................................................................45

5
1 Definition of Signal Words and Symbols
The signal words and symbols used in the technical documentation (safety instructions,
operating instruction booklet, etc.) have the following meaning:
DANGER
Indicates an immediate danger which causes serious injuries or even
death if not avoided.
WARNING
Indicates a threatening danger which can cause serious injuries or even
death if not avoided.
CAUTION
Indicates a danger or unsafe procedure which can cause injuries to a per-
son or material damages if not avoided.
NOTICE
Indicates a potentially dangerous situation which can cause damage to
the product or its surroundings if not avoided.
IMPORTANT
Indicates tips and other useful information.
In each case the symbol used does not replace the safety text. The text must always be
read fully. In some cases other symbols will be used with the signal words.

6
2 Safety Instructions
Reading the enclosed safety instruction booklet no. 016000 (pink-coloured booklet) is
essential for working with the equipment.
WARNING
Fires, electric shocks and other injuries, or damages to components can be
caused if the safety guidelines are ignored.
WARNING
Risk of fatal injury due to electrocution!
Disconnect the electric equipment from the power supply before starting
any work on the tool (e.g. installation, changing of accessories or machine
tools, removal of covers prior to longer downtimes, maintenance works,
etc.).
Switch off the mains switch and pull out the mains plug!
3 Intended Use
This measuring instrument has been designed and constructed for the sole purpose of
monitoring piezo-, strain gauge- or transducers with rotating shafts (designated use).
The use of this instrument in any other way is not permissible. Furthermore, DEPRAG is
not liable for damages, resulting from the misuse of the instrument; the user alone is
liable.
The correct use of the instrument includes compliance with all Operating-,
Maintenance-, and Repair Instructions, which are considered an integral part.
4 Scope of Delivery
Check that the shipment is complete and that there have been no damages in transit.
Quantity Designation Part No.
1 Operating Instruction 015165en
1 Safety Instructions 016000
1 Electronic Torque-Measuring Instrument ME6000 385565 A
1 Power Supply 20W/12V 800827
1 Power Supply Cable (230V EU) 812587
1 Power Supply Cable (115V US) 812295
1 Connection cable USB A/B 2,0m 831420
1 Software on CD 204775
1 Calibration certificate

7
5 Short Description
The ME6000 is a measuring device, which is designed for measuring using DMS
measuring platforms, piezo measuring platforms/torque wrenches and external
transducers. DMS platforms and external transducers, either from DEPRAG or from
other manufacturers can be connected.
It is operated by use of the delivered software. The software is available in various
languages.
The calibration value can be set for the chosen sensor. There are three options for
measurement: measurement using start/stop, measurement with automatic end
recognition and with series recognition. The seria n operates with au
end recognition.
You can choose from various measuring units t he measurement resu
required you can enter limit values for the measurement results. Then the measurement
value is shown highlighted in colour whether the measurement results are inside or
outside the measurement values.
he process of measurement (screw assembly) is displayed graphically if required. The
graph can be labelled with markers. A zoom function enables easy evaluation of a
screw assembly. The measurement data can be saved in a file and reloaded later. The
measurement graph can be saved in either bitmap or jpg format and also directly used
in other applications using copy and paste.
Statistical evaluations are calculated by average, standard deviation and standard
deviation in percentage. The machine performance index (Cmand Cmk) is calculated by
means of the set tolerance in relation to the average value. The tolerance is given in
percentage. Alternatively the upper and lower limits can also be altered.
The analogue instantaneous value display constantly shows the measurement value
which is measured on the measuring platform or with an external transducer.
l recognitio tomatic
o display t lts. If
T

8
5.1 Terminology
Measuring Value: Submitted torque from transducer.
Calibration Value: Sensitivity of transducer.
Measurement
Series:
The torque values are stored. At the end of a measurement
series, the average torque and standard deviation is being
calculated.
Average Values:
Mean value is calculated from a specific number of previously
stored values.
ii
X
N
X1
N
_1
Standard Deviati
Standard deviation is calculated from a specific number of
on:
previously stored values. sN
1
XX
i
i
()
1
2
N_
Cm
The machine capability index Cmindicates how large the
dispersion of values is.
6ueMinimumValueumVal
mMaxim
C
Cmk
The machine capability index Cmk is a statement how the mean
of the sample is located to the predetermined tolerance.
)
3
,
3
min(
ueMinimumValAverageAverageueMaximumVal
Cmk

9
6 Front-, Rear- and Connection Strip
6f.1 Top View o the ME6000
Picture 1: Top view of the ME6000

10
6.2 Front View of the ME6000
green LED: red LED:
USB connected power supply connected
Picture 2: Front view with LEDs
LED USB: lights when the ME6000 is connected to the computer over the USB
cable
LED POWER: lights when the ME6000 is connected to the power supply

11
6.3 Rear View and Connection Strip of the ME6000
USB port Piezo- strain gauge-/ power supply
transducer external rotary
transducer
Picture 3: Rear view with connectors

12
7 Port Description
7.1 Strain Gauge Transducer (DMS) and External Transducer
Connector: circular connector 8-pole
Binder Series 712, order number: 99-0425-00-08
Pin Signal Use
1 VCC Supply voltage of External Transducer (+12V)
2 GND GND External Transducer
3 Signal Measuring signal of External Transducer (0 – 5V)
4 U+ Positive supply voltage of Strain Gauge Transducer (+2,5V)
5 Ud- Negative measuring signal of Strain Gauge Transducer
6 Ud+ Positive measuring signal of Strain Gauge Transducer
7 U- upply voltage ofNegative s Strain Gauge Transducer (-2,5V)
8 GND nal TransducerGND Exter

13
8 Accessories
8.1 Measuring Transducer
(see leaflet D 3020 E)
Description Model No. Measuring Range Part No.
V002-E6,3/F6,3 0,2 – 2 N·m 385481 B
V005-E6,3/F6,3 0,5 – 5 N·m 385481 C
V010-E6,3/F6,3 1 – 10 N·m 385481 D
Externa ry-Typel Rota
Transducer
(strain- non-cogauge, ntact
signal t 385481 E
ransfer) V020-E6,3/F6,3 2 – 20 N·m
MP 25 PE ± 25 N·m 360850 A
MP 200 PE ± 200 N·m 373205 A
Piezo E ic (PE)lectr
Transducer:
(Measu latform) A
ring P MP 1000 PE ± 1000 N·m 408000
MP 2 DMS ± 0,2 to ± 2 N·m 385200 B
MP 7 DMS ± 1 to ± 7 N·m 385200 A
MP 25 DMS ± 4 to ± 25 N·m 385200 C
MP 160 DMS ± 20 to ± 160 N·m 385200 D
Strain-Gauge
(DMS) Transducer:
(Measuring Platform)
MP 500 DMS ± 50 to ± 500 N·m 408088 A
Piezo Electric (PE)
Transducer:
(Torque Wrench)
MS 25 PE-W ± 25 N·m 346217 A
MS 2 DMS ± 0,2 to ± 2 N·m 387798 B
MS 7 DMS ± 1 to ± 7 N·m 387798 A
MS 7 DMS-W ± 1 to ± 7 N·m 388050 A
Strain-Gauge
(DMS) Transducer:
(Torque Wrench)
MS 25 DMS-W ± 4 to ± 25 N·m 388050 C

14
8.2 Connector Cable
Connector cables for connecting ME6000 to measuring transducer:
Measuring transducer Connector cable order no.
MP 25 PE
MP 200 PE or
MS 25 PE-W
810675 (5 m)
MP 1000 PE 810629 (1 m)
MP 2 DMS,
MP 7 DMS,
MP 25 DMS or
MP 160 DMS
3854
3854
385493 C (
93 A (2 m)
93 B (4 m)
6 m)
MP 500 DMS 385486 A (2 m)
385486 B (4 m)
385486 C (6 m)
MS 2 DMS
MS 7 DMS,
MS 7 DMS-W or
MS 25 DMS-W
3854
385493 B (4 m)
38
93 A (2 m)
5693 C (6 m)
V002-E6,3/F6,3
V005-E6,3/F6,3
V010-E6,3/F6,3 or
V020-E6,3/F6,3
38
38
3
5486 A (2 m)
5486 B (4 m)
85486 C (6 m)

15
9 Getting Started
9.1 Set Up and Connection
CD or DVD dri tware ME6000
tion does not start automatically, double click on ME6000-SETUP.exe
the connection cable between measurement platform and ME6000
t your ME6000 to the PC using a USB cable
to mains voltage
he ME6000 software and enter the c for the various
rement systems, measurement ranges and measurement channels (see
Insert the CD into a ve of your PC and install the sof
If installa
tConnec
Connec
Plug in
Start t alibration values
measu

16
Change Calibration Values). The calibration values can be found on page 10 of
e of your ME6000.the calibration certificat
ME6000 is now ready for use.

17
10 How the Measuring Electronic ME6000 Works
the measuring electronic ME6000 is switched off, all parameters remain saved. It is
not necessary to input the same data twice.
Values can be changed as described in chapter Software Description
10.1 General Function
If
.
10.2 General Measurement/Technical Information
The Transducer (measuring platform/Dynamometers) has to be positioned on a solid
base, without allowing any movement.
At that time the transducer should be free of external forces or vibrations (such as the
distortion of the measuring platform resulting from incorrect installation).
After each start-signal, the charge amplifier will reset and perform a zero calibration.
External forces, momentum, or vibration can distort the torque measurement.
In order to provide a high level of quality assurance and for you to be able to present the
respective documents in case of an audit, we recommend to have your measuring
devices re-calibrated once a year.
Concerning our torque measuring units and torque dynamometers as well as for a
complete measuring series we would like to offer you to have these calibrated at the
DEPRAG Amberg facilities.
IMPORTANT
Please do not hesitate to contact us in case you have questions.
DEPRAG SCHULZ GMBH u. CO.
Visit our home page www.DEPRAG.com.
10.3 Test of Tool Function Capability
Prior to the use of a tool for the mass production, it can be testes, if this tool fulfils the
required demands with sufficient safety margin.
The goal of a Function Capability Test is to proof that:
a) the tool to be tested conforms to recognized regulations. If no regulations are
recognizable, then the tool does not have a defined capability. It is then not
acceptable to assign statistical calculated capability values to such a tool.
b) the tool is capable to assemble parts within defined tolerances. The required proof
can only be established using the recognized regulations, as shown under a).
The function capability test is a short-term test, with the goal to obtain exclusive
machine-conditions that influence the manufacturing process.

18
IMPORTANT
(sys
During the acquiring of sample readings, no disruption of the tool
ce) should occur (i.e. torque adjustment).tem influen
The test is based on the Gaussian distribution curve.
σ).
10.3.1 Tool Performance Index (Cm)
Cm= total specific torque tolerance of the connection: 6 Sigma (
This index indicates the expanded scale of the torque values.
*6 LowerLimitUpperLimit
Cm
10.3.2 Tool Performance Index (Cmk)
Cmk is defined as the minimum of:
1.
*3 AverageUpperLimit
Cmk
or
2.
*3 LowerLimitAverage
Cmk
he Cmk - value shown below is 1.33 for a Screwdriver (this corresponds to a calculation
of the C - limit values of 4 Sigma (σ)).
e Limit Errors
This index informs about the settling, as well as the expanded scale of the torque
values.
T
mk
Cm / Cmk Limit Values Within th
Values
0,30 ± s 68,3 > 30%
0,70 ± 2s 95,4 ~ 5%
1,00 ± 3s 99,7 3 ‰
1,33 ±4s 99,994 60 ppm
1,63 ±4,891s 99,9999 1 ppm
1,66 ±5s 99,99994 0,6 ppm
2,00 ± 6s 99,9999998 210
9
*
th
IMPORTANT
The average torque should not deviate from the set value by more
an 3%. Otherwise a correct determination of the tool function index
is not possible anymore.

19
10.4 Fu
This torqu
monitoring
ransduce
nctio Measuring Instrument
e mon
Piezo
s in a
iezo-electric effectual dielectric materials are
tals, the centre of
ads. The piezo
erials are deformed, the
ipole of those polarization changes, loads are being set
ric effect can be used to obtain the load
the deformation. The freed load depends
only on the deformation of the crystal and not on the speed or on the acceleration of the
/ MS25 / MS10) have piezo-quartz
preloading of the cell during manufacturing,
is determined. Since different cell sizes are
oads of the transducers are different.
b)
ton - Meter (N·m). That means if a force of 1 N·m is put to the measuring cell, a
ad is emitted, which is defined by the calibration value.
/ N·m
Pico Coulomb = 0.000 000 000 001 C
The me le arge ed transforms the
emitted electrical load from
depends on the integrated capacitor, which is t, i.e. at a range
capacitor of 1000 pC, a load of 2000 pC is converted into 2 V. Each measuring range is
rated to V.
10.4.3 (Piez suring Transd
A characteristic of the charge amplifier is the drift. This drift is caused by the input-
resista the in nsistor. Throu voltag ge amplifier drifts
ion. Therefore, it is import e measurement
mediately prior to the screw driving.
MS-Br
cal re
ma
he deformed D of its basic resistance R (no load) and the
onsequential occurring resistance-change ∆R.
nality of the
itor has been designed and constructed for the sole purpose of
-Transducers-, Strain Gauge Transducers or external Rotary Type
n industrial environment.
rT
10.4.1 Piezo Electric Effect
The positive and negative loads of the p
distributed unsymmetrical. Because of the molecules and/or the crys
tive logravity of the positive loads does not subsidence with the nega
lectric materials are electronically polarized. When those mate
d moment changes. On account
free on the surface. Therefore, the piezo elect
size from the measurement, which causes
deformation.
10.4.2 Function of Piezo Measuring Transducer
The measuring transducers (MP25 / MP200
measuring cells
the emitting elec
integrated. Because of the
trical load (Coulomb)
h itting electrical lavailable, t e em
The engraved calibration value on the transducer defines the emitted load (Coulom
per New
lo
Example for the calibration value: 172 pC
1
asuring e ctronic has a ch
the transducer into an elec
amplifier integrat
tronic voltage. The voltage
on the measuring inpu
, which
+/- 5
Drift o Mea ucers)
nce of put-tra gh this input- e, the ch
ant, to start th
ar
into a positive or negative direct
im
10.4.4 D
The electri
deformatio
idge
sistance of each strain changes when deformed. The cause of this
y be power, pressure, torque, deflection, angle etc. The resistance of
MS (strain gauge) consists
n
t
c

20
11 Software Description
11.1 The Main Window
The main window appears on screen after software start up.
Picture 4: Main program
tarting the software for the first time. InThe language setting may not be correct when s
this case click on SETUP in order to choose the correct language (see Set Up).
IMPORTANT
Make sure that the calibration values are set (see Change Calibration
sValue ).
The ME6000 program is ended by clicking on QUIT.
This manual suits for next models
1
Table of contents
Other Deprag Measuring Instrument manuals
Popular Measuring Instrument manuals by other brands

Omega
Omega CDH-721 instruction manual

Takk
Takk 400T Series Installation & operating instructions

Sensaphone
Sensaphone WEB600 user manual

GW Instek
GW Instek LCR-8000G Series user manual

Gossen MetraWatt
Gossen MetraWatt PROFITEST Series Supplement Safety Information

Fuji Electric
Fuji Electric FSC-1 instruction manual