DST ObservAir User manual

ObservAir
Operating Manual
Distributed Sensing Technologies
Released: November 1, 2020
Version: 1.0
© 2020 Distributed Sensing Technologies, LLC
1
ObservAir®Operating Manual
Table of Contents
1. Introduction ..............................................................................................3
1.1. Principle of operation ....................................................................................4
1.1.1. Aerosol absorption photometer (Black carbon)............................4
1.1.2. Electrochemical cells (Gaseous pollutants) ....................................6
1.2. Environmental compensation ....................................................................7
1.3. Base package contents .................................................................................8
2. Technical Specifications .........................................................................9
2.1. General specifications ...................................................................................9
2.2. Measurement performance ..................................................................... 10
2.3. Operational limits and warnings ............................................................ 11
3. Operating Instructions ..........................................................................13
3.1. Hardware overview....................................................................................... 13
3.2. Interactive LED button: Sensor display and control...................... 14
3.2.1. Sensor startup .......................................................................................... 15
3.2.2. Default LED mode: Pollutant concentration display ................ 15
3.2.3. Sensor menu Interface ......................................................................... 15
3.2.4. Attenuation reset ..................................................................................... 16
3.2.5. Sensor shutdown..................................................................................... 16
3.2.6. Sensor alarms and errors.................................................................... 16
3.3. Filter tab replacement ................................................................................ 17
3.4. Battery charging ........................................................................................... 18
3.5. Data collection from onboard SD card ............................................... 19
3.5.1. Settings file ................................................................................................ 19
3.5.2. Data file ....................................................................................................... 21
3.6. Computer (serial USB) connection ....................................................... 22
3.6.1. Connecting to Arduino Serial Monitor............................................ 22
3.6.2. Serial data collection ............................................................................. 23
3.6.3. Sensor configuration: Serial commands....................................... 23
3.7. WiFi connection............................................................................................. 25
3.8. Firmware updates ........................................................................................ 26

2
ObservAir Operating Manual
3.9. External sample lines.................................................................................. 26
4. Maintenance and Calibration Procedures ..........................................27
4.1. Zero calibration of pollution sensors ................................................... 27
4.2. Span calibration of pollution sensors .................................................. 27
4.3. Flow rate calibration.................................................................................... 28
4.4. Leak check....................................................................................................... 28
5. Best Practices ........................................................................................30
5.1. Filter replacement ........................................................................................ 30
5.2. Filter loading correction............................................................................. 30
5.3. Flow rate setting: Filter life vs. BC resolution ................................... 31
5.4. Operational settings for common applications ............................... 34
5.5. Indoor/Outdoor monitoring guidelines ............................................... 36
5.6. Accurate sample flow rate measurements are critical ................. 36
6. Troubleshooting .....................................................................................37
6.1. LED error codes ............................................................................................ 37
6.2. Unresponsive sensor................................................................................... 37
3
ObservAir®Operating Manual
1. Introduction
The ObservAir is an air quality sensing platform that provides accurate
pollutant concentration measurements in real time. Key features include:
• Modular: The ObservAir is centered around a black carbon (BC) sensor,
and can optionally monitor up to two of the following six gaseous
pollutants: CO, NO2, SO2, O3, H2S, and ethanol.
• Portable: The lightweight (600g) and compact (120x80x45 mm)
ObservAir is easily deployed in both stationary and mobile monitoring
applications.
• Connected: All ObservAir units support WiFi and USB communication
protocols, and include a 16GB removable SD card for onboard data
storage. Units may also be supplemented with an LTE, LoRa, or SigFox
communication module and a GPS unit for location logging. An
integrated mobile app and optional data backend services enable real-
time air quality monitoring, sensor diagnostics, and data collection.
• Accuracy anywhere:Using DST’s proprietary environmental
compensation algorithms, each ObservAir is individually ‘trained’ to
maintain measurement accuracy even in harsh operating environments
(e.g. outdoors) where existing air quality instruments typically suffer.
• Network-ready:With a 24-hour battery life, flexible wireless
communication options, and environmental compensation, the
ObservAir is ready for networked deployments at a moment’s notice.
• Flexible: Accessories are available to enable a wide range of monitoring
applications: Solar panels for extended stationary measurements,
mounting and packaging solutions for mobile platforms,
environmentally controlled enclosures for harsh environments, etc.
The ObservAir is designed to be easily deployed anywhere, and trusted to
deliver accurate air quality measurements reliably and conveniently. If you
have any questions about integrating the ObservAir into your air quality
monitoring efforts, please contact us at info@dstech.io.

4
ObservAir Operating Manual
1.1. Principle of operation
Figure 1. Functional diagram of the ObservAir
The ObservAir is centered around an aerosol absorption photometer
configured to measure concentrations of black carbon (BC). BC is a type of
particulate matter (PM) pollution generated by the incomplete combustion
of fossil fuels or biomass. For most purposes, BC is functionally defined as
the light-absorbing component of PM pollution. The ObservAir's
micropump first draws air into the inlet and through a fibrous aerosol filter.
that is mounted on black supporting material (the disposable filter tab). As
light absorbing PM collects on the fibrous filter, calculates BC
concentrations in real time. Downstream of the photometer, a relative
humidity and temperature sensor records environmental conditions, and
optional electrochemical cells measure up to two gaseous pollutants. Air
then passes through the flow rate sensor and is exhausted by the pump.
1.1.1. Aerosol absorption photometer (Black carbon)
A schematic of the ObservAir's aerosol absorption photometer is provided
below. Photodiodes continuously monitor the intensity of 880 nm light
transmitted from an LED source through two aerosol filters. As polluted air
is drawn through the photometer, light absorbing BC accumulates on the
first ‘signal’ filter and the transmitted light intensity attenuates predictably
over time. The filter collection area is 3 mm in diameter. After the first filter,
the air flow passes through a second ‘reference’ filter assembly that is
identical to the first. Since the air is filtered (devoid of PM), the intensity of
light transmitted through the reference filter is unaffected by BC
concentrations. By comparing the reference light intensity to that measured
at the signal filter, it is possible to isolate the light attenuation resulting from
BC absorption alone, while largely eliminating other factors.
5
ObservAir®Operating Manual
Figure 2. Schematic of the aerosol absorption photometer
Optical attenuation (ATN) is defined in terms of the two light intensity
measurements, as shown below. In the ObservAir, both measurements are
reported as the bit count from the photodiodes’ Analog to Digital Converter
(ADC), ranging from 0 to 8388607 (full scale 23-bit output).
𝐴𝑇𝑁=100×ln*𝐼!"#
𝐼$%& ,---------(1)-
Iref = Light intensity through reference filter (ADC count)
Isig = Light intensity through signal filter (ADC count)
In this way, the optical ATN through the photometer is monitored in real
time (note that ATN is unitless) and BC concentrations are calculated using
the fundamental equation:
𝐵𝐶(𝑡%)=- 𝐴
𝑀𝐴𝐶∙𝑄(𝑡%)∙Δ𝐴𝑇𝑁
Δ𝑡 =𝐴
𝑀𝐴𝐶∙𝑄(𝑡)∙𝐴𝑇𝑁(𝑡%)−𝐴𝑇𝑁(𝑡%'()
𝑡%−𝑡%'( ---------(2)
BC(ti)= Black carbon at time ti(µg/m3)
A = Filter collection area (D = 3mm) = 7.07x10⁻⁷ m2
MAC = Mass absorption coefficient of BC at 880 nm = 12.5x10⁻⁶ m2/µg
Q(ti)= Flow rate at time ti(m3/sec)
∆ATN = Difference of two ATN measurements = ATN(ti)- ATN(ti-1)
∆t = Measurement interval (seconds) = ti- ti-1
Photodiode
(Signal)
Photodiode
(Reference)
LED (880 nm)
Inlet
Exhaust
(to pump etc.)
Glass
Glass
BC
deposit Aerosol
filter
Filter Support
Material (tab)
:Sample flow :Filtered flow

6
ObservAir Operating Manual
The Mass Absorption Coefficient (MAC) is a calibration factor that relates
the time differential of ATN to BC concentrations in the flow. The MAC varies
depending on the air pollution source, PM composition and other factors.
By default, the ObservAir uses a MAC of 12.5 m2/g, but this value may be
adjusted following cross-calibration with a reference instrument. For the
factors specific to the ObservAir, Equation (2) simplifies to:
𝐵𝐶(𝑡%)=- 𝐾
𝑄(𝑡%)∙Δ𝐴𝑇𝑁
Δ𝑡 ---------(3)
K = ObservAir constant = 339,292 µg · ccm · sec/m3
Q(ti)= Flow rate at time ti(ccm)
Note: In Equation (3) above, the flow rate (Q) is input in units of cubic
centimeters per minute (ccm), as reported by the ObservAir.
1.1.2. Electrochemical cells (Gaseous pollutants)
The ObservAir can be optionally outfitted with electrochemical cells to
measure gaseous pollutants. Six electrochemical cells are available, to
monitor concentrations of carbon monoxide (CO), nitrogen dioxide (NO2),
ozone (O3), sulfur dioxide (SO2), hydrogen sulfide (H2S), and ethanol. The
ObservAir can be configured to measure up to two (2) of these six species.
Electrochemical cells contain a chemical reagent that creates a
small electrical current when exposed to the gaseous analyte of interest
(e.g., CO). This electrical current is amplified and converted to a voltage
signal (the ‘gas voltage’) for digital acquisition. Each electrochemical cell
also outputs a reference voltage to compensate for drift and environmental
sensitivity. Using these two voltage signals, the gas concentration is
calculated as follows:
𝐶&)$(𝑡)=𝑉&)$(𝑡)−𝑉!"#(𝑡)−𝑉*"!+
𝐶𝑜𝑑𝑒∙𝐺𝑎𝑖𝑛∙10', ---------(4)
Cgas(t) = Gas concentration at time ‘t’ (ppm)
Vgas(t) = Gas voltage at time ‘t’ (V)
Vref(t) = Reference voltage at time ‘t’ (V)
Vzero = Offset voltage differential = Vgas – Vref when Cgas = 0 ppm (V)
Code = Calibration code (nA/ppm). See Section 3.5.1.
Gain = Voltage gain (kV/nA). See Table 1.
An offset voltage differential (Vzero)value is determined for each ObservAir
during DST’s zero-calibration procedure, but this value should also be
measured and logged prior to your monitoring application. Operate the
7
ObservAir®Operating Manual
ObservAir for 12 to 24 hours in an environment that is free of the analyte
gas(es) and average the voltage differential data collected over the entire
zero calibration period. Code is the factory calibration factor and is specific
to each individual cell. The code for each cell is automatically logged in the
SD card’s Settings file, as outlined in Section 3.5.1.
Gas
Gain (kV/nA)
Carbon Monoxide (CO)
100
Hydrogen Sulfide (H2S)
49.9
Nitrogen Dioxide (NO2)
499
Sulfur Dioxide (SO2)
100
Ozone (O3)
299
Ethanol
249
Table 1. Gain settings for each type of electrochemical cell
1.2. Environmental compensation
All air quality instruments are susceptible to environmental fluctuations. For
example, the temperature sensitivity of the aerosol absorption photometer’s
LEDs, photodiodes, and other electronic components results in erroneous
or inaccurate BC measurements during rapid environmental changes, such
as may be expected diurnally when the sensor is deployed outdoors. The
ObservAir incorporates proprietary hardware and software features to
minimize the sensor’s environmental dependence.
Hardware compensation features include the aerosol absorption
photometer’s active reference filter. Since the sampled air flow is actively
drawn through the reference filter, the transmitted light intensity is largely
dependent on the flow’s temperature and humidity content. By passing the
same air through both filters and monitoring each intensity measurement
independently, the ObservAir corrects for the photometer’s environmental
sensitivity and other measurement artifacts (e.g., water absorption in the
filter). Similarly, the electrochemical cells’ reference voltage outputs are
logged independently and used to compensate gaseous concentration
measurements. The sensor is also outfitted with temperature control
hardware and other proprietary design elements that preserve
measurement accuracy in harsh environments.
While hardware features contribute significantly to correcting the
ObservAir’s environmental dependence, some sensitivity remains that must
be corrected by software. This software compensation centers on DST’s

8
ObservAir Operating Manual
proprietary environmental training approach. Prior to delivery, all ObservAir
units sample clean (‘zero’) air for at least 24 hours while being subjected
to fluctuating environmental conditions. Using the data collected during this
training period, the unique environmental dependence of each ObservAir
unit is modeled mathematically. The models are uploaded to each unit, and
used to correct air pollution concentration measurements in real-time. Each
ObservAir is delivered with its own unique zero-calibration sheet, as shown
in Figure 3 below. The calibration sheets show the sensor’s baseline
environmental dependence and measurement performance both before
and after compensation. The sensor also carries out regular calibration and
diagnostic checks of the underlying electronics, and includes other software
features to maintain and validate sensor performance.
Figure 3. Each ObservAir comes with its own zero-calibration sheet
1.3. Base package contents
Each ObservAir comes with the following base set of accessories and
supplies:
• Magnetic cover
• 10 replacement filter tabs
• Micro-SD card with 16 GB capacity
• Charger (US Plug) and 3-foot (1 m) micro-USB cable
• 3-foot (1 m) length of conductive sample line
• Zero-calibration sheet (hardcopy)
• Quick-start guide (hardcopy)
9
ObservAir®Operating Manual
2. Technical Specifications
The ObservAir’s technical specifications are summarized in the tables
below. All electrochemical cells are sourced from Spec Sensors. Gas
measurement performance specifications are adapted from data provided
by the manufacturer, and where possible, DST validation of the
electrochemical cells in the ObservAir platform. All baseline measurement
noise specifications are derived from data collected while the ObservAir is
sampling clean (‘zero’) air. More information on the electrochemical cells
can be found at www.spec-sensors.com.
All measurement performance specifications are derived from ObservAir
data collected at a sample flow rate of 100 ccm near standard
atmospheric conditions: Temperature and relative humidity (RH) ranging
from 15 to 30ºC and 25 to 40%, respectively.
2.1. General specifications
Air pollution
measurement species
Standard: Black carbon (BC) aerosol
Optional: CO, NO2, SO2, H2S, O3, ethanol (up to 2)
Principle of operation
Black carbon: Filter-based light absorption (880 nm)
Gases: Electrochemical cells
Communications
Standard: Wi-Fi, Bluetooth, USB
Optional: LTE, LoRa, SigFox (choose one)
Sample air flow rate
50 to 200 ccm
Sample interval
2 to 60 seconds
Power consumption
1.2 W (at 100 ccm flow rate)
Battery life
≥24 hours (at 100 ccm flow rate)
Filter life
(BCavg = 1μg/m3)
Flow rate (ccm)
50
125
200
Filter life (days)
6.3
2.5
1.6
Data storage
Removable SD card (16Gb card provided)
Operating conditions
Temperature: 5 to 40ºC; RH: 15 to 80%
Dimensions/Weight
120 x 80 x 45 mm / 600 grams
Charging
5V DC at 2.1A max (microUSB and charger provided)
Table 2. ObservAir general specifications

10
ObservAir Operating Manual
2.2. Measurement performance
Table 3. Measurement performance specifications
Measurement
Range
Limit of
detection
Resolution Accuracy Precision
90%
response
(sec)
Power-on
stabilization
(min)
0 - 500 µg/m350 ng/m31 ng/m3± 5%* ± 3% 8 30
CO 0 - 500 ppm 2 ppm 0.1 ppm ± 3% ± 2% < 30 60
NO20 - 20 ppm 0.1 ppm 0.1 ppm ± 5% ± 5% < 30 60
SO20 - 20 ppm 0.3 ppm 0.1 ppm ± 3% ± 3% < 30 60
H2S0 - 50 ppm 0.3 ppm 0.1 ppm ± 2% ± 2% < 30 60
O30 - 20 ppm 0.1 ppm 0.1 ppm ± 2% N/A < 30 60
Ethanol 0 - 200 ppm 0.2 ppm 0.1 ppm ± 2% ± 2% < 60 30
Relative
Humidity
0 - 80 % N/A 0.1 %RH ± 1.5
%RH 0.2 %RH 10 < 1
Temp. 0 - 40 ºC N/A 0.1 ºC ± 0.2 ºC 0.15 ºC > 2 < 1
50 - 200 ccm 5 ccm 0.1 ccm ± 5% ± 3% 2 <1
*Relative to existing aerosol absorption photometers
Black Carbon
Gases
Enviro.
Flow Rate
11
ObservAir®Operating Manual
Data logging interval
2 sec
15 sec
1 min
1 hour
BC (μg/m3)
0.3
0.1
0.05
0.01
CO (ppm)
0.8
0.3
0.2
0.1
NO2(ppm)
0.5
0.2
0.1
0.05
SO2(ppm)
0.1
0.03
0.02
0.01
H2S (ppm)
0.3
0.3
0.3
0.3
O3 (ppm)
0.1
0.1
0.1
0.1
Ethanol (ppm)
0.2
0.2
0.2
0.2
Temperature (ºC)
0.01
RH (%)
0.01
Flow rate (ccm)
0.5
Table 4. Baseline measurement noise at various data logging intervals
2.3. Operational limits and warnings
• Environmental limits: Only operate the ObservAir within the conditions
listed in Table 1: Temperature and relative humidity must remain
between 5 to 40ºC and 15 to 80%, respectively. Exceeding these limits
may damage the sensor.
• Moisture/rain: Even when fitted with the weatherproof cover, the
ObservAir must not be directly exposed to rain or moisture of any kind
without an appropriate DST enclosure. When fitted with external
sampling lines, these must be fitted with rain covers or water catches
to ensure that water is not aspirated into the sensor. Exposure or
aspiration of moisture may permanently damage the sensor.
• Direct sunlight: Do not operate the ObservAir in direct sunlight for
extended periods without an appropriate DST enclosure. Doing so may
result in the sensor overheating, and/or erroneous data generation.
• Filter replacement: Filter tab must be changed regularly for best BC
measurement performance. Failure to replace the filter over extended
periods may result in damage to the pump. NEVER OPERATE THE
OBSERVAIR WITHOUT A FILTER TAB LOADED.
• Gas cells: Electrochemical cells must be calibrated regularly and
replaced every 2 to 5 years for best performance. Please contact DST
for information on our calibration services.

12
ObservAir Operating Manual
• Do not pressurize the sensor: Never connect the ObservAir to a
compressed gas cylinder (even when fitted with a regulator), air
compressor, or other pressure source without a purge valve that is open
to the atmosphere. Positive pressure air in the sensor can damage
sensing elements and other hardware.
• Charger: Only charge the sensor with the included charger or
equivalent 2.1A rated USB charger. The included charger is rated for
operation at both 110V/60Hz and 220V/50 Hz – simply adapt to local
plug style if needed. Do not use chargers rated above 2.1A or below 2.0
A. The ObservAir can also be charged from computer ports that are
rated to at least 500mA.
• Accessories: Do not use third party accessories with the ObservAir,
such as external battery packs, solar panels, etc. without first consulting
DST Technical Support.
• Replacement parts: Only use replacement parts provided by DST or an
authorized DST distributor.
• Disassembly: Never disassemble the unit, this voids the warranty and
may result in permanent damage to the unit and/or harm to the user.
problems with your unit that cannot be resolved with the instructions
provided in this manual.
13
ObservAir®Operating Manual
3. Operating Instructions
3.1. Hardware overview
The ObservAir is shown in Figure 4 below. The sample air inlet and outlet
nozzles are located on the front panel, and are denoted by arrows facing
towards and away from each nozzle, respectively. The SD card slot and USB
port are also located next to one another on the sensor’s front panel. In
Figure 4, the aerosol filter tab protrudes from its dedicated slot through the
front panel, as it does during normal operation. On top of the sensor, there
is a thumbscrew for securing the aerosol filter tab, and the interactive LED
button for sensor control and feedback.
Figure 4. Overview of the ObservAir. Isometric view.
The serial number is engraved on the sensor’s bottom surface. Please
include this serial number when contacting DST technical support.
Figure 5. Bottom view of the ObservAir
Interactive LED Button
Thumbscrew
Aerosol filter tab
Inlet nozzle Outlet nozzle
SD card USB Port
Serial Number

14
ObservAir Operating Manual
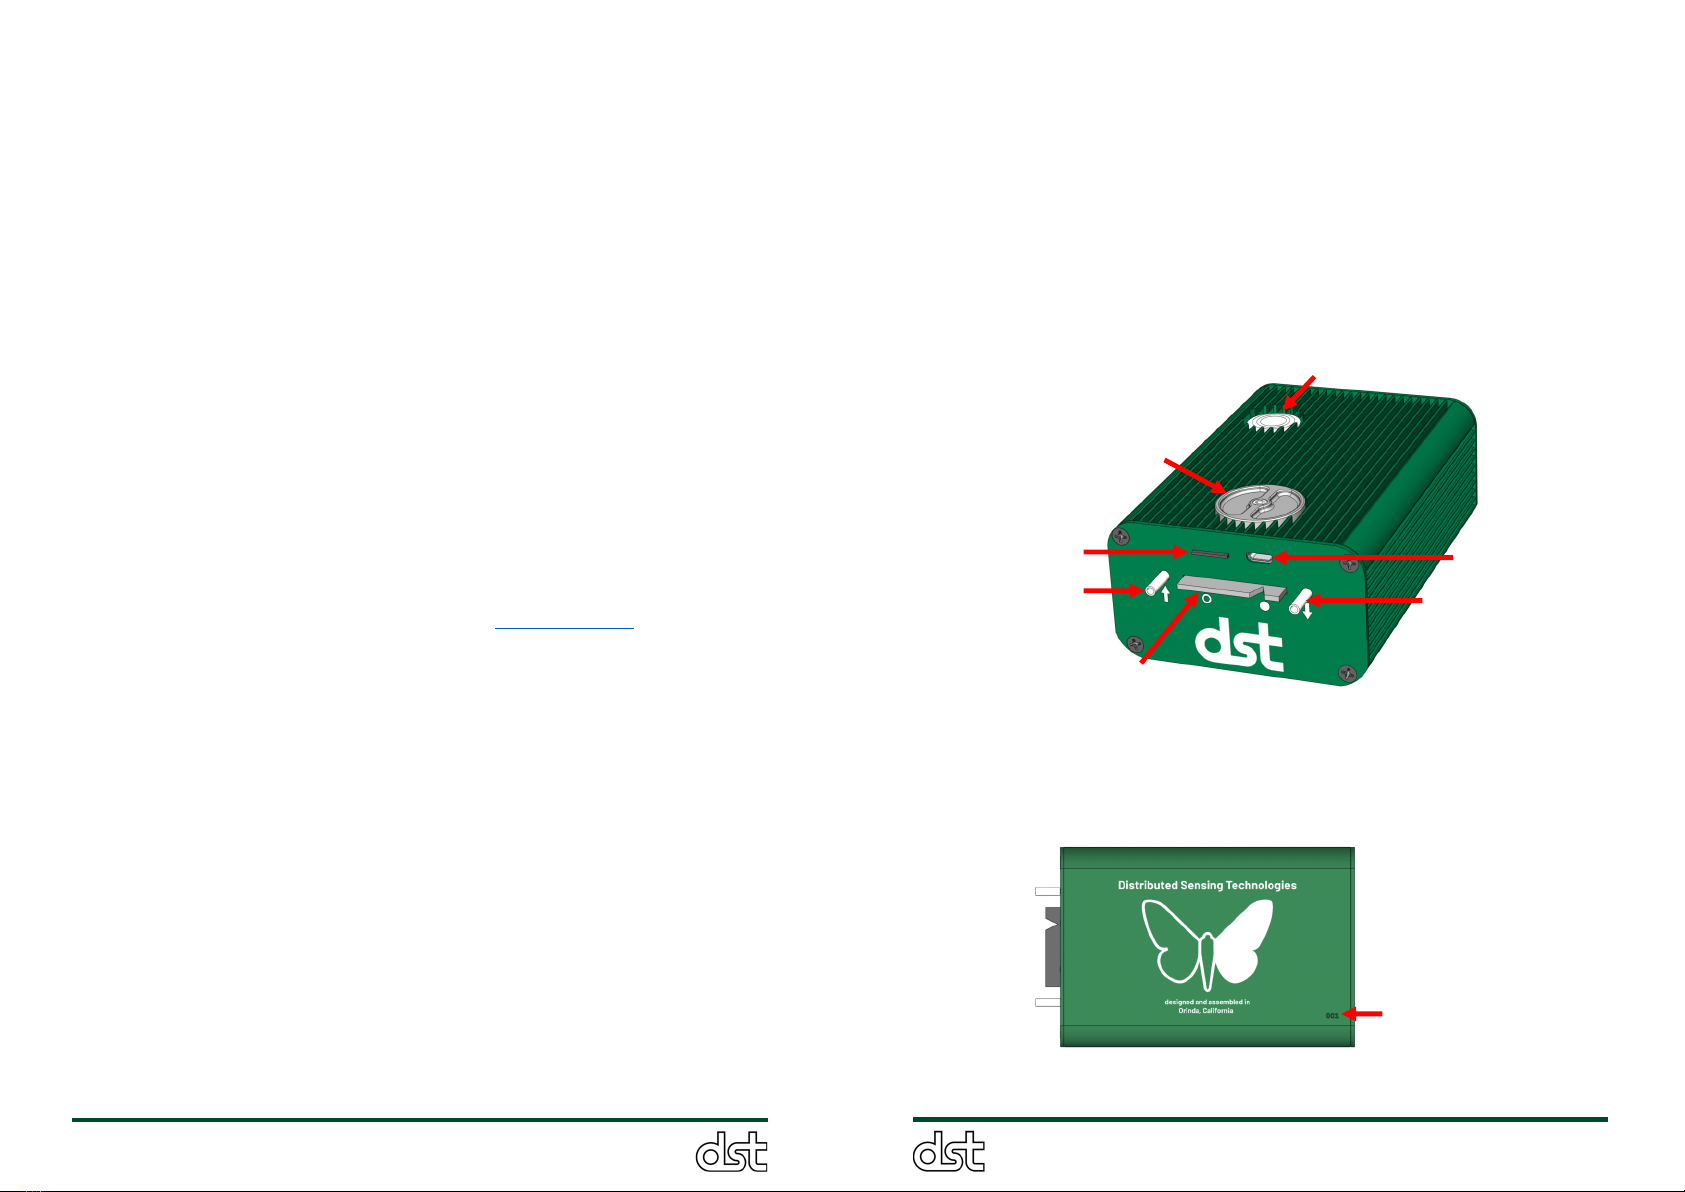
Each ObservAir comes with a magnetic cover, shown in Figure 6, that
mounts to the front panel and covers the USB port, SD card slot, and filter
tab to protect the sensor from moisture and dust penetration. The cover
simply slips over the inlet and outlet nozzles, and magnetically adheres to
the front panel. When not in use, the magnetic cover conveniently sticks to
the rear of the sensor for storage. Figure 7 shows the magnetic cover both
in use and in the storage position. The magnetic cover is also used to hard
reset the sensor as described in Section 6.2.
Figure 6. Magnetic cover being mounted to front plate.
Figure 7. Magnetic cover (a) in use on the front panel and (b) in the
storage position on the rear of the sensor.
3.2. Interactive LED button: Sensor display and control
The ObservAir’s interactive LED button is used to control basic operational
settings and display errors, pollutant concentrations, and other messages.
Magnetic
cover
Slip cover over nozzles, and
lock magnetically to front panel
(a) (b)
15
ObservAir®Operating Manual
3.2.1. Sensor startup
To turn on the sensor, press and hold the button for 5 seconds until the
LED flashes green, and then release the button. The LED will shine yellow
while initializing the bootup sequence then briefly flash red, green, and blue
in sequence to indicate that it is starting normal operating mode. If no
errors or alarms are detected, the LED will begin to indicate current
pollutant concentrations by ‘breathing’ slowly (see Section 3.2.2 below).
The sensor should be allowed to warm up for 15 minutes before measuring
black carbon concentrations, and 30 to 60 minutes before monitoring
gaseous pollutants. For every new start up event, a new data file is created
on the SD card (.txt file) and is assigned a filename that contains the
sensor’s ID number and the start-up time/date (Section 3.5.1).
3.2.2. Default LED mode: Pollutant concentration display
When the sensor is operating normally (no errors or faults to report), the
LED slowly glows on and off in a ‘breathing’ pattern. By default, the color of
the breathing LED ranges from green to red to indicate the current BC
concentration. Green corresponds to a BC concentration of 0 µg/m3, and
red represents concentrations that are higher than or equal to a user
defined maximum setting (factory default is 5µg/m3). LED colors are scaled
according to BC concentration between these two limiting values. For
example, yellow corresponds to a BC concentration of 2.5 µg/m3with the
default settings. The LED can also be configured to display gaseous
pollutant concentrations. After 20 minutes, the LED turns off automatically
to conserve battery power. The LED can be turned back on by pressing the
button briefly, and it will breathe to indicate pollutant concentrations for
another 20 minute period. This LED timeout period can also be set by the
user. For instructions on configuring the LED display settings, please see
Section 3.6.3.
3.2.3. Sensor menu Interface
To interact with the sensor, press and hold the button. The LED will cycle
through flashes of different colors and patterns that correspond to the
menu items listed in Table 5. When holding the button, the LED cycles
through the menu options in the order listed with two seconds in between
each option. After reaching the desired menu item, release the button, and
the LED will flash the menu item color to confirm the selection. To exit the
menu, press and hold the button through the entire menu selection, the
LED will start breathing normally, and you can release the button.

16
ObservAir Operating Manual
LED Flash Pattern
Sensor Function
1x Blue
Menu enter feedback
1x Green
Reset attenuation
1x Red
Power off
1x Blue
Reserved for future features
2x Blue
Provision WiFi settings
2x Purple
Firmware update mode
Table 5. Index of menu items displayed when holding down the LED
button. The LED display will cycle through the options in the order listed
until the button is released at the desired selection.
3.2.4. Attenuation reset
Optical attenuation (ATN) represents the filter’s BC loading. By definition, a
clean filter tab (devoid of any BC) has an ATN of exactly 0. However, since
the optical depth of each filter intrinsically varies, the light intensity
transmitted through the active and reference filters on the tab are not
always equal, and the apparent ATN through the clean filter is therefore not
equal to zero, as desired.
The ObservAir automatically detects when the filter tab has been
changed, measures the apparent ATN, and offsets the ATN data by this
value such that ATN = 0 when the filter is clean. If the sensor does not
automatically detect the filter change for any reason, the ATN can be
manually reset by holding the LED button until the first green flash and
releasing. The LED will flash green twice more to confirm the selection, and
the ATN will be set to zero for the current light intensity values.
3.2.5. Sensor shutdown
To turn off the ObservAir, hold the LED button to cycle through the menu
until the first red flash and release. The sensor will flash red two more times
to confirm that it is shutting down.
3.2.6. Sensor alarms and errors
When a measurement error occurs or an alarm is triggered, the LED button
continuously flashes red or yellow. The speed and color of the flashing LED
denotes different error codes. If the ObservAir displays an error, refer to
Section 5 for troubleshooting instructions to diagnose and resolve the issue.
Hold LED button:
Options appear in order.
Release for menu selection.
17
ObservAir®Operating Manual
3.3. Filter tab replacement
To change the filter tab, first release the thumbscrew by turning it
counterclockwise for about four full turns (Figure 8). Remove the filter tab
by pulling is straight out from the front of the sensor. The filter tab should
release from the sensor with little resistance. If there is any resistance,
further loosen and/or push down lightly on the thumbscrew to release the
filter tab. Second, insert a new filter tab with the notch aligned to the solid
white circle on the faceplate, as shown in Figure 9. Third, insert the new
filter as far as possible, such that the tip of the notch is flush to the front
panel, and hand tighten the thumbscrew firmly.
Figure 8. Step 1 of filter tab replacement: Loosen thumbscrew and
remove the filter tab
Figure 9. Step 2 of filter tab replacement: Insert a clean filter into the
sensor. Align filter notch with the solid white circle on the front panel.
Filter Align filters/notch on tab with
solid white mark
Notch

18
ObservAir Operating Manual
s
Figure 10. Step 3 of filter tab replacement: Push the filter tab into the
sensor until it is fully seated (notch should be flush with front panel) and
tighten the thumbscrew firmly.
It is best to change the aerosol filter while the ObservAir is powered off.
However, if this is not possible or inconvenient, the filter may also be
changed while the sensor is running. In this case, the LED button will flash
red rapidly while the filter is removed to indicate that an error is occurring.
When the filter is replaced and tightened, the LED will go back to normal
breathing mode, indicating current pollutant concentrations. If the LED
flashes red rapidly after replacement, check that the filter tab has been
inserted fully into the sensor and is properly aligned in the slot: The notch
on the tab should be directly above the solid white circle and flush with the
front panel. The sensor will automatically detect the new filter and reset the
ATN to 0. The ATN can also be reset manually (Section 3.2.4).
3.4. Battery charging
Whenever possible, the ObservAir’s internal battery should be recharged
using the included micro-USB cable and 2.1A power adapter. The sensor
charges fastest when it is powered off and connected to the 2.1A power
supply: a depleted battery will fully charge in about 5 hours in this
configuration. When the sensor is off and charging, the LED button shines
a solid and turns off when charging is complete. The sensor can also be
plugged into the charger while it is powered on and operating. The battery
will automatically recharge in this state, but at a lower charging current
than when the sensor is powered off. When in normal operation, the LED
button will briefly flash yellow once to indicate that a charging cable has
been successfully connected. The sensor will also trickle charge while
connected to a computer’s USB port.
Filter notch aligned with solid white mark.
Notch tip flush with front panel.
19
ObservAir®Operating Manual
3.5. Data collection from onboard SD card
While the ObservAir is operating, data is written to the onboard SD card in
real time as both a primary means of data collection and a reliable physical
backup when wireless data transmission protocols are implemented. By
default, the ObservAir creates a new data file every time it starts up. Each
file represents a data collection “mission”, and is called
“DataXXX_YYMMDD_HHhMMm.txt” where XXX represents the ObservAir
unit’s ID, followed by the date and time of startup. The SD card also
contains a file called “Settings_DataXXX.txt” (where again XXX represents
the unit’s ID) that contains a running log of the sensor’s operational
settings. A comprehensive overview of both files’ contents is provided below.
3.5.1. Settings file
For each sensor mission, a new entry is appended to the settings file with
the corresponding data file name as the header. Each entry in the settings
file is composed of four sections:
1. Header: The name of the corresponding data file for which the listed
sensor settings apply.
2. Sensor Settings: This field contains information on the sensor’s
configuration and operational settings. Fields are defined below and
appear in the order listed.
a. SN Serial number.
b. ID: User assigned sensor ID. Default is the unit’s SSN.
c. Version: Hardware version number.
d. Firmware: Firmware version number.
e. GAS1: First optional gas sensor mounted onboard.
f. GAS2: Second optional gas sensor mounted onboard.
g. flowRate:Sample flow rate setting in units of ccm. Default is 100
ccm.
h. samplePeriod: The data collection sample rate in seconds. Default
setting is 2 seconds.
i. envComp: DST’s proprietary environmental compensation
algorithms are active (‘True’) or pollution concentration
measurements are direct from the sensor(s) and uncompensated
(‘False’). Default setting is True.
j. DLPFilter: Digital low pass (DLP) filter is active (‘True’) or turned off
(‘False’). The DLP filter decreases measurement noise but increases
the minimum 90% response time from ~2 to 8 seconds when
monitoring BC concentrations. Gas measurement response time is
minimally affected. Default setting is True.

20
ObservAir Operating Manual
k. LEDmode:Pollution concentration data displayed using the LED
button in breathing mode. The LED can also be set to display only
sensor alerts, or be turned off completely. Options are ‘BC’, ‘GAS1’,
‘GAS2’, ’ALERT’, or ‘OFF’. Default setting is ‘BC’.
l. LEDra: Running average, in seconds, applied to the pollution
concentration data displayed using the LED button. Lower running
average values provide higher time resolution but the LED color
display may fluctuate due to sensor noise, while higher running
average values provide a smoother display with lower time
resolution. Default setting is 90 seconds.
m. LEDmaxConc: Maximum concentration setting for the LED display.
Default is 5 µg/m3of BC (default LEDmode setting).
n. LEDtimeout: The time duration, in minutes, before which the LED
display turns off automatically. Default is 20 minutes.
o. maxATN: Maximum optical attenuation (ATN). When filter loading
is above this value, an alarm is triggered. Default is 80.
p. timeZone: Time zone in hours relative to GMT. For example, New
York is represented by “-4” (GMT- 4:00). Default is 0.
q. GPS: Optional GPS unit is logging when ‘True’ and powered off
when ‘False’. Default is ‘False’.
3. Factors: This field contains calibration and environmental
compensation factors for each pollutant species monitored onboard the
ObservAir unit. Most factors in this field are for DST’s internal protocols,
but those pertinent to the end user are listed below:
a. MAC: Mass absorption coefficient for BC determination (see
Section 1.1.1). Default value is 12.5 m2/g.
b. FRcal: Flow rate calibration factor. Default value is 1.0.
c. Code1: Calibration code for the first optional gas sensor in units of
nA/ppm. Each gas sensing cell has a unique code from the
manufacturer (see Section 1.1.2).
d. Code2: Calibration code for the second optional gas sensor
(nA/ppm).
4. colNames: Names of the fields logged in the data file as they appear
on each line. For the base unit ObservAir, without gas sensing, the
following column names will be listed
a. TS: Timestamp in the format: YYYY-MM-DD HH:MM:SS
b. Iref: Reference intensity from the aerosol absorption photometer.
Value is expressed in terms of the ADC’s raw count. Full scale value
is 8388607.
21
ObservAir®Operating Manual
c. Isig: Signal intensity from the aerosol absorption photometer. Value
is expressed in terms of the ADC’s raw count. Full scale value is
8388607.
d. ATN: Optical attenuation (unitless)
e. BC: Black carbon in µg/m3
f. T: Temperature in ºC.
g. RH: Relative humidity in %.
h. FR: Sample flow rate in ccm.
i. VBAT: Battery voltage in volts.
If the unit has a single gas sensor onboard, the following columns will
be appended to those above:
a. GAS1: Gas concentration in ppm (except for NO2, which is in ppb).
b. Vg_ref1: Reference output from electrochemical cell in volts.
c. Vg_sig1: Signal output from electrochemical cell in volts.
If the unit has two gas sensors onboard, the following columns will be
appended to those above:
a. GAS2: Gas concentration in ppm (except for NO2, which is in ppb).
b. Vg_ref2: Reference output from electrochemical cell in volts.
c. Vg_sig2: Signal output from electrochemical cell in volts.
3.5.2. Data file
The ObservAir data is written in comma separated value (csv) format to a
.txt file. Each line in the file represents a datalogging event, and starts with
the character “$”. Values are listed in the order provided in the colNames
field of the corresponding setting entry. Typical data output from a base
model ObservAir (without gas sensing) is shown below. If gas sensors are
fitted to the unit, the output data will be appended to each line in the order
listed in the colNames field.
$2020-09-15 23:21:26, 6889274, 7486915, 0.4477415,-0.5281, 37.70047, 32.93088, 99.6, 7.66
$2020-09-15 23:21:28, 6889416, 7487140, 0.4477730, 0.0924, 37.63485, 32.93088, 100.3, 7.66
$2020-09-15 23:21:30, 6889638, 7487262, 0.4473400, -1.2549, 37.52956, 32.91753, 100.3, 7.66
$2020-09-15 23:21:32, 6889808, 7487379, 0.4477415, 1.1772, 37.58144, 32.91753, 100.3, 7.66
$2020-09-15 23:21:34, 6890005, 7487519, 0.4491062, 4.0048, 37.62112, 32.93088, 100.3, 7.66
$2020-09-15 23:21:36, 6890185, 7487705, 0.4500246, 2.6575, 37.72641, 32.93088, 100.3, 7.66
$2020-09-15 23:21:38, 6890353, 7487792, 0.4502516, 0.6841, 37.72336, 32.91753, 100.3, 7.66
$2020-09-15 23:21:40, 6890537, 7488002, 0.4504004, 0.4360, 37.73556, 32.90417, 100.3, 7.66
$2020-09-15 23:21:42, 6890700, 7488091, 0.4514685, 3.1003, 37.69894, 32.91753, 100.3, 7.66
$2020-09-15 23:21:44, 6890863, 7488192, 0.4526644, 3.5079, 37.72641, 32.93088, 100.3, 7.66
$2020-09-15 23:21:46, 6891009, 7488308, 0.4539852, 3.8455, 37.76455, 32.94423, 100.9, 7.66
$2020-09-15 23:21:48, 6891181, 7488379, 0.4539719, -0.0397, 37.71267, 32.91753, 99.6, 7.66
$2020-09-15 23:21:50, 6891322, 7488435, 0.4555502, 4.6042, 37.64859, 32.93088, 100.3, 7.66
$2020-09-15 23:21:52, 6891469, 7488522, 0.4567795, 3.5648, 37.67300, 32.93088, 100.3, 7.66
$2020-09-15 23:21:54, 6891617, 7488534, 0.4580860, 3.7495, 37.66232, 32.93088, 100.3, 7.66

22
ObservAir Operating Manual
3.6. Computer (serial USB) connection
The ObservAir can stream data and receive commands via a USB serial
connection to a computer. While any serial monitor may be used to
communicate with the sensor, we recommend the free and open source
Arduino Serial Monitor for the basic operations outlined in this manual. A
dedicated computer interface is under development for the ObservAir, and
will be made available to all users at no cost.
3.6.1. Connecting to Arduino Serial Monitor
Follow the steps outlined below to connect the ObservAir to the serial
monitor.
1. The latest Arduino IDE can be downloaded and installed from
https://www.arduino.cc/en/main/software
2. With the sensor turned on and operating normally without errors (LED
button is breathing slowly), connect the ObservAir to the computer
using the micro USB cable.
3. Open the Arduino software and select the ObservAir’s serial port from
the “Tools” menu. For Mac OSX, the port is called /dev/cu.usbserial-
DN43xxxx, as shown in Figure 11 below. Windows does not use port
naming, and so the port must be found by process of elimination.
4. In Arduino, open the “Serial Monitor” from the “Tools” menu.
5. From the pulldown menus at the bottom of the Serial Monitor, select
the “Both NL & CR” and “115200 baud” settings (Figure 12).
6. With the Serial Monitor configured, ObservAir data is displayed in real
time at the time interval set by the user. Commands can also be sent
to the sensor using the dialog box at the top of the Serial Monitor
window.
Figure 11. Step 3: Select the ObservAir communications port in Arduino
(Mac OSX shown here).
23
ObservAir®Operating Manual
Figure 12. Step 5: Screenshot of the Arduino serial monitor. Select “Both
NL & CR” and “115200 baud” from the pull down menus, as shown. The
screenshot shows typical live data stream from the ObservAir.
3.6.2. Serial data collection
Data can be aggregated through serial streaming, Serial data is streamed
in the same format as it is saved to the SD card (Section 3.5.1). Please note
that the Arduino Serial Monitor does not have data logging capability. Any
serial logging software can be configured to save ObservAir data using the
serial port settings in Table 6.
Port ID
DN43xxxx
Baud rate
115200
Data bits
8
Parity
None
Stop bits
1
Flow control
None
Table 6. Serial port settings
3.6.3. Sensor configuration: Serial commands
Commands can be sent over the Arduino Serial Monitor to configure the
ObservAir’s various operational settings. Most serial commands share the
same basic format: $cmd$val where ‘cmd’ is the name of command, and
‘val’ is the desired setting value. For example, the command ‘$setFR$100’
sets the sample flowrate to 100ccm. Table 6 documents all available
commands. All settings are saved to the SD card for each mission.

24
ObservAir Operating Manual
Command (cmd)
Value (val)
Function
$setID
0 to 1000
Set sensor ID
$setFR$val
30 to 200
Set sample flow rate in ccm
$setSamplePeriod$val
2 to 60
Set measurement period in seconds
$setTimeZone$val
-12 to 12
Set time zone in hours from GMT
$syncTime$
N/A
Sync time with internet server (Time
zone must be set)
$setTime$YYYY,MM,
DD,HH,MM,SS
date/time
Manually set clock to specified
date/time
$deviceInfo$
N/A
Returns all sensor settings
$setMaxATN$val
10 to 150
Set the maximum attenuation (ATN)
value, above which alarm is triggered
$ATNreset$
Reset the attenuation (ATN) to 0
$setLEDmode$val
BC, GAS1,
GAS2,
ALERT, OFF
Set the LED to pollutant concentration
display, alerts only, or turn off
$setLEDmaxConc$val
0.2 to 50
Set maximum concentration displayed
by LED button (red)
$setLEDra$val
60 to 3600
Set running average size (in seconds)
for the LED concentration display
$setLEDtimeout$val
0 to 60
LED display timeout duration in
minutes. 0 = LED on indefinitely.
$setDLPF$ val
0 / 1
Toggle the DLP filter applied to the
pollutant concentration data
$setEnvComp$val
0 / 1
Toggle DST environmental
compensation algorithms
$setLTE$val
0/1
Toggle LTE enable
$setGPS$val
0 / 1
Toggle GPS logging
$setGPSsample
Period$val
2 to 60
Set the GPS update period in seconds
$setGasSignals$val
0 / 1
Toggle logging of gas sensor(s) signals
$setSaveData$val
0 / 1
Toggle data logging (0 = no data is
being saved to SD card)
$setMAC$val
9.0 to 15
Set mass absorption coefficient (MAC)
$setFRcal$val
0.8 to 1.2
Set flow rate calibration coefficient
Table 7. ObservAir serial commands and descriptions
25
ObservAir®Operating Manual
3.7. WiFi connection
Provisioning WiFi credentials to the ObservAir allows the sensor to
automatically sync time, receive over the air (OTA) firmware updates and
technical support. In the future, cloud-based services and a mobile app will
also be available over the WiFi connections. Follow the instructions below
to provision WiFi credentials:
1. Cycle through the interactive LED button menu until the LED flashes
blue twice (provisioning mode).
2. The sensor will restart into provisioning mode, and slowly glow on and
off (‘breathe’) in a blue color to indicate that it is ready and
broadcasting a WiFi network.
3. From a computer or mobile device, log onto the “Our Product” WiFi
network.
4. A captive portal (Figure 13) will appear requesting your WiFi network’s
SSID and password. The ObservAir is only compatible with 2.4 GHz WiFi
networks.
5. Once credentials are submitted, the ObservAir will restart and begin
logging air quality measurements as usual.
Figure 13. Screenshot of the ObservAir’s captive portal, as viewed from a
mobile device. Enter you WiFi network’s credentials and press submit.
When WiFi credentials are provisioned, the sensor will be able to
automatically connect to the network and sync the internal clock time if a
timestamp error is detected while logging. During normal operation, the
WiFi module remains powered off. WiFi is only enabled during over-the-air
(OTA) firmware updates and technical support. WiFi credentials must be
provisioned using the instructions provided here prior to initiating any OTA
software features.

26
ObservAir Operating Manual
3.8. Firmware updates
As we continue to make improvements and introduce new features, new
versions of the firmware will be released using over-the-air (OTA) updates.
Please follow the instructions below to update your unit(s) firmware.
1. Setup an update appointment by emailing info@dstech.io. Please
include the phrase “OTA Update: SN” where SN represents your unit(s)
serial number(s).
2. Provision the unit(s) with your WiFi network’s credentials according to
the instructions provided here (Section 3.7).
3. During the time period scheduled with our team, turn on your ObservAir
unit(s) and cycle through the menu interface until the LED flashes
purple twice (OTA firmware update mode).
4. The ObservAir will restart into OTA firmware update mode, and breathe
purple once it is successfully connected to the internet and ready to
receive the update.
a. If a unit is unable to connect to a WiFi network, it will automatically
reboot into WiFi provisioning mode and breathe blue. Follow steps
3 to 5 in Section 3.7 to provision WiFi credentials.
5. With the LED breathing purple, plug the unit(s) into the wall charger
and wait for the units to receive the update.
a. If no update is received, OTA update mode will automatically turn
off and restart after 12 hours if no update has been applied. Please
check that your unit is on during the appointment scheduled with
DST staff.
6. After firmware update is received and applied, the sensor will blink
purple three times to confirm that the update was successful and will
then restart into the normal operating mode.
7. Turn off the unit(s), and remove the SD card to read the Settings file. In
the ‘Sensor Settings’ section, check that the ‘Firmware’ field has been
updated to the latest version (version number will be provided while
scheduling appointment with DST staff).
3.9. External sample lines
The ObservAir can be fitted with external sample lines that extend outside
an enclosure and/or pull air directly from a flow conditioning device (e.g. a
diluter or dryer). Sample lines should be made of soft rubber tubing with
an inner diameter (ID) of 3/32 inch, such that they fit snuggly over the
nozzles (1/8-inch outer diameter). Inlet lines must be electrically
conductive to prevent particle loss. McMaster-Carr part numbers 1909T3
and 5648K23 may be used for the inlet and exhaust lines, respectively.
27
ObservAir®Operating Manual
4. Maintenance and Calibration Procedures
4.1. Zero calibration of pollution sensors
Each ObservAir comes with a zero-calibration sheet, but it is good practice
to periodically verify the sensor’s baseline performance, especially before
and after deployments. To zero calibrate the BC sensor, an inline HEPA filter
(collection efficiency must be >99%) may be fitted on the inlet nozzle such
that no PM is sampled. DST distributes inlet filters for calibration, but HEPA
filters widely available for homebrewing are also typically adequate for this
purpose. If zero calibrating gas sensors, it is best practice to get a cylinder
of zero air (calibration gas that is devoid of any analyte species). To
conserve zero air, the ObservAir can be operated in a closed volume that is
filled with zero air: A high-quality Tupperware can easily be outfitted with
inlet/outlet valves for this purpose. Alternatively, the ObservAir may sample
a controlled flow rate of zero air from the cylinder. In this configuration, the
flow rate of zero air is set slightly higher than the ObservAir inlet flow, and
the excess zero air is vented to the atmosphere through a purge on the
sample line. This open system prevents pressurization of the ObservAir,
which can damage the sensor. Whichever calibration configuration is
chosen, the ObservAir should collect zero concentration data every 2
seconds for at least 24 hours at the desired flow rate setting. Using the 2-
second data collected, it is possible to determine the pollution sensors’
baseline noise levels at various measurement time intervals (1 minute, 1
hour, etc.). DST can also zero-calibrate ObservAir units, please contact
info@dstech.io for information on our calibration services.
4.2. Span calibration of pollution sensors
Span calibration of the ObservAir is not straightforward, particularly since
no calibration standards exists for BC. Typically, the best and most practical
method of span calibration outside of a dedicated laboratory or research
setting is collocation at a regulatory monitoring station. Using your local
environmental protection agency’s website (e.g., airnow.gov in the US),
locate an air quality monitoring station near you, and deploy your sensor(s)
as close by as possible (<1 km in all cases, but < 50 m is best). Depending
on the agency, it may be possible to contact your local branch or
representative and ask about collocation opportunities. In most cases, the
ObservAir can simply be left outside near the station for 24 hours with little
to no setup (no plug or connection required). Compare the data collected
by the ObservAir to that collected simultaneously at the regulatory station
and calibrate/adjust accordingly.

28
ObservAir Operating Manual
We recognize that regulatory monitoring stations with open data
access may not be available in many areas. Span calibration of the
ObservAir is a highly involved process that requires specialized equipment.
Some basic validation procedures may be added to this manual in the
future, but for the moment, please contact info@dstech.io to inquire about
our calibration services.
4.3. Flow rate calibration
The flow rate sensor is calibrated at DST prior to shipment, but sensor
output may drift over long periods (weeks or months of operation) and
should be re-calibrated periodically using the instructions below:
1. Turn on the ObservAir and allow it to warm-up for at least 15 minutes.
2. Connect ObservAir to a serial monitor (Section 3.6).
3. Set the ObservAir to the desired flow rate setting using the appropriate
serial command.
4. Connect a primary flow calibrator, such as a Gilian Gilibrator, to the
ObservAir’s inlet such that the sensor’s intake flow is measured.
5. Collect at least 5 flow rate measurements using the calibrator. The flow
rate measurements should not vary by more than ±1 ccm. Take the
average of all calibrator measurements: this is the reference value
(FRref).
6. From the serial output, collect at least 5 flow rate measurements from
the ObservAir and take the average: this is the measured value (FRm).
7. Calculate the calibration factor: FRcal = FRref/FRm
8. Update the sensor’s FRcal factor using the serial command (Section
3.6.3).
9. Repeat Steps 5 and 6 until the reference and measured values agree
within 2 ccm.
If a primary flow calibrator is not available, another flow rate sensor may be
used, but clearly the calibration is only as good as the reference
measurements collected.
4.4. Leak check
The ObservAir incorporates a monolithic design architecture that is more
robust than traditional instruments and less susceptible to leakage.
However, it is best practice to periodically check the integrity of the closed
flow path using the instructions below:
29
ObservAir®Operating Manual
1. Turn off the ObservAir
2. Replace the filter
3. Plug the ObservAir’s exhaust port. A simple plug may be fashioned by
tying a knot in a length of sample line (soft rubber tubing).
4. Connect a vacuum gun (e.g. a MityVac) to the inlet nozzle using a length
of sample line. The vacuum gun must be outfitted with a pressure
gauge.
5. Pump the gun until you achieve a vacuum pressure of –10 inch of H2O.
Note that the pressure may ‘bounce back’ after every pump – this is
normal and is a result of the filter’s flow resistance.
6. Monitor the vacuum pressure for about 1 minute to ensure that it
remains constant (the sensor is holding vacuum, and therefore not
leaking). The vacuum pressure may drop by up to –1 inch of H2O over
60 seconds. If the sensor meets or exceeds this criterium, it has passed
the leak check and may be deployed.
7. If the sensor fails the leak check, first tighten the thumbscrew by 1 full
turn and repeat steps 5 and 6.
8. If the sensor still fails, replace the filter and repeat steps 5 to 7.
9. If the sensor fails after these attempts, contact DST Technical support
at info@dstech.io (please include the unit(s) serial numbers in the
subject line).
Note: The ObservAir’s micropump can achieve a static vacuum pressure of
~2 inch of H2O and operates at << 1 inch of H2O when monitoring air
pollution. Therefore, some small vacuum loss is allowed at the –10 inch of
H2O setpoint, as this will not result in any perceptible leakage during normal
operation.

30
ObservAir Operating Manual
5. Best Practices
5.1. Filter replacement
As particulate matter deposits on the filter, the ObservAir uses a simple
mathematical relationship to calculate black carbon (BC) concentrations in
the sample flow as a function of the light attenuation rate through the filter
(Section 1.1.1). As the aerosol filter becomes overly saturated with BC
deposits, however, this underlying relationship degrades and the
ObservAir’s BC concentration measurements are underreported (lower
than the true value). This measurement degradation is known as the ‘filter
loading artifact’, and can be largely avoided by changing the aerosol filter
tab when the optical attenuation (ATN) values exceeds 80: a commonly
accepted ATN threshold for aerosol photometry at 880 nm. While some
measurement error persists below this threshold, it is usually small and
grows larger for higher ATN values. Therefore, it is best practice to only
operate the ObservAir while the optical ATN is < 80, and replace the filter
when this threshold value is exceeded.
Given this optical attenuation limit, the filter’s operational life before
requiring replacement depends only on the average BC concentration and
flow rate of air sampled through the sensor. For an average BC
concentration of 1 µg/m3,
Table 2 shows that the effective filter life ranges from 6.3 to 1.6 days as the
sample flow rate settings increases from 50 to 200 ccm. Filter life is
inversely proportional to both average BC and flow rate, and may be
calculated using the equation below. The equation approximates the total
sampling time required for the aerosol filter to reach an ATN of 80 for the
given input conditions.
𝐹𝐿=- 313.5
𝐵𝐶)-& ∙𝐹𝑅---------(5)
FL = Filter life (days)
BCavg = Average BC concentration (µg/m3)
FR = Flow rate (ccm)
5.2. Filter loading correction
While sensor operation at low optical attenuation levels largely eliminates
the filter loading artifact, this may not always be practical and convenient,
and some BC measurement error necessarily remains. As a result, many
filter loading correction algorithms have been developed to compensate
aerosol absorption photometers’ BC measurements as a function of optical
attenuation. These empirical corrections are well documented and
31
ObservAir®Operating Manual
generally straightforward to implement. However, the filter loading artifact
is not static – it depends on the emissions source (e.g. biomass vs. diesel),
atmospheric conditions, seasonality, and other factors. Therefore, filter
loading correction algorithms should be calibrated and validated for each
particular application of the ObservAir, and periodically updated over long-
term deployments. Standard filter loading correction procedures for the
ObservAir are under development, and will be released in future versions of
this manual. Helpful resources on the filter loading artifact are provided
below.
Filter loading correction resources:
1. Good, N.; Mölter, A.; Peel, J. L.; Volckens, J. An Accurate Filter Loading
Correction Is Essential for Assessing Personal Exposure to Black Carbon
Using an Aethalometer. J. Expo. Sci. Environ. Epidemiol. 2017, 27 (4),
409–416. https://doi.org/10.1038/jes.2016.71.
2. Jimenez, J.; Claiborn, C.; Larson, T.; Gould, T.; Kirchstetter, T. W.;
Gundel, L. Loading Effect Correction for Real-Time Aethalometer
Measurements of Fresh Diesel Soot. J. Air Waste Manag. Assoc. 2007,
57 (7), 868–873. https://doi.org/10.3155/1047-3289.57.7.868.
3. Virkkula, A.; Mäkelä, T.; Hillamo, R.; Yli-Tuomi, T.; Hirsikko, A.; Hämeri,
K.; Koponen, I. K. A Simple Procedure for Correcting Loading Effects of
Aethalometer Data. J. Air Waste Manag. Assoc. 2007, 57 (10), 1214–
1222. https://doi.org/10.3155/1047-3289.57.10.1214.
5.3. Flow rate setting: Filter life vs. BC resolution
The filter’s operational life decreases at higher flow rates, so it may be
tempting to set flow rate at the lowest possible option (25 ccm) and
minimize sensor maintenance. However, effective BC measurement
resolution also depends on flow rate: Since the filter loads up with BC more
rapidly at higher flows, the time rate of light attenuation is more readily
detectable, and BC baseline noise decreases. BC baseline noise represents
the sensor’s effective measurement resolution and is shown for various
sampling intervals in Table 4 for a flow rate of 100 ccm. BC baseline noise
is inversely proportional to the sample flow rate. For example, 1-minute BC
noise is around 0.025 µg/m3at 200 ccm (half that shown in Table 4 for
100 ccm). In this way, higher flow rates provide measurements with higher
temporal resolution, but at the expense of filter life. The optimum flow rate
setting maintains adequate BC measurement resolution for the monitoring
application while maximizing filter life such that sensor maintenance
remains convenient and practical. The procedure below outlines the
calculation and selection of an appropriate ObservAir flow rate setting.

32
ObservAir Operating Manual
1. Determine BCavg and logging interval: Both of these parameters
depend on the sensor application and must be determined by the user.
The average BC concentration (BCavg) during the campaign can be
estimated by (1) searching the literature or regulatory databases for
representative BC concentration data, or (2) conducting preliminary
testing with the ObservAir at a flow rate setting of 100 ccm. The logging
interval is dictated by the application context and goals. For example,
long-term ambient monitoring may only require hourly measurements,
while mobile platforms require rapid data logging every 10 seconds or
less. In both cases, these parameters may simply be estimated to set
the sensor flow rate initially, and adjusted thereafter depending on the
results. As an example, we will choose values of 0.4 ug/m3and 1 hour
to illustrate each step in this procedure.
2. Calculate requisite BC measurement resolution: As a rule of thumb,
the baseline noise at the desired logging interval should be < 10% of
the expected BC concentration. So for our example, baseline noise
should be < 0.1*0.4 = 0.04 µg/m3 on an hourly basis.
3. Calculate the minimum allowable flow rate: From Table 4, find the BC
baseline noise at the requisite timebase (2 sec, 15 sec, 1 min, or 1 hour).
Since this noise specification is for a flow rate setting of 100 ccm, the
minimum required flow rate can be estimated using the equation
below. For our example, Table 4 shows that the baseline BC noise at 1
hour is 0.01 µg/m3, so the minimum flow rate is (0.01/0.04)*100 = 25
ccm. Note that the results of this calculation are bounded by the
ObservAir’s minimum and maximum flow rate settings: 25 and 200
ccm respectively.
𝐹𝑅.%/ =-𝑁𝑜𝑖𝑠𝑒$0"1
𝑁𝑜𝑖𝑠𝑒!"2 ×100ccm---------(6)
FRmin = Minimum allowable flow rate (ccm)
Noisespec = Baseline specification from Table 3 (µg/m3)
Noisereq = Maximum BC noise calculated in Step 2 (µg/m3)
4. Calculate the maximum filter life: Using the average BC concentration
from Step 1 and minimum flow rate setting from Step 3, calculate the
filter life according to the equation provided in Section 4.1. In our
example, the maximum filter life is 313.5/(25*0.4) = ~31 days.
5. Optimize the flow rate to meet your needs: Given these limiting values,
the flow rate setting can be optimized to meet your needs. For example,
if greater BC measurement resolution is desired at the expense of filter
life, the flow rate can be increased past the minimum value. Conversely,
flow rate may be reduced to achieve the opposite result.
33
ObservAir®Operating Manual
For reference, Table 7 shows the ObservAir’s minimum flow rate
setting and maximum filter life as a function of average BC concentration
and data logging period. The values in the table are calculated according
the procedure presented above. Two illustrative scenarios are also provided.
Data logging period
2 sec
15 sec
1 min
1 hour
Avg. BC
0.5 µg/m3
N/A
200/3.1
100/6.3
25/25.0
1 µg/m3
200*/1.6ª
100/3.1
50/6.3
25/12.5
5 µg/m3
60/1.0
25/2.5
25/2.5
25/2.5
10 µg/m3
30/1.0
25/1.3
25/1.3
25/1.3
Minimum Flow Rate (ccm)*/ Maximum filter life (days)ª
Table 8. ObservAir’s minimum flow rate setting and maximum filter life as
a function of average BC concentration and data logging period. The
ObservAir cannot provide BC concentration data with a baseline noise <
0.05 µg/m3on 2-second basis, so the top left cell is empty.
• Scenario 1: BCavg = 7 ug/m3, Logging interval = 2 seconds
For this scenario, the BC baseline noise should be ≤0.7 µg/m3at 2-second
logging. Using the calculation procedure above, the minimum flow rate
setting is (0.3/0.7)*100 = 43 ccm. For these settings, the maximum filter
life is ~1 day. Alternatively, refer to Table 8 and see that for 2-second
measurements of 5 µg/m3average concentrations, the flow rate setting is
60 ccm. By interpolation, the flow rate can be set to 60*7/5 = 43 ccm.
• Scenario 2: BCavg = 0.35 ug/m3, Logging interval = 1 minute
The BC baseline noise should be from ≤0.035 µg/m3at 1-minute logging.
From Table 1, the noise is 0.05 ug/m3 at 1-minute and 100 ccm, so the
minimum flow rate is (0.035/0.05)*100 = 70 ccm. In Table 8, a flow rate
of 100 ccm is recommended for 1-minute measurements at 5 µg/m3. By
interpolation, the flow rate can be set to 100*0.35/0.5 = 70 ccm. The filter
life can be calculated as 313.5/(0.35*70) = 12.8 days.
IMPORTANT NOTE: The above considerations do NOT apply to gas
sensing. The gas sensors’ measurement performance remains largely
constant with flow rate. Only the gas sensors’ time response is affected by
flow rate, simply because of the residence time of sample air through the
sensor’s closed volume naturally varies. At higher flow rates, the residence
time diminishes and the gas cells respond more rapidly.

34
ObservAir Operating Manual
5.4. Operational settings for common applications
Table 9 provides typical BC concentrations and operational settings for
some common sampling scenarios. Note that the guidance provided is
approximate and mostly meant to serve as an illustrative guide: Some
applications may not be well described/served by the parameters listed.
Table 9. General settings for several monitoring applications
• Ambient monitoring: When deploying the ObservAir as a static network
node over long periods (weeks or months), the flow rate should be set
as low as possible to maximize filter life and reduce the maintenance
effort, especially when network sites are remote or numerous. Ambient
monitoring applications typically require data with low temporal
resolution – hourly measurements are often sufficient – and this helps
reduce the flow rate requirements. Referring to Table 8, it can be seen
that the minimum flow rate setting of 25 ccm provides suitable hourly
measurements for nearly all BC concentrations. However, it should be
noted that this achieves a nominal BC measurement resolution that is
~10% of the average concentration, which may not be sufficient for all
applications (e.g., regulatory monitoring). If greater resolution is desired,
flow rate should be increased to the values listed in Table 9. Similarly,
special consideration should be given when conducting long-term
monitoring in rural or remote areas with BC concentrations < 0.5
µg/m3. In these scenarios when filter loading is low, it is generally
advisable to operate the sensor at a high flow rate setting (100 to 200
ccm) to maintain BC measurement integrity.
Average BC
(µg/m3)
Flow rate
(ccm)
Time
Resolution
Filter life
Ambient:
Background/rural
Low
(0 to 1)
High
(100 to 200)
Low
(1 hour)
High
(Weeks/Days)
Ambient:
Typical
Medium
(0.3 to 5)
Medium
(50 to 100)
Low
(1 hour)
High
(Weeks/Days)
Ambient:
Dense Urban
High
(5 to 50)
Low
(25 to 50)
Low
(1 hour)
Medium
(Days)
Emissions capture
(direct source)
Extreme
(> 100)
Medium
(50 to 100)
Medium
(10 to 60 sec)
Very low
(Hours)
Mobile/Personal
Medium/High
(0.3 to 50)
High
(100 to 200)
High
(2 to 10 sec)
Low
(1 day)
35
ObservAir®Operating Manual
• Emissions source characterization: The ObservAir can be configured to
characterize emissions from stationary exhaust stacks, vehicle tailpipes
and other pollution sources. When sampling emissions directly, do not
exceed the ObservAir’s maximum temperature, relative humidity range,
and pollution concentration ratings (Table 3). As with other instruments,
the ObservAir may require that emissions from the source be diluted,
cooled, and/or dried. For transient monitoring applications, such as
engine testing, measurements are typically required every 2 to 10
seconds, and therefore the ObservAir’s sample flow rate must usually
be set >100 ccm to maintain adequate measurement resolution. When
sampling over long periods (stack monitoring over hours or days), the
sample flow rate may be lowered to 25 or 50 ccm to maximize filter
life, especially when concentrations are highly elevated. Sampled
concentrations depend on the source and flow conditioning system
implemented (e.g. diluter), but it is not unusual for BC concentrations
to exceed 100 µg/m3when capturing emissions directly.
• Mobile monitoring: When sampling from a mobile platform,
measurements must be logged as fast as possible to maintain adequate
spatial resolution required for the air pollution maps that are ultimately
generated. Therefore, the ObservAir should be configured to log
concentration data every 2 to 10 seconds at the maximum flow rate
setting of 200 ccm to maximize the temporal resolution of both BC and
gas concentration measurements. Always operate the ObservAir inside
the mobile platform (e.g. car or van) with an electrically conductive
sample line running outdoors. Do not mount sensors on the exterior of
mobile platforms without the dedicated DST mount and enclosure.
When mounting the ObservAir inside the mobile monitoring platform,
take care to minimize exposure to mechanical vibrations, excessive heat
and/or direct sunlight over extended periods.
• Personal monitoring: Personal monitoring guidelines largely mirror
those provided for the mobile platform: Operate the sensor at a high
sample flow rate (100 to 200 ccm) to maximize the quality of BC
measurements collected every 2 to 10 seconds. Depending on the
application and concentrations sampled, some consideration may be
given optimizing the flow rate for filter life (e.g., each filter lasts a full 8-
hour workday). The sensor may be mounted inside a bag or from a
strap (such as those provided by DST), but take care to clip an
electrically conductive sample line to the subject’s lapel or other
appropriate location.

36
ObservAir Operating Manual
5.5. Indoor/Outdoor monitoring guidelines
The ObservAir can be operated in nearly any indoor environment without
modification: The sensor is plugged into a power source and set to run for
as long as needed. The magnetic cover provides good moisture and dust
protection for more demanding operating environments, including
outdoors, as long as operating limits are not exceeded and direct exposure
to water (rain) is avoided. Exposure to direct sunlight should also be avoided
over extended periods, as this may cause overheating of the internal
components. With the magnetic cover fitted, the sensor cannot be plugged
in to recharge, limiting the deployment time to about 24 hours.
For long-term outdoor deployments, the ObservAir should be
housed in a weatherproof enclosure, such as those provided by DST. It is
best to orient the sensor with the nozzles facing downwards to prevent the
aspiration of rain or moisture. In extreme environments that exceed the
sensor’s operational limits (e.g., freezing conditions), temperature
controlled enclosures should be used. If operating in temperatures below
5˚C, DST offers the heated SubZero™ case: a tough, hermetically sealed
enclosure that is specifically designed for long winter deployments.
5.6. Accurate sample flow rate measurements are critical
BC concentrations are inversely proportional to the flow rate of air drawn
through the aerosol filter (see Section 1.1.1), so any flow measurement
errors translate directly to the reported BC. For example, if the ObservAir’s
flow rate measurements are 10% lower than the actual value, BC
concentrations will be overreported by 10%. Given this proportional
relationship, flow rate measurement drift can be post-corrected. In the
example above, all collected BC concentration measurements can simply
be scaled up by 10% to compensate for the flow rate drift.
When BC measurements are consistently offset from those
collected by another ObservAir or reference instrument, miscalibration of
the flow rate sensor is almost always responsible. If BC measurements are
proportionally lower than the reference value, then it is also possible (but
less likely) that the ObservAir is leaking. Given these potential error modes,
it is important to validate/calibrate the flow rate sensor output and perform
leak checks regularly (see Section 4 for instructions). Since it is not typical
for the ObservAir to leak or for the flow rate sensor’s output to drift
significantly, these routine maintenance tasks are often neglected, and are
nearly always the source of BC measurement errors when they do occur.
When properly calibrated, the ObservAir’s flow rate measurements should
be within ±2 ccm of those collected with a primary flow calibrator.
37
ObservAir®Operating Manual
6. Troubleshooting
6.1. LED error codes
The ObservAir constantly runs diagnostic checks to detect and flag
measurement errors and warnings. When an error is detected, the LED
button flashes rapidly until the error is resolved. The color and speed of the
flashing LED indicates the error type, as shown in Table 10 below. Brief
instructions on how to resolve each error type are also provided.
LED Flash Pattern
Error
Solution
Slow
Yellow
High
attenuation
Replace filter.
Fast
Yellow
SD card
error
Check that SD card is properly
inserted. Take SD card out fully
and re-insert into the slot.
Very Fast
Yellow
Clock error
Reset time according to the
instruction in Section 3.6.3.
Slow
Red
LED error
Check that filter is properly
seated. Replace with new filter.
Fast
Red
Flow rate
error
Check that nozzles and sample
lines are unobstructed.
Very Fast
Red
Critical
error
Contact DST Technical Support.
Table 10. LED error code lookup table.
6.2. Unresponsive sensor
If the ObservAir becomes unresponsive, the software may have crashed and
a hard reset is required. A hard reset can be triggered by swiping the
magnetic cover over the top of the sensor (Figure 14). A magnetic detector
is located inside the sensor just below the interactive LED button, and will
trigger a hard reset when exposed to the magnets in the cover. When a hard
reset is triggered, the LED will flash green and the sensor will restart into
the normal operating mode. If the sensor becomes unresponsive often or
on a regular basis, please contact DST Technical Support.

38
ObservAir Operating Manual
Figure 14. Hard reset using the magnetic cover
Other manuals for ObservAir
1
Table of contents
Other DST Accessories manuals
Popular Accessories manuals by other brands

ORION TELESCOPES & BINOCULARS
ORION TELESCOPES & BINOCULARS Stratus 08244d instruction manual

Reiner
Reiner jetStamp 790 operating instructions

KNX
KNX AQS/TH-UP Touch Installation and adjustment manual

IFM Electronic
IFM Electronic efector 200 OGT Series operating instructions

Osram
Osram LEDVANCE 4058075814677 operating instructions

Summit Treestands
Summit Treestands 82072 manual