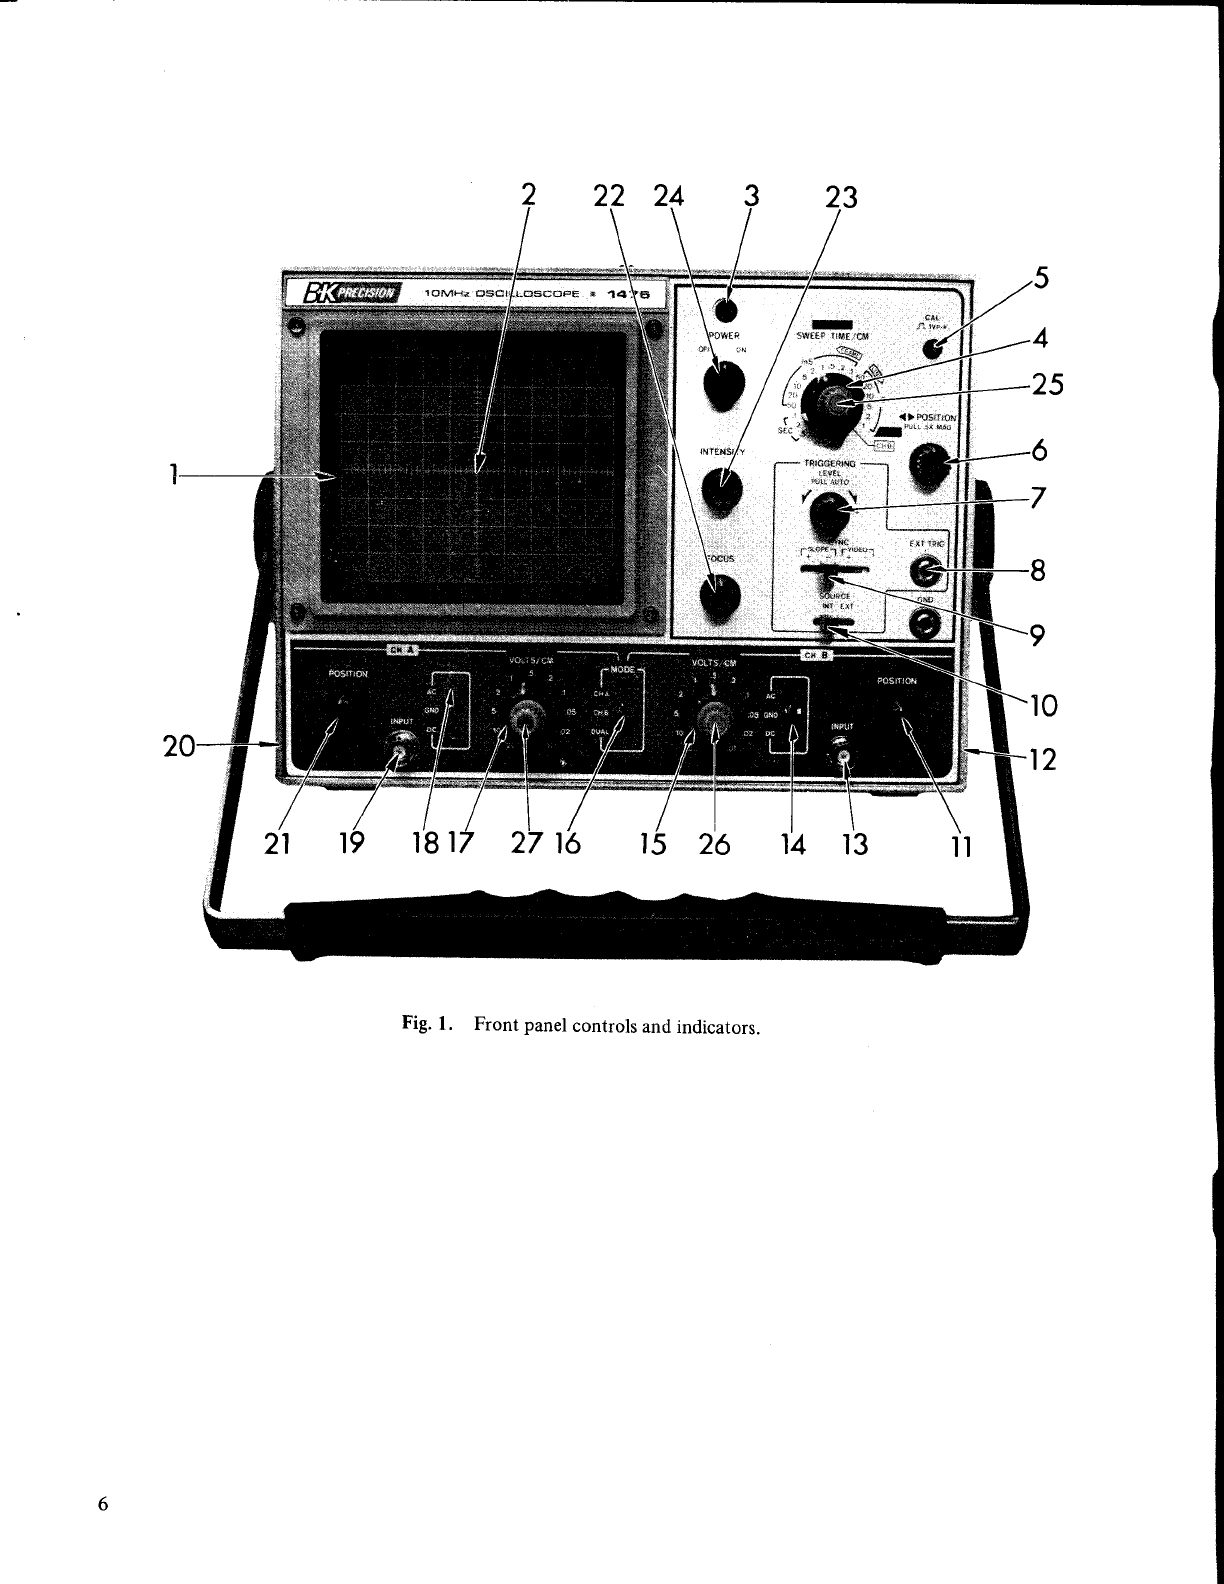
Dynascan Corporation B+K PRECISION 1476 User manual

@L476
10 MHz,
TRIGGERED
SWEEP
Dua
l-T
race
Osci
Iloscope
@"o#6FmN

WARNING
Normal useof test equipmentexposes
you to a certain
amountof danger
from
electricalshockbecause
testing
must often be performed
whereexposedvoltage
is
present.
Anelectricalshock
causingl0 milliamps
of current
to pass
throughtheheartwill
stop most humanheartbeats.
Higher
vollages
pose
an even
greater
threat
because
such
voltages
canmoreeasily
produce
alethalcurrent.However,
voltage
aslow as
35volts
DC
or AC RMSshouldbeconsidereddangerous
andhazardous
sinceit can
produce
alethal
currentundercertainconditions.Your normalworkhabitsshouldincludeallaccepted
practices
that will prevent
contactwith exposedhighvoltage,and
that will steer
current
away from your heart in case
of accidentalcontact with a high voltage.You will
significantlyreducethe risk factor if you know and observethe following
safety
precautions:
1.
Don't exposehigh voltageneedlessly.Remove
housingsand covers
only when
necessary.
Turnoff equipment
whilemaking
test
connections
inhighvoltagecircuits.
2.Use
an insulatedfloor material
or a large,insulated
floor matto standon,andan
insulatedwork surfaceon which to placeequipment;and
makecertain
suchsurfaces
are
not damp
or wet.Whereinsulatedfloor surfaceis
not available,wear
heavy
gloves.
3.Use the time-proven "one hand in the pocket" techniquewhile handling an
instrument
probe.
Beparticularly
careful
to avoid
contacting
a nearby
metal
object
thatcould
provide
a
goodground
return
path.
4.Always use an isolation transformer to power transformerless
"hot chassis"
equipment,whereonesideof the AC power
lineis
connecteddirectlyto thechassis.
This includesmostrecenttelevisionsetsandaudio
equipment.Without an isolation
transformer,
the chassis
of suchequipmentmaybefloating
atlinevoltage
(120VAC,
60 Hz in USA),dependinguponwhichwaythe2-wireAC power
plug
isinserted.
Not
only does
this present
a dangerous
shock
hazardif thechassis
istouched,
but damage
to test instrumentsor the equipmentundertest may resultfrom connecting
the
groundleadof some
test instruments
to a "hot" chassis.The ground
lead
of most
oscilloscopesand most other test instrumentswith 3-wirepower plugs
is an earth
ground.
5.On testinstrumentsor anyequipmentwith a3-wireAC powerplug,
useonly a3-wire
outlet.Thisis asafetyfeatureto keepthehousing
or other
exposed
elementsatearth
ground.
6.If possible,
familiarize
yourself
with the equipmentbeing
tested
andthe locationof
its high voltage points. However, remember that high voltage may appearat
unexpected
points
in defectiveequipment.
7.Also rememberthat AC line voltage
is present
on some
powerinput circuit points
suchason-offswitches,fuses,
power
transformers,etc.,
even
when
the
equipment
is
turnedoff.
8.Neverworkalone.
Someone
shouldbe
nearbyto renderaid
if necessary.
Training
in
CPR
(cardio-pulmonary
resuscitation)
firstaidishighlyrecommended.

INSTRUCTION
MANUAL
FOR
B
& K.PRECISION
MODEL
L476
10 MHz,
TRIGGERED
SWEEP
DUAL."TRACE
OSCILLOSGOPE
@BMFffiN
6460 WestC.ortlandStreet
Chicago,Illinois 60635

TABLE OF CONTENTS
Page
INTRODUCTION . 4
FEATURES
SPECIFICATIONS
OPERATOR'S
CONTROIS, INDICATORS AND FACILITIES .
OPERATING INSTRUCTIONS
Initial StartingProcedure
Single-Trace
Waveform
Observation
CalibratedVoltageMeasurement
CalibratedTime Measurement
ExternalHorizontal Input (X-Y Operation)
Z-Axis lnput .
Dual-Trace
Waveform
Observation
DUAL-TRACE APPLICATIONS
Introduction ... ... 14
FrequencyDividerWaveforms ....l4
Dvide-by-8CircuitWaveforms ....14
DigitalCircuitTimeRelationships .......14
GatedRingingCircuit .....l4
DelaylineTests...'.... ........16
StereoAmplifierServicing .......16
VideoEquipmentServicing .......17
9
9
l0
ll
t2
t2
t2
26
26
27
28
29
29
SINGLETRACE APPLICATIONS
Introduction
VideoEquipment
Servicing
Sigral Tracing
andPeak-to-Peak
VoltageReadings
Composite
Video WaveformAnalysis
SyncPulse
Analysis
VITS (Vertical lnterval TestSigral)
Vectorscope
Operation
TELEVISION ALIGNMENT
Introduction
lmportance of SweepAligrrment
SweepAligrment Methods
Tuner Alignment
IF Alignment
ChromaAlignment
l8
l8
l9
l9
l9
2l
23

TABLE OF CONTENTS
page
FMRECEIVERALIGNMENT.. ....3I
PHASE
MEASUREMENT
FREQUENCYMEASUREMENT .... 33
SQUAREWAVE TESTING OF AMPLIFIERS
Introduction ...... 33
Testinghocedure ........34
AnalyzingtheWaveforms.... ....34
CIRCUIT DESCRIPTION
General ....38
VerticalPreamplifiers .....38
Mode
logic .. .. .. 38
VerticalAmplifier .......38
TriggerCircuit ....38
SyncAmplilierandlnverter
... ...38
AutoSweep ......40
HorizontalAmplifier .....4O
ChoppingOscillator ......4O
I VoltCalSignal ........40
PowerSuppty .....4O
BlockDagram ....50
I',IAINTENANCE
AND CALIBRATION.... ........ 40
WARRANTY
INSTRUCTIONS ..... 43
WARRANTY ........ 43
OPTIONALACCESSORIES... .....44
3l

The B & K-Precision
Model 1476Dual-Trace
Oscil-
loscope
is a laboratory-quality,
professional
instrument
for
observing
and measuring
waveformsin electronic
circuits.
Dual vertical
inputsare
provided
for simultaneousviewing
of two waveforms.
Low-frequency,low repetition rate
waveforms
arechopped
at a 200
kHz rate to providefor
simultaneous
viewing.Alternatesweep
of the two inputs
permits
simultaneous
viewingof high-speed,highrepetition-
ratewaveforrns.
The
dual-trace
feature,
together
with the l0 MHzband-
width, wide rangeof sweepspeeds,and high sensitivrt)
provided,
makethis theidealoscilloscope
for abroad
range
of applications,
includingtroubleshootingand repairing
electronicequipment,researchand development,and
laboratoryinstruction.
INTRODUCTION
FEATURES
DUALTRACE
FULLY
SOLIDSTATE
TRIGGERED
SWEEP
LARGE
SCREEN
CALIBRATED
VOLTAGESCALES
CALIBRATED
SWEEPSPEED
WIDEBANDWIDTH
WIDERANGEOF
SWEEPSPEEDS
Two input waveforms can be
viewed either singly or simul-
taneously,as
desired.
Only the cathode
ray tubeuses
a
filament. All other stagesuse
transistors,
diodes, FET's (field
effect transistors) and IC's.
The 1476's
stability
of waveform
pres€ntationsis beyondcompari-
son with non-triggered sweeP
oscilloscopes.
The sweeps
remain
at rest
until triggeredby thesignal
being observed,to assure
that
they are always synchronized.
Fully adjustable
trigger
threshold
allowsthe desired
portign of the
waveforms
to beused
for trigger-
ing. Waveforms can also be
synchronized
to an externalsync
trigger.
The 130mm (approx.
5.1inches)
diametercathoderay tube gives
easy-to-read
presentation
on an
8 x l0 cm rectangularviewing
area.
Accuratemeasurementof the
stantaneous
voltaeeson I Iln-
dif-
ferent attenuator
rangesfor both
ChannelA andChannelB.
Accurate time measurements
on
l8 differentranges.
DCto l0 MHz bandwidth
and
35
nSEC rise time assuredistortion-
free,high resolution
presentation
athighfrequencies.
Sweepspeed
rangeof 1pSEC/cm
to 0.5 SEC/cm provides every
speed
necessaryfor viewing
wave-
formsfrom DCto l0 MHz.
EXPANDED
SCALE
HIGH
SENSITIVITY
VIDEO SYNC
VECTORSCOPE
CALIBRATION
SOURCE
Z-AXIS
INPUT
MECHANICAL
FEATURES
A five time rtragrification (5X) of
the horizontalsweepallowsclose-
up examinationof a portion of
the waveform.In addition,
the5X
magnification provides a maxi-
mum sweep speed of 0.2
gSEC/cm.
Permits
thelow-capacitance,high-
impedance, l0:I attenuation
probes
to beusedfor virtually all
measurements,thus assuringless
circuit
loading.
A built-in syncseparatorcircuit is
included specifically
for viewing
television
signals. When using
VIDEO SYNC,
verticai
sync
pulses
areautomaticallyselectedat sweep
times of 0.5 SEC/cm to 0.
1
mSEC/cm for viewing television
frames. Horizontalsyncpulses
are
automatically selectedat sweep
timesof50
pSEC/cm
to I pSEC/cm
for viewingtelevisionlines.
The unit may be usedas
avector-
scopeto provide a color display
exactly asspeciiiedby color tele-
visionmanufacturers.
A built-in calibratedI volt peak-
to-peak square wave permits
checkingand recalibrationof the
vertical amplifierswithout addi-
tional
equipment.
Intensitymodulation
capability
in-
cludedfor timeor frequency
mar-
kers.Compatible
withTTL logic;
brightnessincreasesin logic high
state,decreasesin logic
low state.
Carrying handle with comfortable
moldedfingergripalsodoublesastilt
stand.Lockingdetenteach
22-l/2"
allowsadjustmentof viewing
angle.
Rear feet support oscilloscopein
face-up
position
anddoubleascord
wrapfor storing
power
cord. Slotted
bezeloverfaceof CRT mountsstan-
dardoscilloscopecameraformaking
waveform
photographs.

SPECIFICATIONS
VERTICALAMPLIFIERS
(CH
A andCH
B) Video Sync Verticaland
horizontal
syncs€parator
circuit providedsothat any portion of
composite
videowaveformcanbe
syn-
chronizedandexpanded
for viewing.
LINE (horiz.) and FRAME (vert.)
sync switched automatically by
SWEEPTIME/CM switch.
FRAME 0.5 SEC/cm to 0.1
mSEC/cm(vertical
syncpulses).
LINE : 50
pSEC/cm
to I pSEC/cm
(horizontal
syncpulses).
HORIZONTAL AMPUFIER (Horizontal lnput through
CHB Input)
Deflection
Factor .01V/cm to 20V/cm.
Frequency
Response DC to I MHz (- 3 dB).
Input Resistance I megohm
(nominal).
InputCapacity 22 pF (t3 pF).
Maximum Input 300 V (DC + AC peak) or 600 V
Voltage p-p.
X-Y Operation With SWEEP
TIMEICM switchin
CH B position, the CH A input
becomes
the
Y input (vertical)
and
the CH B input becomes
the X
input (horizontal).
TheCHB posi-
tion control becomesthehorizon-
tal position
control.
CALIBRATION VOLTACE
I V p-psquare
wave
(t 5%)
at line
frequency.
INTENSITY MODULATION
Voltage
Input Resistance
TTL logic-compatible,
highlogic -
increases
brightness;
low logic -
decreases
brightness.
l0 kO
(nominal).
POWER
REQUIREMENTS
Input 120
or 240
V AC, tlo7o, 5O/6OHz,
20 watts. (3-wire
linecord,CSA-
approved for oscilloscopes.) See
Fig.
51.
PR-31,
PR-35,PR-36,
PR-37.
Combination
l0: I anddirect.
l0:l = l0 megohms,
18
pF.
Direct= I megohm,
120
pF.
BNC
Spring-loaded,
hook-ontip.
Deflection
Factor
Calibration
Accuracy
Frequency
Response
Risetime
Overshoot
Ringing
InputResistance
InputCapacity
Max.Input Voltage
Operating
Modes
ChopFrequency
ChannelSeparation
SweepSystem
SweepTime
SweepTimeAccuracy
Sweep
Magnification
HorizontalLinearity
TRIGGERING
Source
Slope
Triggering
Range
0.01 V/cm to 20 V/cm in I I
calibrated ranges in l-2-5 se-
quence.
Variable
between
ranges.
! 5%
on allranges.
DC:DCto l0 MHz
G3 dB)
AC:2Hz to l0 MHz
(-3 dB).
35nanoseconds.
3%or lessat I@ kHz squarewave
display.
3%or less
at 100kHz squarewave
display.
I megohm,
t 57o.
22
pF(t3 pF).
300 V (DC + AC peak)
or 600 V
p'p.
Channel
A only.
ChannelBonly.
Dual-traceautomatically
chopped
at allsweeptimesof I mSicm
and
slower; alternatetrace automati-
cally selected
for all fastersweep
times.
2OOkHz(t2Vo).
Betterthan60 dB@| kHz.
Triggeredandautomatic.In auto-
matic mode, sweepis obtained
without input sigral.
I pSEC/cm
to 0.5 SEC/cmin 18
calibrated ranges,in l-2-5 se-
quence.
Variable
betweenranges.
+ <q^
Obtainedby enlargingthe above
sweep
5 timesfrom center.
Maxi-
mum sweep
speedbecomes
0.2
gSEC/cm.
3%or less
distortion.
INT and EXT (l V p-p
sensitivity).MODE switch selects
sourceofinternaltrigger;
theCHA
signalis the triggering
sourcein
the CH A andDUAL modes,
and
the CH B signal
is the triggering
sourceinthe
CHB mode.
Positive
andnegative,
continuous-
ly variable
level
control;
pull for
AUTO.
INT: 20Hz
to l0 MHz
(min.
I cm
deflectionas measured
on
cathoderay tube).
EXT:
DC to l0 MHz.
PROBES
Model
No.
Attenuation
Input lmpedances
Connector
Tip
SWEEPCIRCUITS
(Common
toCHA andCHB)

7
I
9
r0
12
Fig.|. Frontpanel
controls
andindicators.

OPERATOR'S
CONTROLS.
INDICATORS
AND FACILITIES
l.
2.
3.
4.
Cathode
Ray Tube(CRT).This is thescreen
onwhich
the
waveforms
are
viewed.
Scale. The 8 x l0 cm graticule providescalibration
marks for voltage (vertical) and time (horizontal)
rneasurements.
Pilot Lamp.Lights whenoscilloscopeistumed on.
SWEEP TIME/CM Switch. Horizontal sweep time
selector.Selectscalibratedsweep
timesof I pSEC/cm
(microsecondper centimeter)
to 0.5 SEC/cm in l8
steps.In the CH B position, this switch disables
the
internalsweep
generator
and
permits
theCH Binput to
provide
horizontalsweep.
CAL |.-P Terminal. Providescalibrated I volt
peak-to-peak
square
waveinput signalat thelinefrequen-
cy. Thisis used
for calibration
of theverticalamplifier
attenuators.
<> POSITION Control. Rotatitin adiustshorizontal
position of traces
(both traces
when operatedin the
dualtracemode).
Push-pull
switchselects5X magrifi-
cation when pulled out (PULL 5X MAG): normal
when
pushed
in.
TRIGGERING LEVEL Control. Syncleveladjustment
determines
points on waveform slope where sweep
starts;
(-) equals
mostnegative
point of triggering
and
(+) equalsmost positive point of triggering.
Push-pull
switch selects automatic triggering when pulled out
(PULL AUTO). Whenautomatic
triggering,
a sweep
is
generated
evenwithout aninput signal.
EXT TRIG Jack.Input terminalsfor externaltrigger
signal.
SYNC Switch. Four-position lever switch with the
following
positions.
SLOPE.The SLOPE
positionsareused
for viewingall
waveformsexcepttelevisioncomposite
videosigtals.
(+) Sweep is triggeredon positive-going
slope of
waveform.
(-) Sweepis triggeredon negative-goingslope of
waveform.
VIDEO. In theVIDEO positions,
thesync
pulses
of a
televisioncomposite
videosignalareusedto triggerthe
sweep;theverticalsync
pulses
(frame)
areautomatically
selected
lorsweeptimes
of0.5SEC/cm
to0.I mSEC/cm,
and horizontal sync pulses (line) are automatically
selected
for sweep
times
of 50pSEC/cm
to 1prSEC/cm.
(+) Sweepis triggeredon positive-going
syncpulse.
(-) Sweepis triggered
on negative-going
syncpulse.
SOURCE Switch. Selects triggeringsource for the
sweep.
INT Sweepistriggeredby CHA sigrral
whenMODE
switchisin CHA or DUAL position.
Sweep is triggered by Channel B sigral when
MODEswitchisin CH B position.
EXT Sweepis triggeredby an external signalapplied
attheEXT TRIGjack 8.
Channel
B POSITIONControl. Vertical position adjust-
ment for Channel
B trace.Becomes
horizontal
position
adjustment
whenSWEEP
TIME/CM switch4 is in the
CH B position.
Channel B DC BAL Adjustment. Vertical DC Balance
adjustment
for ChannelB trace.
ChannelB INPUT Jack. Vertical input jack of Channel
B. Jack becomes external horizontal input when
SWEEP
TIME/CM switch 4 isin the CH B position.
CtrannelB DC-GNDAC Switch.
DC Directinput of ACandDCcomponent
of input
signal.
GND Openssigral path and groundsinput to vertical
amplifier. This provides a zero-signal
base
line,
the position ofwhich canbeusedasareference
whenperforming DC measurements.
AC Blocks
DCcomponent
of input signal.
ChannelB. VOLTS/CM Switch. Vertical attenuator for
ChannelB. Verticalsensitivity
is calibrated
in I I steps
from .01 to 20 volts per cm. This control adjusts
horizontal sensitivity when the SWEEP TIME/CM
switch
4 isin theCH B position.
MODE Switch. Three-positionleverswitch; selectsthe
basic
operatingmodesof the oscilloscope.
CH A Only the input signal to Channel A is dis-
playedasasingle
trace.
DUAL Dual-traceoperation; both the ChannelA and
Channel B input signalsare displayedon two
separate
traces.
CH B Only the input signal to Channel B is dis-
playedas
asingletrace.
17. ChannelA VOLTS/CM Switch. Vertical attenuator for
ChannelA. Vertical sensitivityis calibrated
in I I steps,
from .01to 20volts
per
cm.
18. ChannelA DC-GNDAC Switch.
DC Direct input of AC andDC component of input
sigral.
GND Openssigrral
path and groundsinput to vertical
amplifier. This provides a zero-sigralbaseline,
the position of which canbeused
asareference
when performing DCmeasurements.
AC BlocksDC componentof input signal.
19. ChannelA INPUT Jack.Verticalinputjack ofChannel
A.
l). Channel A DC BAL Adjustment. Vertical DC balance
adjustmentfor ChannelA trace.
21. Channel A POSITION Control. Vertical position ad-
justmentfor ChannelA trace.
22. FOCUS
Control.
INTENSITY Control. Clockwise
rotation increases
the
brightness
of trace.
FOWER
Switch. Turnsunit on andoff.
ll.
12.
13.
14.
5.
6.
7
15.
16.
E.
9.
23.
10.
24.

29.
30.
25.
26.
n.
28.
VARIABLE Control. Fine sweeptime adjustment.In
the extremeclockwiseposition (CAL), the sweep
time
iscalibrated.
CH B VARIABLE Control. CHB vertical attenuator
adiustment. Fine control of CHB vertical sensitivity'
In-the extreme clockwise(CAL) position, the vertical
attenrator iscalibrated.
CH A VARIABLE Control. CH A vertical attenuator
adjustment. Fine control of CHA vertical sensitivity-
In-the extreme clockwise(CAL) position, the vertical
attenuator
iscalibrated.
INT MOD Jack.Intensity modulation (Z'axis) input.
AC Line Cord (See Fig. 2). CSA-approved
for oscil-
loscopes.
Probe
(See
Fig.3). TheB & K-Precision
ModelPR-31
combination
l0: l/Direct probes
havebeen
designed
for usewith this oscilloscope.
However,
any probe
designed
for usewith an oscilloscope
having
anominal
input impedance
of I megohm
shuntedby 35 pF and
capable
of operation
upto 10
MHz,canbe
used.
31. Vector Overlay (Not Shorvn). Interchangeswith scale
for vectorscope
operation.
CRT ROTATION
ADJUSTMENT
DC BALANCECONTROL
(One
oneach
side
)COMBINATION
FEET
AND CORD
WRAP
Fig.
2. Rear
andside
panel
facilities.
2829
--
1.
PULL APART
t-r,_tfj1-
1O:1
ATTENUATION
(PR-35)
PROEE
COMPENSATIONADJUSTMENT
(PR-31
)
Adlust probe compensation for best
squarewavedisplay while observing
signal
from cal J1 1V p-p ACK.
PROBE COMPENSATIONADJUSTMENT
2.ROTATE180"
3.
PUSH
BACK
TOGETHER
Fig.3. hobe details.

OPERATING
INSTRUCTIONS
INITIAL STARTINGPROCEDURE
i SetPO\lERswitch24to OFFposition.
l. Connect
power
cord29to a I l7-volt,50160Hzoutlet.
3. SetCH A POSITION
control 21, CH B POSITION
control
II and<>POSITION
control6to thecentersof
theirranges.
4. PUII
TRIGGERING LEVEL control 7 to the AUTO
position.
5. Set CH A DC-GND-AC switch 18 and CH B
DC-GND-AC
switch14
to theGND positions.
6. Set MODE switch 16 to the CH A position for
single-traceoperationor the DUAL positionfor dual-
traceoperation.
7. Tum on oscilloscope
by turning POWER
switch24 to
ONposition.
Pilotlamp3 will light.
8. Waita few secondsfor the cathoderay tube
(CRT) to
warmup. A trace
(two traces
if operating
in theDUAL
mode)
should
appearon thefaceof theCRT.
9. If no traceappears,increase
(clockwise)
the settingof
INTENSITY control 23 until the trace is easilv
observed.
10. AdjustFOCUS
control22andINTENSITY
control23
for thethinnest,
sharpesttrace.
I 1. Readjust
position
controls6,21 andl I if necessary,
to
centerthetraces.
12. Checkfor proper adjustmentof DC BAL controls12
and 20 as describedin the MAINTENANCE AND
CALIBRATION portion of this manual.These
adjust-
ments
require
checking
only periodically.
The oscilloscope
is now readyfor makingwaveform
measurements.
CAUTION
Never allow a small spot of high brilliance to
remain
stationaryon the screenfor more than a
few seconds.
Thescreenmavbecome
permanentlv
burned. Reduceintensity-or keep ihe spot iir
motion by causingit to sweep.
SINGI,E-TRACEWAYEFORM OBSERVATION
Either Channel A or Channel B can be used for
single-trace
operation.For simplicity,ChannelA is usedin
thefollowing
instructions.
l. Performthe steps
of the "Initial StartingProcedure"
with the MODEswitch 16 in the CHA position.
Then
connectthe probe
cable
to theCH A INPUTjack 19.
The following instructions assume
the use of the
B& K-PrecisionModelPR-3
i combination
probes.
2. For all except low-amplitude
waveforms,
the probes
aresetfor l0: I attenuation.For low-amplitude
wave-
forms(below0.5 volt peak-to-peak),
setthe probe
for
DIRect.
SeeFig.3 for changing
theprobes
from l0:l
to DIRect, or vice
versa.
The probe
has
a l0 megohm
input impedance
with only l8 pF shunt
capacitance
in
the l0:l position
and I megohmwith l20pF shunt
capacitance
in the DIRect position.The higherinput
impedance (low-capacity position) should be used
when
possible,
to decreasecircuitloading.
SetCHA DC-GND-AC
switch l8 to AC for measuring
only theAC component
(this
isthenormal
position
for
most measurements
and must be usedif the point
beingmeasured
includesa largeDC component).Use
the DCposition
for measuring
both theAC component
and the DC reference,and any time a very low
frequency
waveform
(below 5 Hz) is to be observed.
The GND position
is requiredonly whena zero-signal
ground reference
is required,suchasfor DC voltage
readings.
Connect
ground
clip of probeto chassis
ground
of the
equipment
undertest.Connect
the tip of theprobe
to
the point in the circuit wherethe waveform
is to be
measured.
WARNING
a. If the equipment
undertestis a transformer-
lessAC powered
item, use
anisolation
trans-
former to prevent
dangerouselectrical
shock.
b. The peak-to-peak
voltage at the point of
measurement
should not exceed 600 volts
whenusingthe DIRect positionof theprobe.
Set CH A VOLTS/CM switch 17 to a position that
gives
2 to 6 cm (two to six large
squareson thescale)
vertical deflection. The display on the screenwill
probably be unsynchronized.
The remaining
stepsare
concemed
with adjustingsynchronization
and sweep
speed,which presents
a stable display showingthe
desirednumber of waveforms.
Any signalthat pro-
duces at least I cm vertical deflection develops suf-
jicient tigger signal
to synchronize
thesweep.
Set SOURCE switch l0 to the INT position. This
providesinternal sync so that the waveform being
observedis also used to trigger the sweep.Most
waveforms
should be viewedusinginternal sync.When
an external sync source is required, the SOURCE
switch should be placed in the EXT position and a
cableshould be connectedfrom the EXT TRIG jack 8
to theexternal
syncsource.
Set SYNCswitch9 to the VIDEO(+) or (-) positions
for observing
television
composite
videowaveforms
or
to theSLOPE
(+) or SLOPE
(-) positions
for observing
all other typesof waveforms.Use the (+) position_if
thesweepisto betriggered
by apositive-going
wave,
or
the (-) position if the sweepis to be triggered
by a
negative-going
wave. If the type of waveform is
unknown,theSLOPE
(+) position
maybeused.
ReadjustTRIGGERING LEVEL control 7 to obtain
a
synchronized
display
without jitter. Asastarting
point,
the control may be pushed
in androtated
to anypoint
that will producea sweep,
which isusuallysomewhere
in the center portion of its range.The trace will
disappearif there is inadequate signal to trigger the
sweep,
suchaswhen measuring
DC or extremely
low
amplitude waveforms.
If no sweepcanbe obtained,
J.
4.
5.
6.
8.

pull the control out (PULL AUTO) for automatic
triggering.
9. SetSWEEP
TIME/CM switch 4 for the desired
number
of waveforms.This control may besetfor viewingonly
a portion of a waveform, but the trace becomes
progressively
dimmer asa smallerportion is displayed.
This
isbecausethesweepspeed
increases
but thesweep
repetition rate doesnot change.
NOTE
Whenusingvery fastsweepspeed
atlow repetition
rates,the operator may wish to operatewith the
intensity control toward maximum.Under these
conditions, a retrace "pip" may appearat the
extremeleft of the trace.
This does
not in any way
affect the oscilloscope operation and may be
disregarded.
10. After obtaining
thedesirednumberof waveforms,
asin
step 9, it is sometimes desirable to make a final
adjustment
of the TRIGGERING LEVEL control 7.
The
(-) direction
selects
themostnegative
pointon the
waveform at which sweeptriggeringwill occurandthe
(+) direction selectsthe most positive point on the
waveform at which sweep triggering will occur. The
control may be adjustedto start the sweepon any
desired
portionof thewaveform.
I l. For a close-upview of a portionof the
waveform,
pull
outwardon the<)POSITION control 6. Thisexpands
the sweepby a factor of five (5X magrification) and
displaysonly the center partion of thesweep.To view
a portion to the left of center,turn the<>POSITION
control clockwise,and to view portion to the right of
center,turn thecontrolcounterclockwise.
Push
inward
on the control to return the sweepto the normal,
non-magnified
condition.
CALIBRATED VOLTAGE MEASLJR-EMENT(See
Fig.a)
- Peakvoltages,peak-to-peak
voltages,
DC voltages
and
voltages
of a specificportion of the complexwaveform
are
easily and accurately
measured
on the Model 1476
Dual-Trace
Triggered
Sweep
Oscilloscope.
l. Adjustcontrols
as
previously
instructed
to displaythe
waveformto bemeasured.
2. Set CH A VOLTS/CM switch 17 for the maximum
vertical deflection possible without exceeding the
limitsof thevertical
scale.
.} POSITION
CONTROL ADJUSTED SOTHAT
TOP OF WAVEFORM CROSSES
CENTER OF
VERTICALSCALE MARKER FOR ACCURACY
AND EASEOF READING
POSITI
ONCONTROLADJUSTE
D
SOTHATBOTTOMOF
WAVE-
FORM
ALIGNS
EXACTLY
WITH
A HORIZONTAL
REFERENCE
LINE
VOLTS/cm
SET
TO
.o2v
EXAMPLE:
VERTICAL DEF
LECTION
VOLTAGE/CM 4.2cm
.O2
v
.084V
10
0.84V
10:1
PROBE ATTENUATION
.O2Yx 4.2
PROBE
ATTENUATION
PEAK-TO-PEAK
WAVEFORM
tqTo1"t
l0
Fig.
4. Typical
voltagemeasurement.

3. Readthe amount
of vertical
deflection
(in cm)from
the s;ale.The CH A POSITIONcontrol
2l maybe
rea.ltusted
ro shift thereference
pointfor easierscale
:erJrng
ri desired.
WhenmeasuringaDCvoltage,adjust
::.r' CH A POSITION control 2l to a convenient
reierence
with the
CHA DC-GND-AC
switch
l8 in the
G\D position, then note the amount the trace is
deflected
whentheswitch
isplaced
in theDCposition.
The tracedeflectsupwardfor a positive
voltage
input
and
downward
for anegativevoltageinput.
4. Calculate
the voltage
readingasfollows:Multiply the
verticaldeflection
(in cm) by the VOLTS/CMcontrol
l7 setting
(see
example
in Fig.4) Don't forgetthat the
voltagereadingdisplayed
on the oscilloscopeis only
l/l0th the actualvoltagebeing measured
when the
probe
is set
for l0: I attenuation.
Theactual
voltageis
displayed
when the probeis set for DIRect measure-
ment,
5. Calibration accuracy of this oscilloscopemay be
occasionallycheckedby observing
the I volt peak-to-
peaksquare
wave
signal
availableat the CAL lV P-P
jack 5. This calibrated
sourceshouldreadexactly I
volt peak-to-peak.
If a need for recalibration
is in-
dicated,seethe "MAINTENANCE AND CALIBRA-
TION" sectionof themanual
for complete
procedures.
CALIBRATED TIME MEASUREMENT (See
Fig. 5)
Pulsewidth, waveform periods, circuit delaysand all
other waveform time durations are easily and accurately
measured on this oscilloscope.Calibrated tinp rneasure'
ments from .5 second down to 0.1 microsecondare
possible.
At low sweepspeeds,
the entire waveform is not
visible at one time. However, the bright spot canbe seen
moving from left to right across
the screen,which makes
the beginning and ending points of the measurementeasy
to spot.
l. Adjust controls as previously describedfor a stable
displayof the desired
waveform.
2. Set the SWEEPTIME/CM control 4 for the largest
possible display of the waveform segment to be
measured,usuallyone
cycle.
3. If necessary,readjust
the TRIGGERINGLEVEL con-
trol 7 for the moststable
display.
4. Read the amount of horizontal deflection (in cm)
betweenthe points
of measurement.
ThecPOSITION
control 6 may be readjusted to aligrr one of the
measurement
points with a vertical scalemarker for
easierreading.
5. Calculatethe time duration asfollows: Multiply the
HORIZONTAL
DEFLECTION
O.JJ
cm
<) SWEEPTIME/CM
set to 'l0l,l sec
SLOPE setto Q
tto start syveep
on
negativejoing edgel
INT
POSITION CONTROL ADJUSTED SO
THAT LEADING EDGE OF WAVE-
FORM ALIGNS WITH l. r ERTICAL
REFERENCE LINE. EDGE
MAY NOT BE VISIBLE ON VERY
FAST PULSES;IN THIS CASE
ALIGN WHEREVER WAVEFORM
BEGINS.
POSITION
CONTROL ADJUSTED SO
THATTRAILING EDGE OF WAVEFORM
CROSSESHORIZONTAL SCALE MARKER
FOR ACCURACY AND EASEOF READING
EXAMPLE:
HORIZONTAL DEFLECTION =
SWEEP
TIME/CM -
TIME DURATION =
c. PEBIOD) OF WAVEFORM
FREouENCY - =:- =
IIME
6.35cm
1OpSEC
63.SpSEC
.0000635sEc
15,750Hz
DISPLAYS SHOWTYPICAL TELEVISION
RECEIVER WAVEFORM AT GRID OF
HORIZONTAL OUTPUT TUBE
fol-ol"t
ll
Fig.5. Typicaltimemeasurement.

horizontal
deflection
(in cm)by theSWEEPTIME/CM
switch 4 setting
(see
examplein Fig. 5). Remember,
whenthe 5X magnificationis used,the resultmustbe
divided
by 5to obtaintheactualtimeduration.
6. Time measurements
oftenrequireexternal
sync.This
is
especially
true when measuringdelays.The sweepis
started by a sync sigral from one circuit and the
waveform
measuredin asubsequent
circuit.Thisallows
measurement
of the displaybetweenthe syncpulse
and the subsequent
waveform.
To perform
suchmeas-
urementsusingexternalsync,usethefollowing
steps:
a. Set the SOURCEswitch l0 to the EXT position.
b. Connecta cable
from theEXT TRIGjack 8 to the
source
of syncsigral.Useashortshieldedcable.
c. Set the SYNC switch 9 to the SLOPE
(+) or (-)
position
for theproperpolarityfor thesyncsignal.
d. Readjust
the TRIGGERING LEVEL control 7 if
necessaryfor astable
waveform.
e. If measuring
a delay,measure
the time from the
startof thesweep
to thestartof thewaveform.
7. Anotherexcellentmethodfor measuring
timedelaysis
with dual-traceoperation.The procedures
are
given
in
the "DUAL-TRACE APPLICATIONS" section of the
manual,
EXTERNAL HORTZONTALINPUT (X-y OPERATTON)
For somemeasurements,
an
extemal
horizontal
deflec-
tion sigral is required.
This is alsoreferredto asan X-Y
measurement,
wherethe Y input provides
verticaldeflec-
tion and the X input provides
horizontaldeflection.
The
horizontal input may be a sinusoidalwave,such as for
phasemeasurement,
or an external sweep
voltage.This
input mustbe 10mV percm of deflectionor greater;
thus
any voltage of 100 mV or greater is sufficient for
satisfactoryoperation.To useanexternalhorizontal
input,
use
thefollowing
procedure:
1. Set the SWEEPTIME/CM switch4 fully clockwise
to
theCH B position.
2. Use
the ChannelA probefor theverticalinput andthe
ChannelB probe
for thehorizontalinput.
3. Adjust the amountof horizontaldeflectionwith the
CHB VOLTS/CM
control15.
4. The CH B POSITION control I I now serves
asthe
horizontal position control, and the <> POSITION
control
isdisabled.
NOTE
Do NOT usethe PULL 5X MAG control durine
X-Y operation.
Use
theCH B VOLTS/CM
controT
to adjust
horizontal
gain.
5. All synccontrols
aredisconnected
andhave
no effect.
Z.NilS INPUT
.The trace displayed
on the screen
may be intensity
modulated(Z-aas input) where frequency-
or time-scall
rygks 99 required.
A TTL compatible
sigrral
applied
atthe
INT MOD (intensity
modulation)
jack24on th-e-rear
of the
oscilloscopewill govide allernatebrightness
andblanking
of thetrace.
SeeFig.
6.
t2
Fig. 6. Oscilloscope
tracewith Z-axis
input.
DUALTRACE WAVEFORM OBSERVATION
(Referto Fig. 7)
In observingsimultaneouswaveforms on channels
A
and B, it is necessary
that the waveforms be related in
frequency
or that one
of thewaveforms
be
synchronized
to
the other althoughthe basicfrequencies
may be different.
An example of this is in checkinga frequency divider or
mulliplier.The
reference,
or "clock" frequency
canbeused
onChannel
A, for example,
andthemultipleorsubmultiple
of this reference
frequencywill be displayed
on ChanneiB.
In this way, when the waveform display of ChannelA is
synchronized,
thq display on Channel
B will alsobein sync
with the ChannelA display. If two waveformshavingno
phase
or frequency
relationship
to each
other
aredisplayed
simultaneously,
it will be difficult if not impossible
tb lirck
both waveforms
in syncfor anyuseful
observation.
To displaytwo waveforms
simultaneously
for observa-
tion,usethefollowingprocedure:
l. Performthe stepsof the "Initial StartingProcedure."
2. Connect
oscilloscopeprobe cables
to both the CH A
andCHB IMUT jacks
19and13.
3. If the recommended
B & K-Precision
Model PR-31
oscilloscopeprobes are used, 10: I attenuation
should be used except for waveforms
of 0.5 volt
peak-to-peak
or less.For the lower amplitude
wave-
forms the DIRect position
shouldbeused.
SeeFig.3
for changingthe probe
from l0:l to DIR or vice
veisa.
Wheneverpossible, use the high impedance,low
capacityl0: I position
to minimize
circuit
loading.
4. Set MODE switch 16 to the DUAL position. Two
tracesshould
appearon thescreen
5. AdjustCH A andCH B POSITION
controls
2l and
ll
to place the Channel A trace above the Channel B
trace,
andadjust
both tracesto aconvenient
reference
mark
onthescale.
6. Setboth the CH A andCH BDC-GND-AC
switches
l8
and 14to theAC position.
Thisistheposition
used
for
most measurements
and must be usedif the points
beingmeasured
include
alarge
DCcomponent.
f
l\t'tIt
t\I
tt\t

t2.
13.
R
Connect
the gound clips
of theprobes
to thechassis
g:ound
of theequipment
under
test.
Connect
thetips
-.i the probes to points in the circuit where the
*aveiormsareto bemeasured.Thesipal to whichthe
*aveform will besynchronized
mustbe appliedto the
ChannelA input for intemalsyncoperation.
WARNING
a. If the equipmentundertestisa transformer-
lessAC unit. usean isolationtransformerto
prevent
dangerous
electricalshock.
b. The peak-to-peak
voltage at the point of
measurementshouldnot exceed
600 volts.if
theprobe
isused
in theDIR position.
Setthe VOLTS/CMcontrols
l5 and17for ChannelsA
and B to a position that gives
2 to 3 cm vertical
deflection.
The displayson thescreenwill probably
be
unsynchronized.The remainingsteps,
althoughsimilar
to those outlined for single-traceoperation,describe
the procedure for obtaining stable, synchronized
displays.
Setthe SOURCEswitch l0 to the INT position.
This
provides
internalsyncsothat theChannel
A waveform
beingobservedis alsousedto triggerthesweep.
Often
in dual-traceoperation,a sync source
other than the
measurement
point for ChannelA is required.In this
caseset the SOURCE switch to the EXT (external)
positionandconnecta cable
from theEXT TRIGjack
8 to thesyncsource.
Set the SYNC switch 9 to the VIDEO(+) or (-)
positions for observing
te.-vrsion composite video
waveforms, or to the SLOPE (+) or SLOPE (-)
positions
for observing
all other typesof waveforms.
Il.
Usethe (+) positionsif the sweepis to betriggered
by
a positive-goingwave, or to the (-) position if the
sweep
isto be
triggeredby anegative-going
wave.
Adjust TRIGGERING LEVEL control 7 to obtain a
stable,synchronizedsweep.
As a starting point, the
control may bepushed
in androtated to any point that
will produce a sweep,
which is usually somewhere
in
the center portion of its range.The tracewill disappear
if there is inadequatesignalto trigger the sweep,
such
aswhen measuring
extremely low amplitude signals.If
no sweepcanbe obtained, pull out the control (PULL
AUTO) for automatic triggering.
Set SWEEP
TIME/CM switch 4 for the desirednumber
of waveforms.This control may besetfor viewingonly
a portion of a waveform, but the trace becomes
progessively dimnrer asa smallerportion is displayed.
After obtaining the desirednumber of waveforms
as
in
step 12, it is sometimes
desirableto make a final
adjustment of the TRIGGERING LEVEL control 7.
The (-) direction of rotation selects
the most negative
point on the sync waveform at which sweep
triggering
will occur and the (+) direction selects the most
positive point on the sync waveform at which sweep
triggering will occur. The control may be adjusted to
start the sweep on any desired portion of the sync
waveform.
The obsewed waveforms of ChannelsA and B can
be expanded by a factor of 5 by pulling outward
on the <>POSITION control 6. This control can then
be rotated clockwise or counterclockwiseto view the
left and right extremes of the waveform displaysas
desired. Push inward on the control to retum the
sweepto the normal, non-magrrifiedcondition.
Calibratedvoltagemeasurements,
calibratedtime meas-
urementsand operation with Z-axisinput areidentical
9.
10.
14.
15.
CHANNEL A
WAVEFORM
filii,t?3Hfi
""o
A. REFERENCE FREOUENCY PULSE TRAIN
.(1OOO
PULSESPER SECOND)
LEADING
EDGESMAY NOT BE
VISIBLE
AT FASTSWEEP
RATES
a",
B. DIVIDE
.BY .TWO
OUTPUT
SYNCHRONIZED
TO
LEADING
EDGE
OF
REFERENCEPULSE
I l*ra
."t l
C. DIVIDE
.BY .TWO
OUTPUTSYNCHRONIZED
TO
TRAILING
EDGE
OF
REFERENCE
PULSE
@
@
o
o
l mS/cm
SLOPE+
INT
WAVEFORM
B
WAVEFORM
A
WAVEFORM
A
HEIGHT
WAVEFORM
B
HEIGHT
Fig.7. Waveforms
in divide-by-two
circuit.
l3

to those
previously
described
for single-trace
operation.
Either the Channel
A or Channel
Bvertical adjustment
controls can be usedas required in conjunction with
the horizontal sweepcontrols to obtain the required
amplitude or time interval measurements.
This canbe
doneeither by usingthe dual display facilitiessuchas
the DUAL position of the MODE switch or by
reverting to single-trace
operation, usingthe CH A or
CH B positions
of theMODE switch.
DUAL.TRACE
APPLICATIONS
INTRODUCTION
The most obvious and yet the most useful featureof
the dual-traceoscilloscope
is that it hasthe capability for
viewing
simultaneously
twc waveformsthat are
frequency-
or phase-related,
or that have a common synchronizing
voltage,
suchasin digitd circuitry. Simultaneous
viewingof
"Causeand Effect" waveforms
is aninvaluableaid to the
circuit desigrer or the repairman.Several
possible
applica-
tions of the dual-trace oscilloscopewill be reviewedin
detail to familiarizethe userfurther in the basicoperation
of thisoscilloscope.
FREQUENCYDTVIDERWAVEFORMS
Fig. 7 illustrates the waveforms involved in a basic
divide-by-two
circuit. Fig. A indicatesthe referenceor
"clock" pulsetrain. Fig. B and Fig. C indicatethe possible
outputsof the divide-by-twocircuitry. Fig.7 alsoindicates
the settings of specific oscilloscopecontrols for viewing
these
waveforms.In addition to these
basiccontrol settings,
the TRIGGERING LEVEL control, aswell asthe Channel
A and ChannelB vertical position controlsshouldbesetas
required
to produce
suitable
displays.ln the drawingof Fig.
7, the waveformlevels
of 2 cm areindicated. The Channel
B waveformmaybeeitherthat indicatedin Fig.TBor 7C.
In Fig. 7C the divide-by-two
output waveformisshownfor
the case
wherethe output circuitry respondsto anegative-
going waveform. ln this case, the output waveform is
shifted with respectto the leadingedgeof the reference
frequency pulse by a time interval corresponding
to the
pulse
width.
rtftra{l trttu!(y rut* rr^N 1
r@ tuLsf5 .te stcfro l
In an application where the logic circuitry isoperating
at or nearits maximum desigrr
frequency,
the accumulated
risetime effectsof the consecutive
stages
produceabuilt-in
time propagationdelaywhich can
besigrificant in acritical
circuit andmustbe compensated
for. Fig. 8Cindicatesthe
possible time delay which may be introduced into a
frequency divider circuit. By use of the dual-traceoscil-
loscopethe input and output waveformscan be super-
imposedto determine
the exact amount of propagation
delaythat occurs.Sigrificant propagationdelaymayoccur
in any circuit with severalconsecutivestages.Using the
proceduresgiven
for calibratedtime measurement,
Tp can
be alculated. A more
precise
measurement
canbeobtained
if theTp portionof thewaveform
isexpanded
horizontally.
This may bedoneby pulling thePULL 5X MAG control. It
also may be possible to view the desiredportion of the
waveform
atafaster
sweep
speed.
DIGITAL CIRCI.IITTIME REL,dTIONSHIPS
A dual-trace oscilloscopeis a necessity
in designing,
manufacturing
andservicrngdigital equipment. A dual-trace
oscilloscope
permitseasycomparisonof time relationships
between
two waveforms.
In digital equipmentit is common for a largenumber
of circuits to be synchronized,or to have a specifictime
relationship to each other. Many of the circuits are
frequency dividersaspreviouslydescribed,but waveforms
areoften time-related
in many othercombinations.In the
dynamic state,some of the waveformschange,
depending
upon the input or modeof operation.Fig.9 showsatypical
digital circuit and identifies several
of the points at which
waveform measurements
are appropriate.The accornpany-
ing Fig. l0 shows
the normalwaveformsto beexpectedat
each of these points and their timing relationships.
The
individual waveformshavelimited valueunles their timing
relationship to one or more of the other waveforms is
known to be correct.The dual-traceoscilloscope
allowsthis
comparison
to bemade.In typical fastrion,
waveform
No. 3
would be displayedon ChannelA andwaveform
No. 4 thru
No. 8 and No. 10, would be successivelydisplayedon
Channel B, although other timing comparisonsmay be
desired.Waveforms
No. 1l throughNo. 13
wouldprobably
be displayedon ChannelB in relationship
to waveformNo.
8 or No.4 onChannelA.
ln the family of time-related
waveforms
shownin Fig.
10, waveformNo. 8 or No. l0 is anexcellent
syncsource
for viewingall of the waveforms;
thereisbut onetriggering
pulse per frame, For convenience,
external sync using
waveformNo. 8 or No. l0 as the sync source
may be
desirabie"With external
sync,
anyof thewaveformsmay
be
displayed without readjustment of the sync controls.
WaveformsNo. 4 thru No. 7 should
not beusedasthesync
sourcebecausethey donot contain a triggering
pulse
at the
start of the frame.It would not benecessaryto viewthe
entirewaveforms
asshownin Fig. i0 in all cases.
In fact,
there are many times when a closer examination of a
portion of the waveformswould be appropriate.
In such
cases,it is recommended
that thesyncremainunchanged
while the sweep speedor 5X magnification be used to
expandthewaveformdisplay.
GATED RINGING CIRCUIT
The circuit and waveformsof Fig. I I are shownto
demonstratethe type of circuit in which the dual-trace
oscilloscopeiseffective
both in desip and
troubleshooting
( r.o,^G',oN ":," " .". .' t6a, c,rc!,,
Fig.8. Waveformsin divide-by+ightcircuit.
DIVIDEBY.EIGHT CIRCUIT WAVEFORMS
Fig. 8 indicates waveform relationships for a basic
divide-byeigfit circuit. The basic oscilloscopesettingsare
identical
to thoseusedin Fig.7. The
reference
frequencyof
Fig. 8A is suppliedto the ChannelA input, and the
divide-by+ight output is applied to the ChannelB input.
Fig. B indicates the ideal.
time relationship between the
input pulses
andthe output pulse.
t4

3rtliJ3uons. The basic oscilloscopecontrol settings
are
ije:.i::al !o thoseof Fig.7. WaveformA isthereference
'*r\:'iorm and is appliedto Channel
A input. All other
;:ieiorms aresampled
at ChannelB andcompared
to the
:eierence
waveformof Channel
A. The frequency
burst
srmal canbe examinedmore closely
either by increasing
the sweeptime per centimeter to '5-
mSECpeJcentimeter
or bv puilineoui on the
<>POSITIONcontrol to obtain5
timei 'maeniiication" This control can then be rotated as
desiredto-centerthe desired
waveform information on the
oscilloscope
screen.
COOE
D
AOOR€
SS
O
ATA
INPUT
(5 - Erls)
cooEo
tuicTtoi
oA
TA
IXPUI
(t-6rrs)
S
IART t3
ItrPUT
LIiE ORIVEi
---- -
1_:_)
t-
L_ l3
SECURITY
glr I
SECURI?Y
Etf 2
vt2
MULTI
-
PLEXER
sEcuRl
Tl
alT 3
45678
DA'^ SELECI LIiE-O (E)
Fig.9. Typical digital circuit usingseveraltime-relatedwaveforms.
l5

{ urre srlrcr 'e'
$ orres:recrr'
$ oerestrtcrc'
7
aDATA SILECT O' -
DATA EXA'TI
9nr
lo
EM FIIE RCS€T
ll n rrt?LCxER
q,TruT
12r
LHe l-
nrrn anrxrr I
13r
tl
tl
rl
I
I
I
SEClrnlrY ----.1
illa aT I
I olll|o atls, !
rl
ll
F- $CURtry S€CURtty ----rl
OA'ABIT 2 OATA3IT 3
ON€ COTPL€TT
TRANSMISSION FRATI
Fig. 10. Family of time-relatedwaveformsfrom typical digitalcircuit in Fig.9.
DELAY LINETESTS
The dual-trace
feature of the oscilloscope
canalso be
usedto determine
the delaytimes
of transmission
type delay
linesaswell asultrasonictype delaylines.The inpirt pulsir
canF used
to-trigger
or synchronize
theChannel
A diiplay
and the delayline output canbeobserved
on Channel
b. A
repetitive type pulsewill make it possible
to synchronize
the displays.Theinterval between
iepetitive pulses
should
b9-large
compared
to the delay time io be ini,estigated.
In
addition to determining delay time, the pulse dfstortion
inheren_t
in the delay line canbe determinid by examina-
tion of the delayed pulse observedon the Channel B
waveform display. Fig. 12 demonstrates
the typical oscil-
loscope settingsas well as the basictest circuit. Typical
Tput and.output waveforrns
areshownon the oscillosiope
display. Any pulsestretching and ripple can be observid
and evaluated. The results of moAfying the input and
output terminations
canbeobserved
directly.
- A common application of the delay line checksis
found in color television.
receivers.
Fie. t: shows the
oscilloscope
settingsand typical circuil connections
to
l6
check the "{" delaylin-eemployedin the video amplifier
section.The input waveformand the output waveforh are
compared
for delaytime, usingthehorizohtal syncpulse
of
the composite video signal for reference.The indicated
delay is approximately one microsecond.In addition to
determiningthe-delay
characteristics
of theline, the output
waveform revpals
any distortion that may be introduied
lrom an impedance mismatch or a geatly attenuated
output resulting
from anopenline.
STEREO
AMPLIFIER SERVICING
Another convenient
usefor dual-channel
oscilloscopes
is in t-roubleshooting
stereoamplifiers.If identical channel
ampliliers areused
andthe output of oneisweak,distorted
or otherwiseabnormal, the dual-traceoscilloscope
canbe
efficiently used to localize the defective state. \t4th an
identical.
sigral applied
to the inputsof both amplifiers,
a
side-by-side
comparison of both rmits can Ue-maOe
6v
progessively sampling identical signalpoints in botir
amplifiers.
When
the defective
or malfunctioning
stagehas
beenlocated, the effects of whatevertroublesh6otiri'g
and
repair-methods
areemployedcanbeobserved
andanal--yzed
immediatelv.

Fig. I l. Gated
ringing
circuit andwaveform.
VIDEO EQUIPMENT SERVICING
Many of the video servicing procedurescan be
performed
usingsingle-traceoperation.
These
areoutlined
laterin the applications
s€ctioncoveringsingle-trace
opera-
tions. One of these
procedures,
viewing the VITS (ve;tical
interval test sigral), can be accomplished much more
effectively using a dual-traceoscilloscope.
As outlined in
the single-traceapplications
sectionandasshownin Fig. 20
and 21. the information on the Field #l and Field 1t2
vertical blanking interval pulse
is different. This isshownin
detail in Fig. 20. Also, becausethe oscilloscopesweepis
synchronized to. the vertical blanking interval waveform,
the Field #l and Field *2 waveforms are superimposed
onto each otheras shown in Fig. 72, With dual-trace
operation, the signal information on each blanking pulse
can be viewed separatelywithout overlapping.
Fig. 14
indicates the sscilloscope control setting for viewing the
alternateVITS.
1. The video equipment from which the VITS informa-
tion is to be yiewed must be set to a station trany
mitting acolorbroadcast.
2. T\e control settinp of Fig. 14 are thoserequired
to
obtain a2-field verticaldisplayon Channel
A.
3. With the oscilloscope
and television
receiver
operating,
connect
the Channel
A probe(set
at l0:l) to thevideo
detectortest
point.
4. Setthe SYNCswitch asfollows:
a. If the sync and blanking pulses
of the observed
video signal are positive, use the VIDEO(+)
switchposition.
b. If the sync and blanking pulsesare negative,
use
the VIDEO(-) switchposition.
5. Adjust the SWEEP
TIME/CM control sothat 2 vertical
fieldsaredisplayed
on theoscilloscope
screen.
6. Connect
theChannel
B probe
(set
to l0:l) to thevideo
detector
testpoint.
7. Setthe MODE switchto theDUAL position.Identical
waveform displays should now be obtained on
Channels
A andB.
8. Set the SWEEPTIME/CM control to the.lms/CM
position. This expands the display by increasingthe
sweepspeed.
the VITS information will appear
toward
the right hand portion of the expand6d waveform
displays.
The waveforminformation bn each
trace'may
app€ar as shown in the drawing of Fig. 21. Becatrse
t-l.rere
is no provisionfor synchronizing
the oscilloscope
displqr to either of the two fields which comprise-
a
complete
verticalframe,
it cannotbe predicted-which
field display will appearon the Channd A or Channel
B display.
9. Pull the <>POS control outward to obtain an addi-
tional 5X magnification. Rotate the control in a
counterclockwise direction moving the traces to the
left until the expandedVITS information appears
as
shown
in Fig.
15.
NOTE
Because
of the low repetition rate and
sweep
speed
combination,the brightness
thesigral displays
will bereduced.
I
the high
levelof
cllt0 lilGtrc cllcltT
.10 Gllrc tfttfotl
lllfliftfi __Jllllttft /lnffiR_
0 lllllllllr+llilllilrr-liilli
|IXUUU IJJU]}U UJ]JU{
t, Giltottfou$ct
ouTtul
il0
0
-10
+2
0
-7
_lll]ffi__ llllfiRfl llmft[_
-------ljilu
ll$-------uxu{[-----]1lu
uu
t, ltP(|fttD
flt00nB tuts] (?ouillt rnnltD)
__J Ililtill_____Jilflllt]___,1flflfltl
UUUll|l UIJIIIJII-U|]UUII-_
CHANNEL o
o
o
o
A
(INPUT
PULSE)
CHANNEL
B
(OUTPUT
PU
LSE) 3oH@
OUTPUT
5000 PPs
l&Sec
PULSE WIDTH
oo
o--@
ULTRA SONIC
DELAY LINE
(5,l Sec)
Fig. 12. Delayline measurement
.
l7

:-
lsS DELAY
ci A (INPUT)
CH
B(OUTPUT}
@3 TO HORIZONTAL AMPLIFIER.
NOTE: NO ELECTRICAL CON-
NECTION;PLACE CLIP ON
INSULATION OF PLATE CAP
LEAD OR IN CLOSEPROX.
IMITY OF HORIZONTAL AMP-
LIFIER TUBE.
VIDEO
AMPLIFIER
SET BOTH PROBES
FOR
iO:l ATTENUATION TO
VIDEO
OUTPUT
AMPLIFIER
*NOTE: SETTING OF VERTICAL
ATTENUATORS SHOULD BE THE
SAME, BUT MAY VARY WIDELY,
DEPENDI
NG ON CIRCUIT TYPE.
OELAY
L
INE
Fig.13. Checking
"Y" delay
linein colortelevisionreceivers'
10. Once
the Channel
A andChannel
B displays
havebeen
identified asbeing
either Field #l or Field #2 VITS
information, the Channel B probe may be used for
sigrr4l-tracing
and trgubleshooting,
andthe Channel
A
probe
should
beleft atthevideo
detector
test
pointto
insure that the syncsigral is not hterrupted. If the
syncsigral is interrupted,
the waveformdisplays
may
reversebecause,
as previouslyexplained,
thereis no
provision
in the oscilloscope
to identify either
of the
two vertical
fields
whichcomprise
acomplete
frame.
Fig. l5 shows
the dual-trace
presentationof the Field
#l and Field# VITS information.
The Field#1 informa-
tionisdisplayed
onthebottom
trace.
SINGLE.TRACE APPLICATIONS
INTRODUCTION
ln addition
to the dual-trace
applications
previously
outlined,
there
are,of course,
manyservice
andlaboratory
applications
whereonly' single-trace
operation
of the
oiiilloscope
ii required.After
gaining
experience
withthe
oscilloscope,
the
user
willbeable
to makethe
judgment
as
l8
to whether a job can be performedmore efficiently by
using
thesingle-trace
or thedual-trace
method
of operation.
The following are applications
in which single-trace
opera'
tion is adequate.
In several
cases,
it will be found that an
alternate
methodusing
the dual-trace
application
hasbeen
described
for thesameapplication.
VIDEO EQUIPMENT
SERVICING
A triggered sweep oscilloscope
is advantageous
in
servicing
andaligning
videoequipment.
Thisoscilloscope
alsoincludes
several
featuresthat wereincorporated
to
make video servicingeasierand more comprehensive.
These
features
include:
r SWEEP
TIME/CM control automatically selects
vertical sync at sweep speeds
appropriate for
viewing frames and horizontal sync at sweep
speeds
appropriate
for viewing
lines.
r Vectoroverlayfor colordemodulator
checks.
o Wide bandwidth for high resolution video and
pulsepresentation.
Table of contents
Other Dynascan Corporation Test Equipment manuals
Popular Test Equipment manuals by other brands

Apera Instruments
Apera Instruments LabSen 753 user manual

WIKA
WIKA Wally Box III CPH7600 operating instructions

Hazet
Hazet 7901 operating instructions

REED
REED R5600 instruction manual

Quantifi Photonics
Quantifi Photonics SLED 1000 Series user manual

HYDAC FILTER SYSTEMS
HYDAC FILTER SYSTEMS CTU 1 3 Series Operating and maintenance instructions

Keysight Technologies
Keysight Technologies U3050BH11 User's and service guide

BANTE
BANTE PHscan40BNC instruction manual

inTest
inTest THERMOSTREAM ATS-515 Interface & Applications manual

Hitachi
Hitachi V-151F Operation manual

Anritsu
Anritsu MP1800A Operation manual

Hella Gutmann
Hella Gutmann CSC-Kit Radar II Operating and installation instructions