Elekitsorparts FAA-450 User manual

Elekitsorparts Store Item Name: FAA-450_EU1KY_Antenna Analyzer Item No.: H10010 Document Type: Manual
1
FAA-450 EU1KY Antenna
Analyzer
Operation Guide
Rev 1.01
Elekitsorparts Store
www.elekitsorparts.com

Elekitsorparts Store Item Name: FAA-450_EU1KY_Antenna Analyzer Item No.: H10010 Document Type: Manual
2
1. Description
The FAA-450 Antenna Analyzer is an open source project built from STM32-F7 Discovery board. This project originated from
“EU1KY Antenna Analyzer V3”, which features with BIG COLOR TFT LCD, CAPACITIVE TOUCHSCREEN,
HF/VHF(UHF) frequency coverage, built-in TDR function, and multiple scanning plots besides with SWR. These features may
outperform many expensive antenna analyzers present on the market.The analyzer utilizes the DSP technology to analyze the
sampled and lower converted (10KHz) V & I signal and derive the their magnitude ratio and phase difference. The calibrated
measured results could be very accurate for amateur radio purpose. However, an Open-Short-Load calibration is required to
compensate transmission line influence on measured parameters before the final usage.
Moreover, the device is able to work up to 450 MHz for some less accurate measurements.(Using 3rd harmonics of both signal
and LO above 150 MHz, or above 200 MHz if properly configurated).
The FAA-450 comes with an aluminium enclosure which consists of 6 sheets of 3mm aluminium plates, all are in silvery
anodic oxidation. A cell of 18650 Li-ion battery is needed to power up the analyzer, and you can switch the analyzer to the
charging mode if a USB power source is connected. It will stop the charging process if the battery cell is fully charged.
Also, the analyzer comes with a 16G TF card for storing the calibrated files and saved measurement results, and this could be a
creative feature of this analyzer.
Weighing just over 1.2 pounds, the FAA-450 is ideal for convenient bench work or the field testing, which could be a nice
partner for Radio Amateurs, and RF engineers.
2. Features
Silvery Anodic Oxidation aluminium case
Built-in Li-ion charging circuitry and DC-DC booster
Comes with a N-type to SMA port adapter
Comes with a set of Open-Short-Load calibration kit
Comes with a cloth bag for storing the analyzer
All capacitive touchscreen on the display –no buttons are needed
Elekitsorparts Store Item Name: FAA-450_EU1KY_Antenna Analyzer Item No.: H10010 Document Type: Manual
3
Settings and calibration files could be saved on the TF card
HF/VHF(UHF) contiunous coverage
Big and fast 480×272 4.3″TFT LCD display
PC USB connection is supported for remotely measurement
3. Specification
Frequency Range: 1-150MHz
In/Out Impedance: 50
RF OUT Level: -20 dBm Square Wave Out
Measurement Parameters: SWR, R, +Jx, -Jx, |Z|, Returnloss
Measurement Mode: Single point measurement, Scanning (Frequency Sweep), and TDR Mode
SWR Measurement Range: 1.0-1999(Single Point Mode), 1.0-20.0 (Scan Mode)
Display Modes: Numerical Display, Scan Plots, Smith chart
Connector Type: UHF N-type Connector
LCD size: TFT 4.3″
Touch Screen Type: Capacitive
Power Source: USB or Internal 18650 Li-ion
External Storage Method: TF card
Dimensions: 163·92·37.5 mm (6.42″·3.62″·1.48″)
Weight: 535g (1.18 lbs)
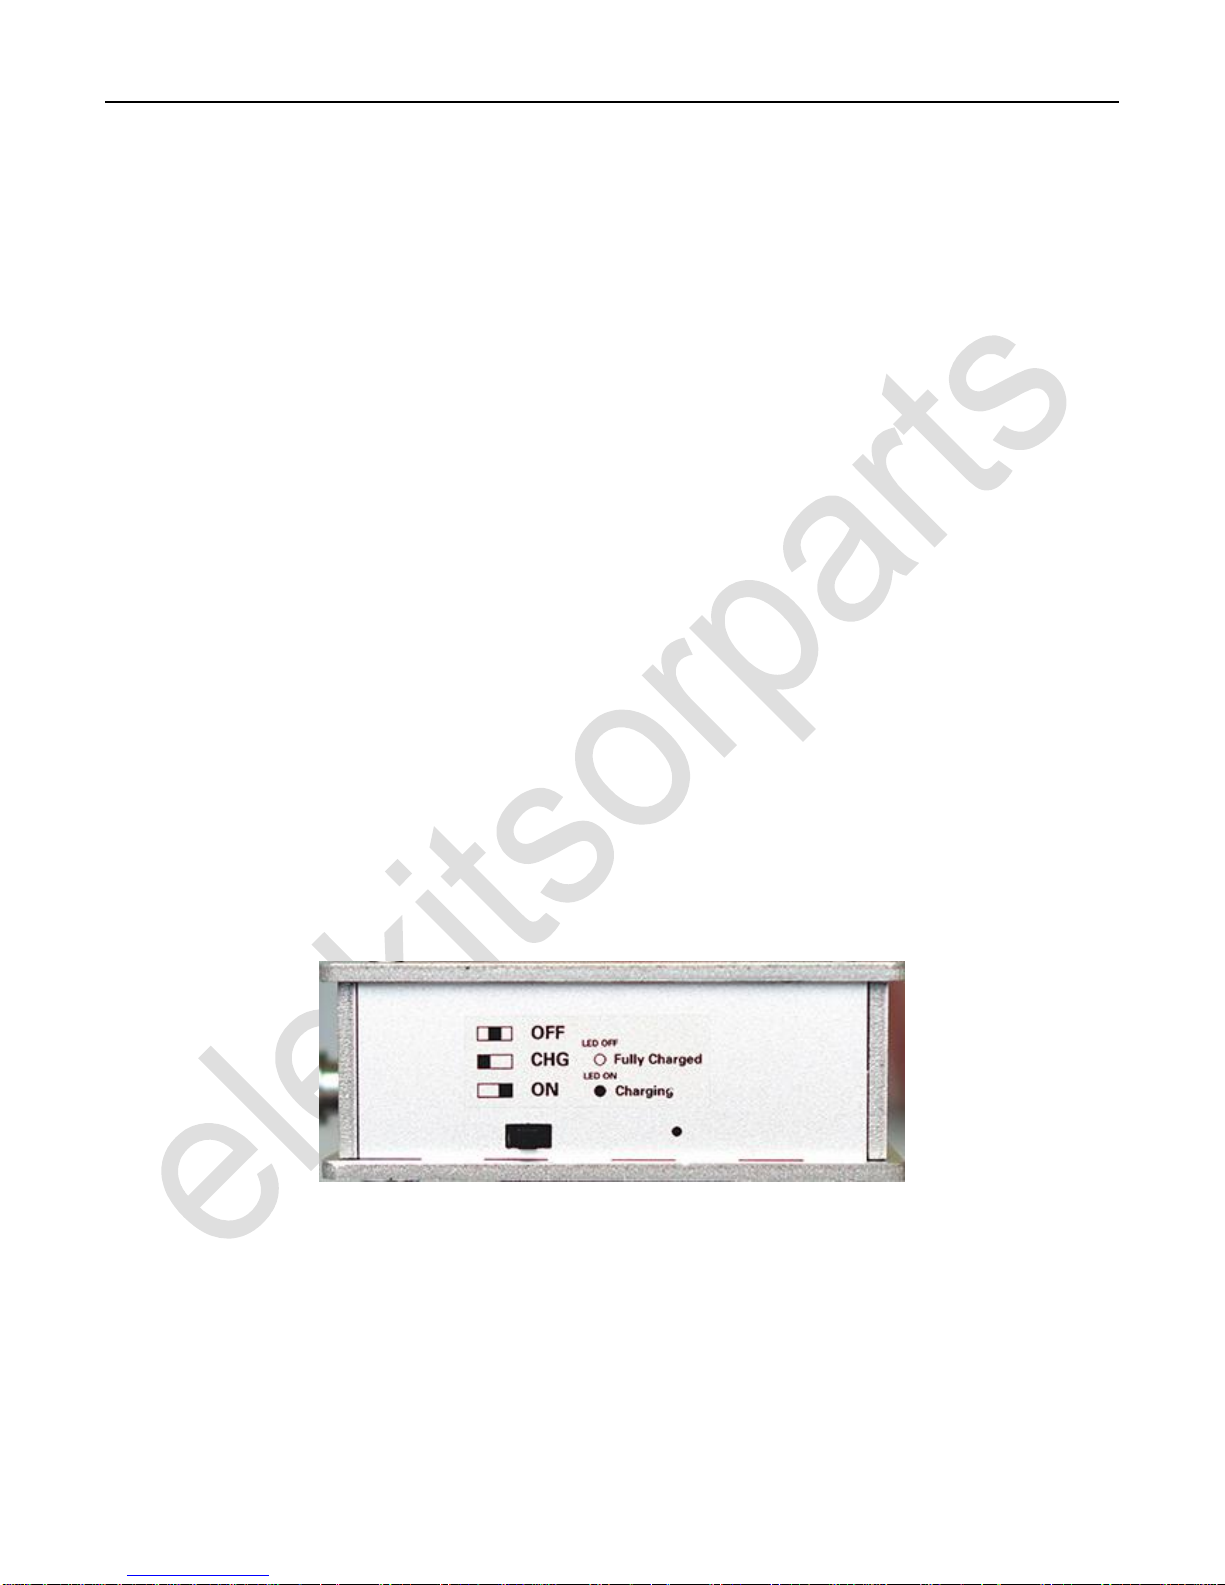
4. Powering it up
The FAA-450 could be powered up by 1 cell of 18650 Li-ion battery or by your PC with a mini-USB cable connected to the
ST-LINK port. A power switch is located at the left side edge of the unit. Sliding the switch to ON for powering the unit on, and
to CHG for charging the internal battery. Don't forget to insert 1 18650 battery before charging up! By sliding the PWR switch
to OFF location, the unit will be powered OFF. The power switch is illustrated as the following pictures:
Picture 1: Power switch
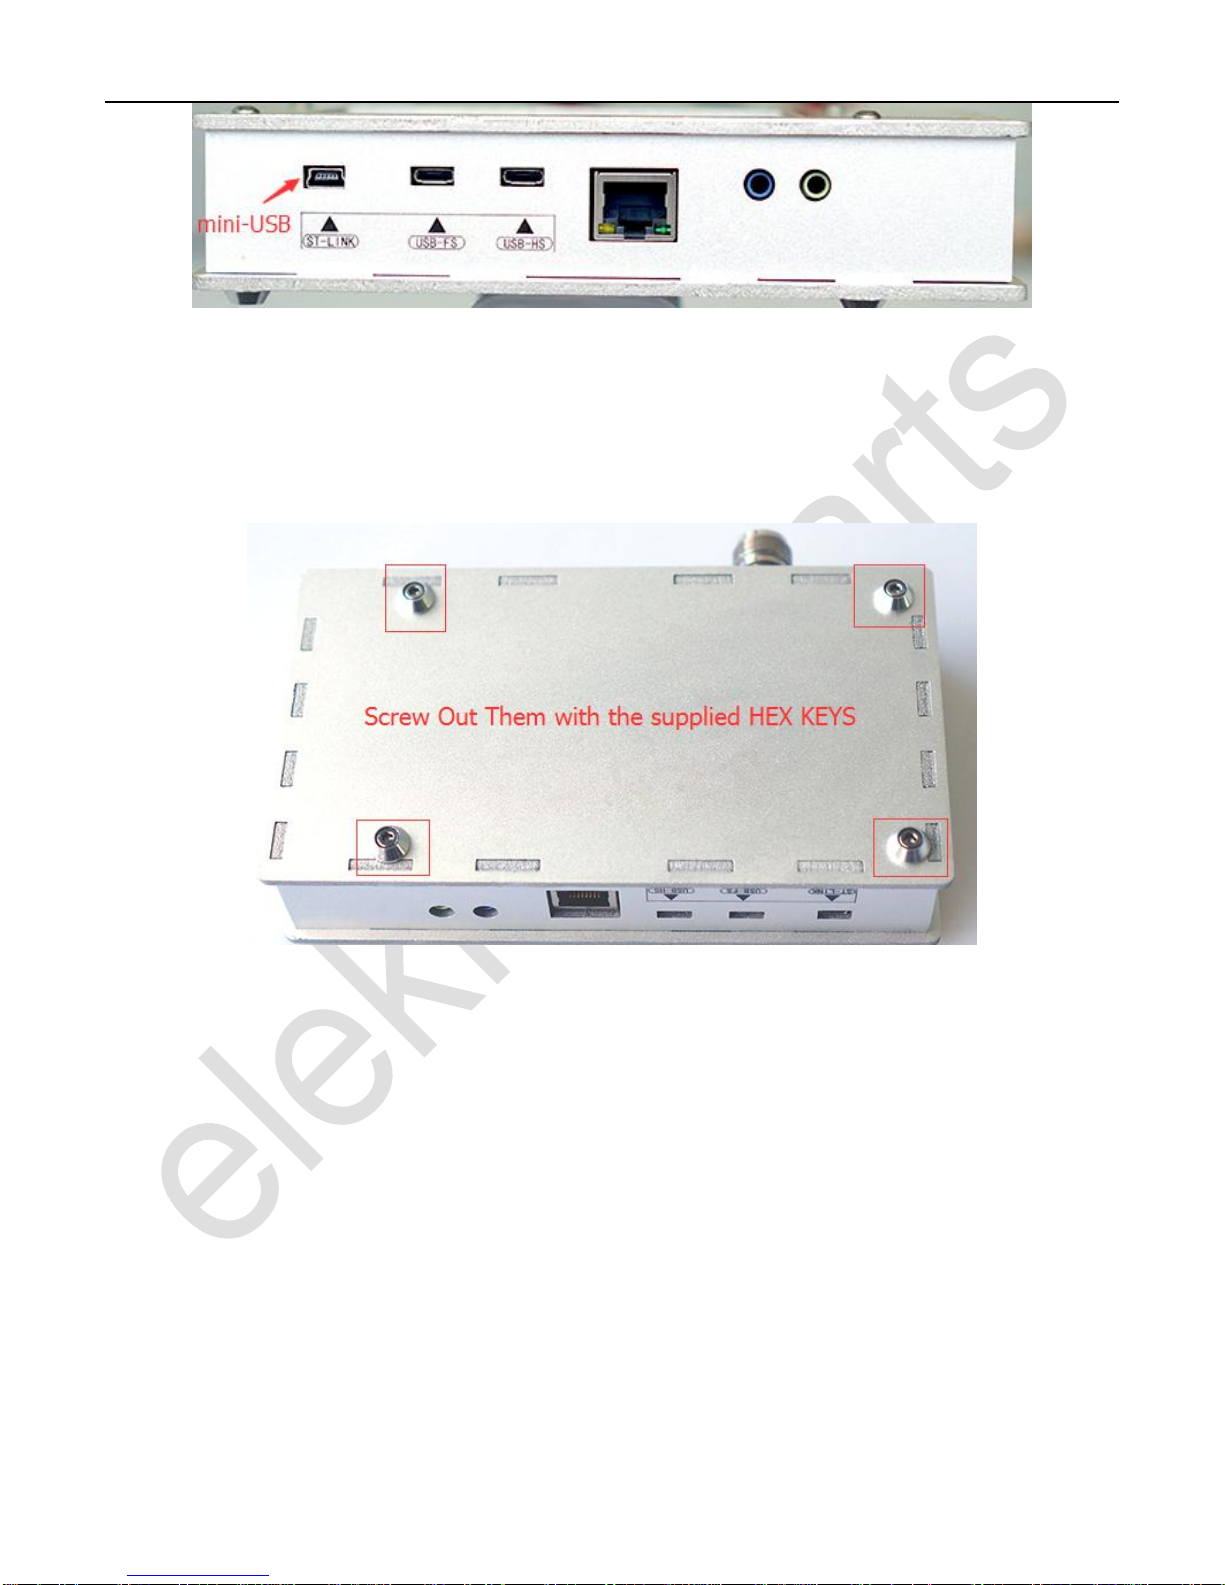
Even if there is no battery installed, you can still power the unit up by your PC with a mini-USB cable connected to the unit’s
ST-LINK port. Due to the ST-LINK circuitry regulations on STM32F7-Disco board, connecting this port to a cell phone charger
or other power supply except a PC may not power up the unit or charge the internal 18650 battery. There is no this problem on
some earlier versions of STM32F7-Disco boards.
Elekitsorparts Store Item Name: FAA-450_EU1KY_Antenna Analyzer Item No.: H10010 Document Type: Manual
4
Picture 2: Powering the Unit Up from ST-LINK Port
5. Battery Installation
The FAA-450 uses 1 cell of 18650 LI-ion battery as the internal power source, and there is an battery holder inside its metal
case. For installing a 18650 battery, you need to open its back cover by screwing out the 4 socket head cap screws with the
supplied hex keys.
Picture 3: Screw out the 4 socket head cap screws
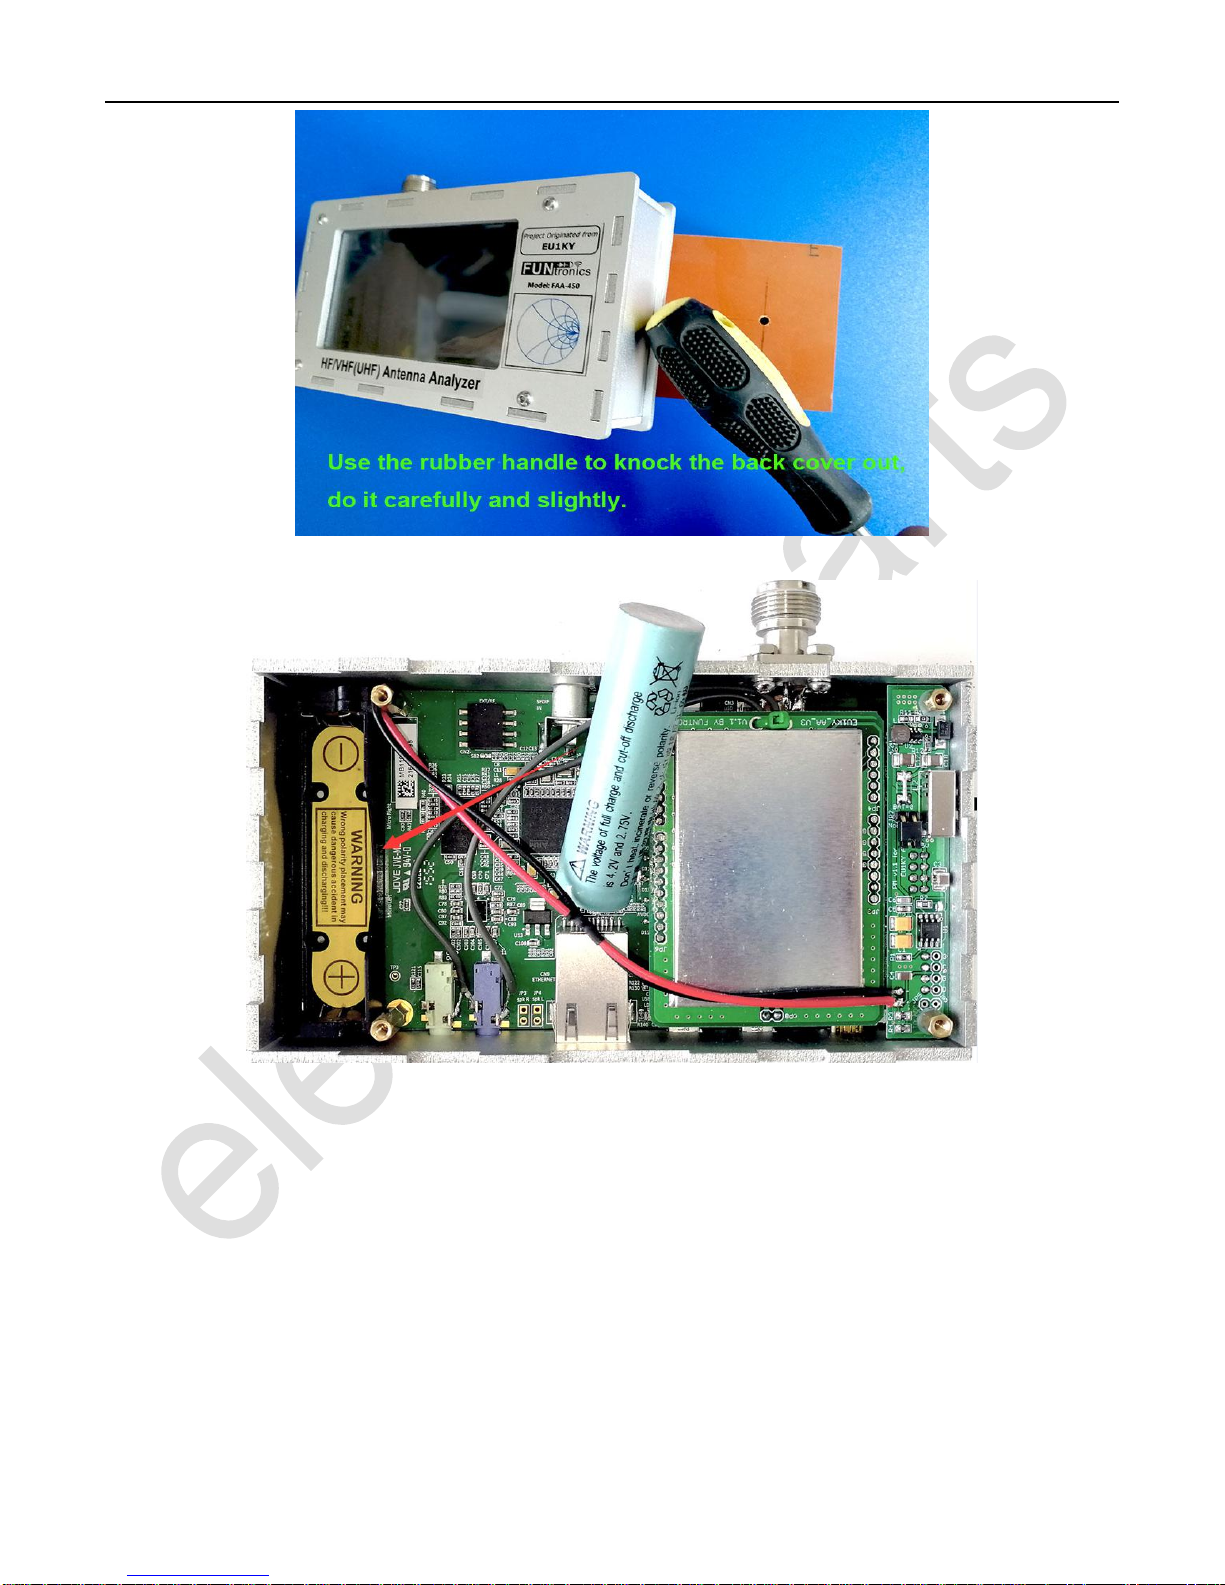
Then, open the back cover carefully and slowly, if it's tight, use a rubber hammer or wooden hammer or a screw driver's handle
to knock the back cover out slightly. Do not use to much strength, as this may make the aluminium sheet deformed.
Elekitsorparts Store Item Name: FAA-450_EU1KY_Antenna Analyzer Item No.: H10010 Document Type: Manual
5
Picture 4: Knocking out the back cover by the rubber handle
Picture 5: Installing the 18650 battery
Also follow the instructions below to activate the battery holder:
1. Insert the battery to the battery holder, pay attention to the Positive and Negative polarity when doing this.
2. Connect the analyzer to your PC with a mini-USB cable (ST-LINK).
3. Slide the switch to CHG to activate the battery holder. When it is in CHG, the ORANGE led will be light. That says the
battery is being charged.
4. To test battery, dis-connect the mini-USB cable and slide the switch to ON, and this will power the analyzer on.
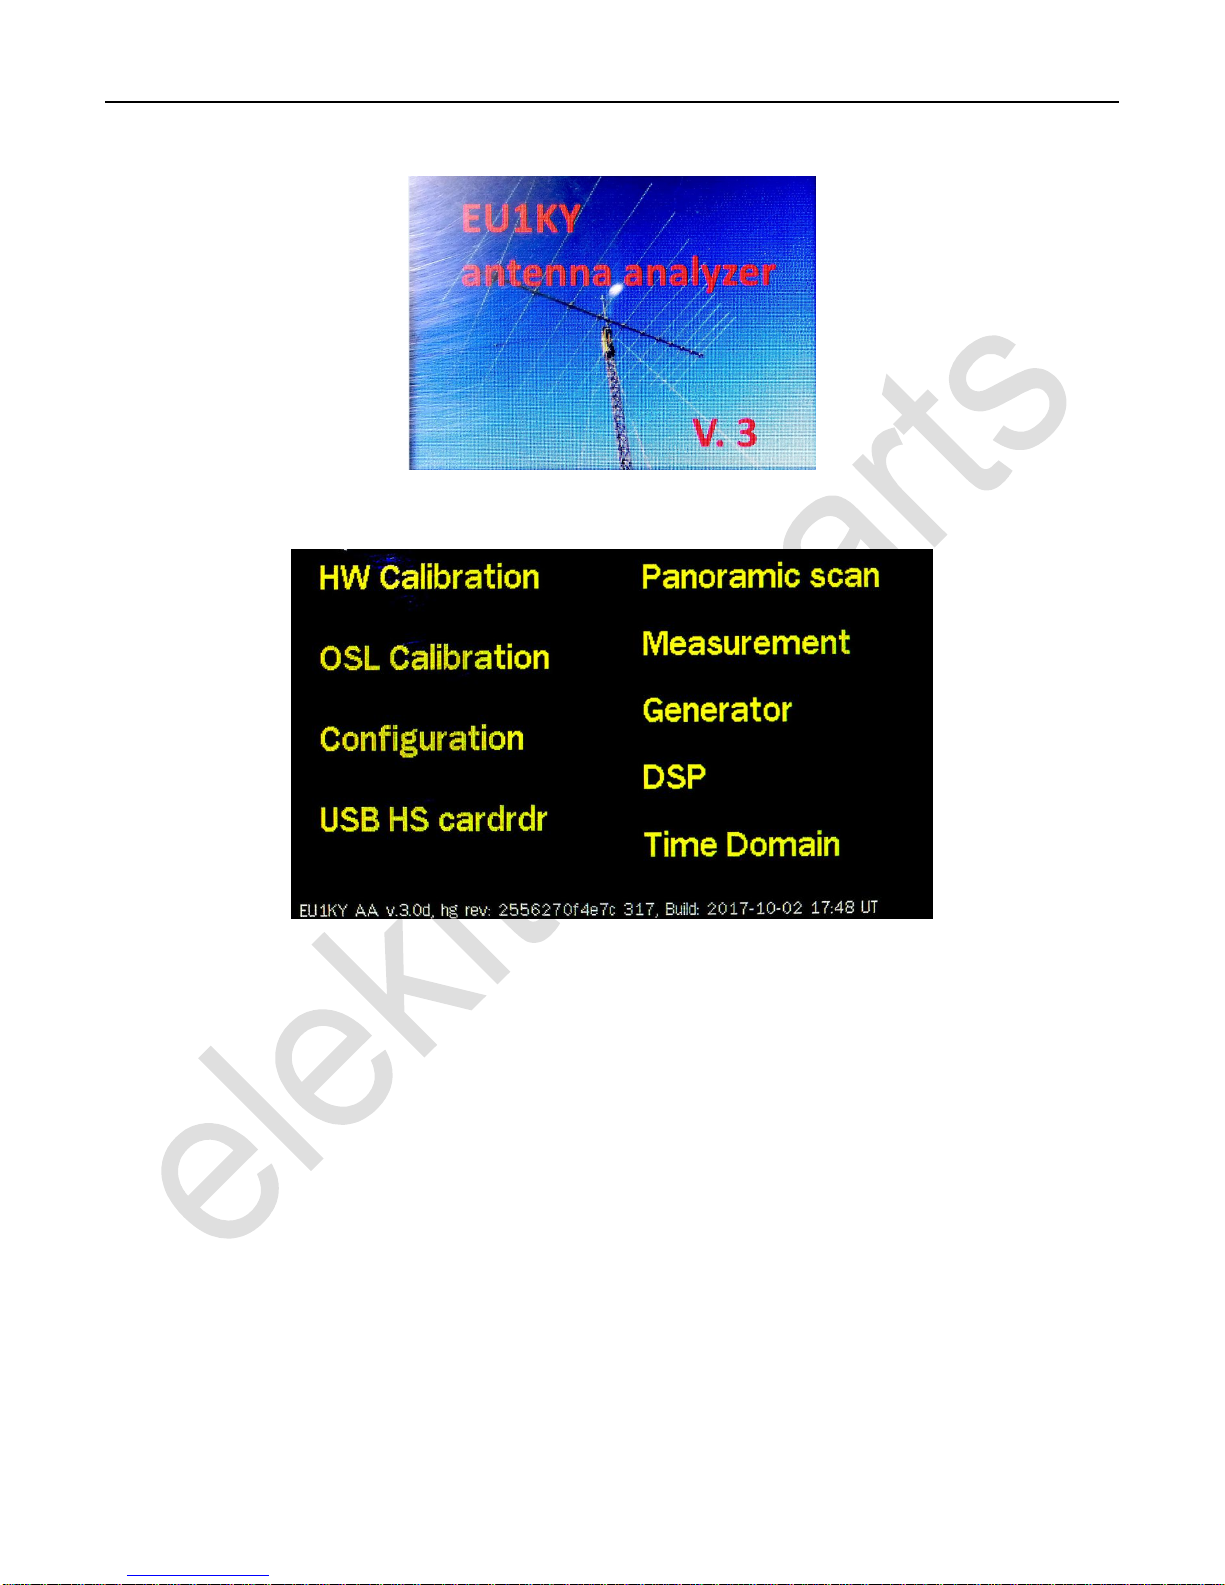
6. Main Screen
The EU1KY FAA-450 analyzer is very different from other antenna analyzers, there is no buttons, switches, tuning pots on the
unit, and all of the operations are through the touch screen When the unit is switched ON, the main screen displays ‘EU1KY
Elekitsorparts Store Item Name: FAA-450_EU1KY_Antenna Analyzer Item No.: H10010 Document Type: Manual
6
antenna analyzer V.3’ shortly, then goes to the main menu, where we can access all of the functions of this analyzer. See the
picture below:
Picture 6: EU1KY antenna analyzer v.3
Picture 7: Main screen of FAA-450
There are 9 items on the main screen, click one of them will enter into them or the sub-item. The short description of each item
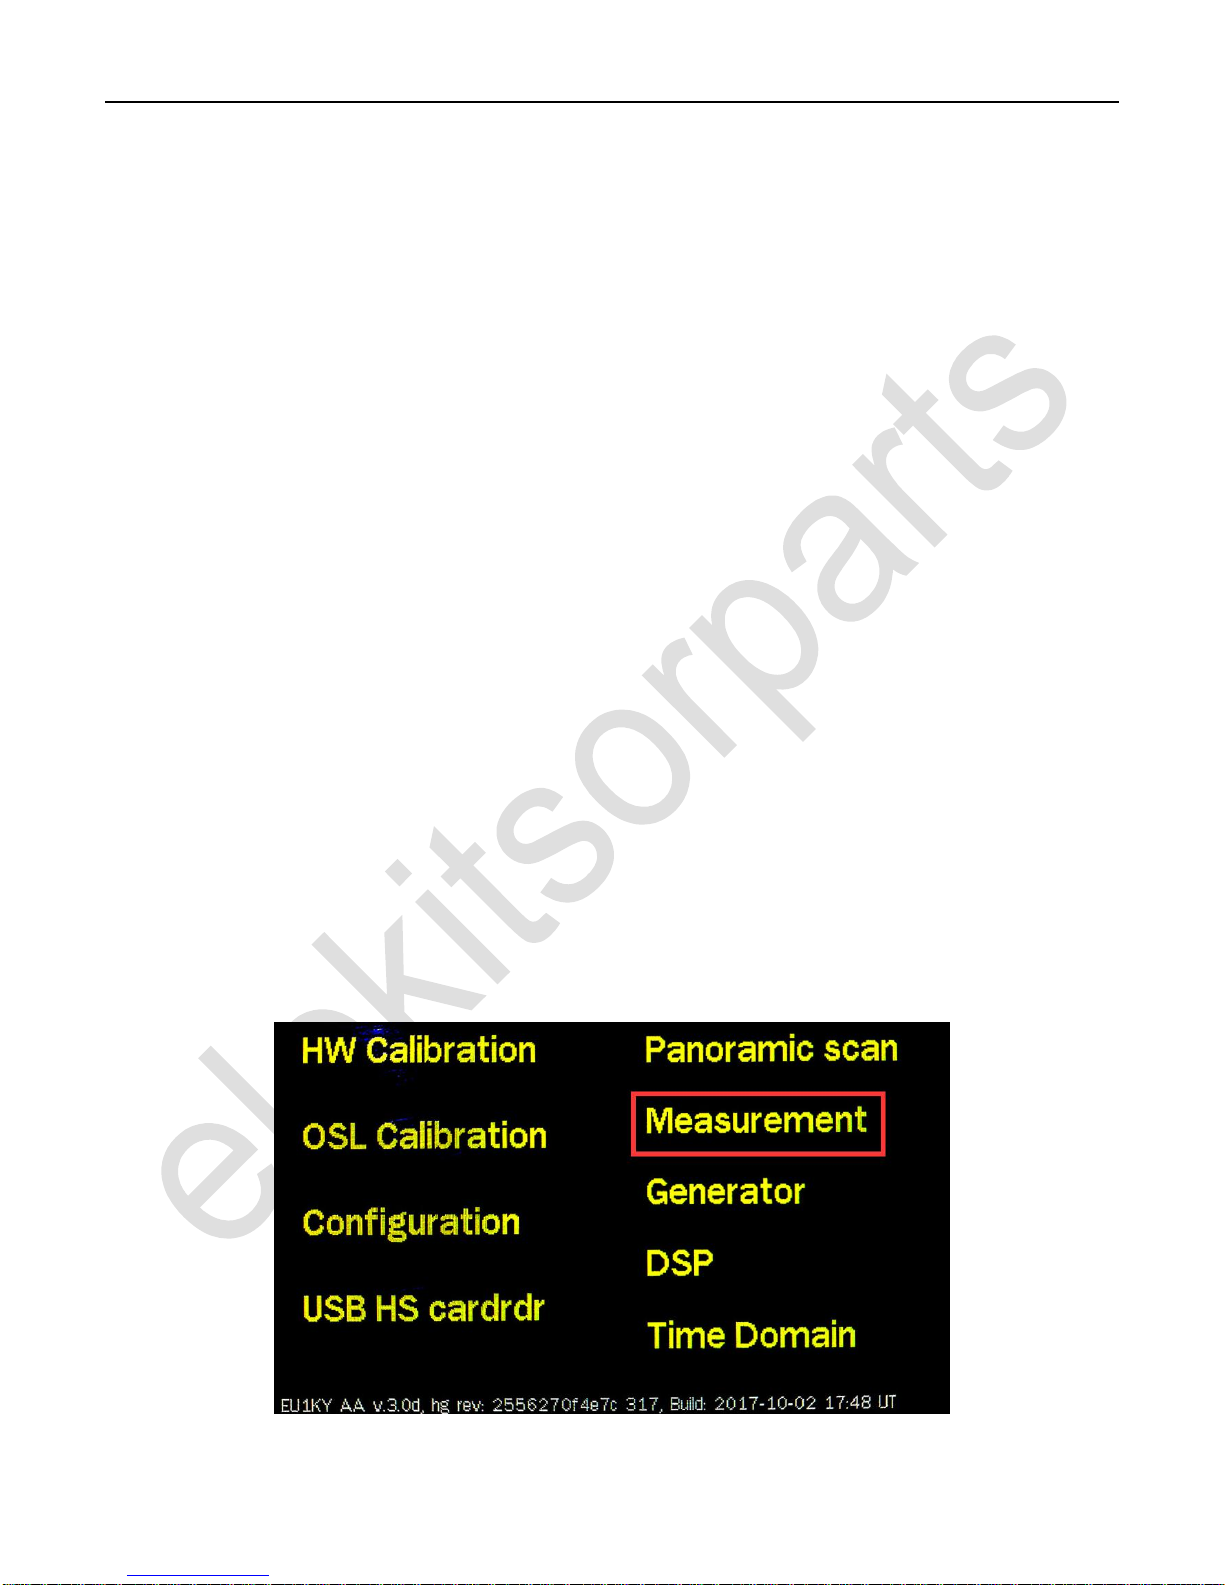
is as the following:
1. HW Calibration: This is for Hardware Calibration Process, the jumper on the RF board should be set to ‘HWCal’ before
this operation. The HWCal is used when the unit is initially assembled and for testing the RF front end only.
2. OSL Calibration: This is for Open-Short-Load calibration. It is really important, and the jumper on RF board should be
set to ‘Work’. The calibrated file is stored on the SD card for the measurement correction. The calibrated value will be
used in the real work.
3. Configuration: This sub-menu is used for configuring some physical and operational parameters of this analyzer, all of
the parameters set here will be stored in the TF card as file AA/CONFIG/CONFIG.BIN. Please keep in mind that the
configurations in this sub-menu is really important, make sure you know what to do here before changing any of the
parameters.
4. USB HS cardrdr: USB storage access via USB HS port. You can access the on board TF card via this sub-menu by
connecting a micro-USB cable to STM32F746G-Disco board’s USB-HS port. This item is really useful for access the
screen snap file, configuration file, and the calibration file, as you don’t need an additional USB card reader to do this.
5. Panoramic scan: A panoramic scan can make a measurement really intuitive, especially when measuring an antenna’s
lowest SWR points, it’s really straight-forward, and useful. You can set the scan beginning frequency and the span, and all
Elekitsorparts Store Item Name: FAA-450_EU1KY_Antenna Analyzer Item No.: H10010 Document Type: Manual
7
of the measurement results will be kept in plot on the screen.
6. Measurement: Unlike the panoramic scan, which scans the frequency point from one to another, this item takes a single
point measurement, but it keeps several measured results in one screen, VSWR, R, X, Z, MCL and Mag Difference etc.
7. Generator: In generator, you can view some basic raw values of the DSPed value, such as Vi, Vv, Mag Ratio, Phase
Difference, and all of them are RAW value, that says they are not corrected by the calibrated values. These values are
useful for diagnostic purpose. You set the frequency point in this mode, and there is a RF square wave output from the
antenna port.
8. DSP: This is for monitoring the magnitude of the 2-channel 10KHz signals coming from the RF front end, also for the
diagnostic only.
9. Time Domain: A time domain measurement is a higher-level usage of this instrument. It detects the reflected signal in the
cable and measures the distance from the RF feeding point to the reflection point. This is useful as you can determine the
broken point of your coax cable, or the length of your coax if there is no broken point. Please keep in mind that all of the
measurement results are based on the preset TDR Velocity Factor (0.66 by default), which you can access from the
configuration sub-menu.
7. Operation
For a better understanding of this analyzer, this operation section will be divided into 3 parts, according to the different usage
levels and instrument functions. They are basic operations, configurations and calibrations, system monitoring.
In Basic Operation, the menu item ‘Measurement, Panoramic Scan, and USB HS cardrdr and Time Domain’ will be covered. In
Configuration and Calibrations, ‘HW Calibration, OSL Calibration, Configuration’ will be included, and in System Monitoring,
the menu item ‘DSP and Generator’ will be covered.
7.1 Basic Operation
In this part, we will introduce the menu item ‘Measurement, Panoramic Scan, and USB HS cardrdr and Time Domain’, most of
which will be accessed when doing the real antenna measurements.
7.11 Measurement
In the main screen, touching ‘Measurement’ will get into the single frequency point measurement mode. See the pictures below:
Picture 8: Touching ‘Measurement’ to get into measurement mode
Elekitsorparts Store Item Name: FAA-450_EU1KY_Antenna Analyzer Item No.: H10010 Document Type: Manual
8
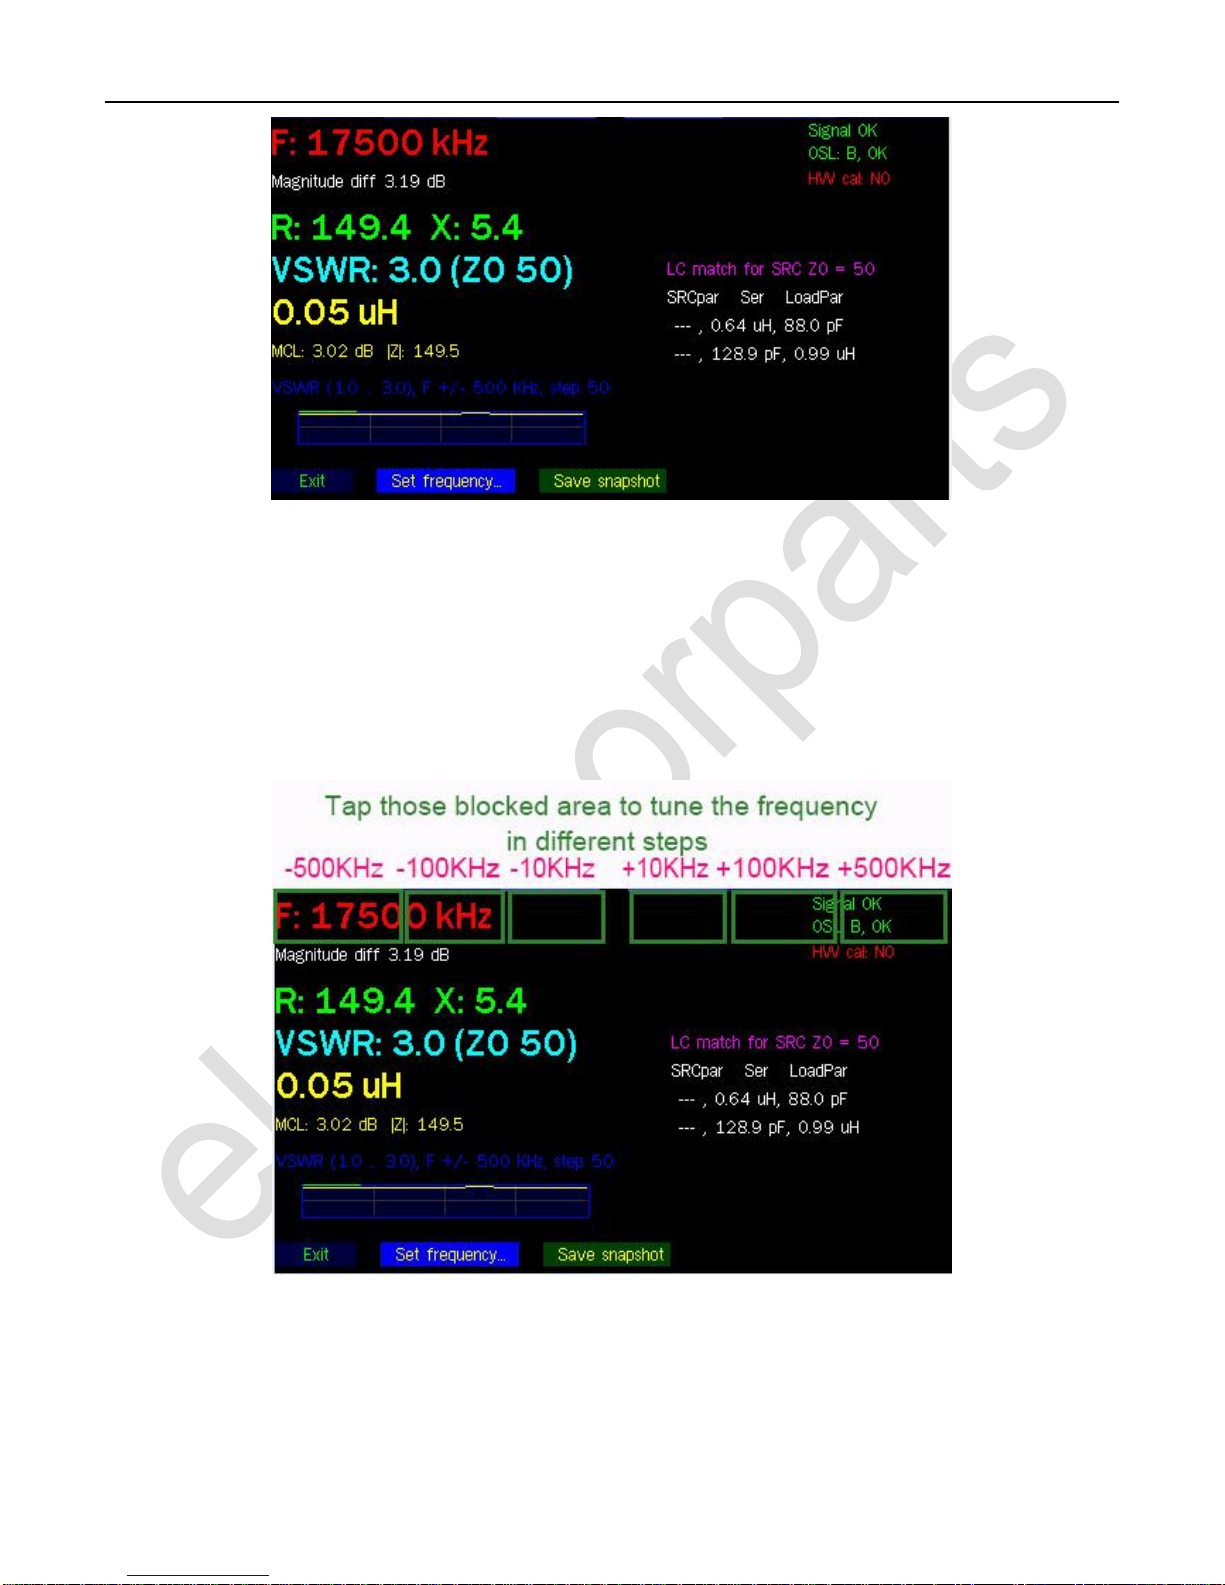
Picture 9: Main display in measurement mode
In the main screen of Measurement mode, the unit measures the connected antenna, and returns several measured values: R, X,
VSWR, MCL, |Z|, Equivalent L or C, LC Match Parameters, and Smith Chart.
A. Frequency Tuning:
There are 2 ways to change the frequency in this mode, one is to tap the upper part of the screen for tuning the frequency in
10KHz, 100KHz and 500KHz steps, and the other one is to ‘click Set Frequency’ button located on the lower part of the screen
for directly inputting the desired frequency. See the following pictures:
Picture 9: Frequency tuning in measurement mode
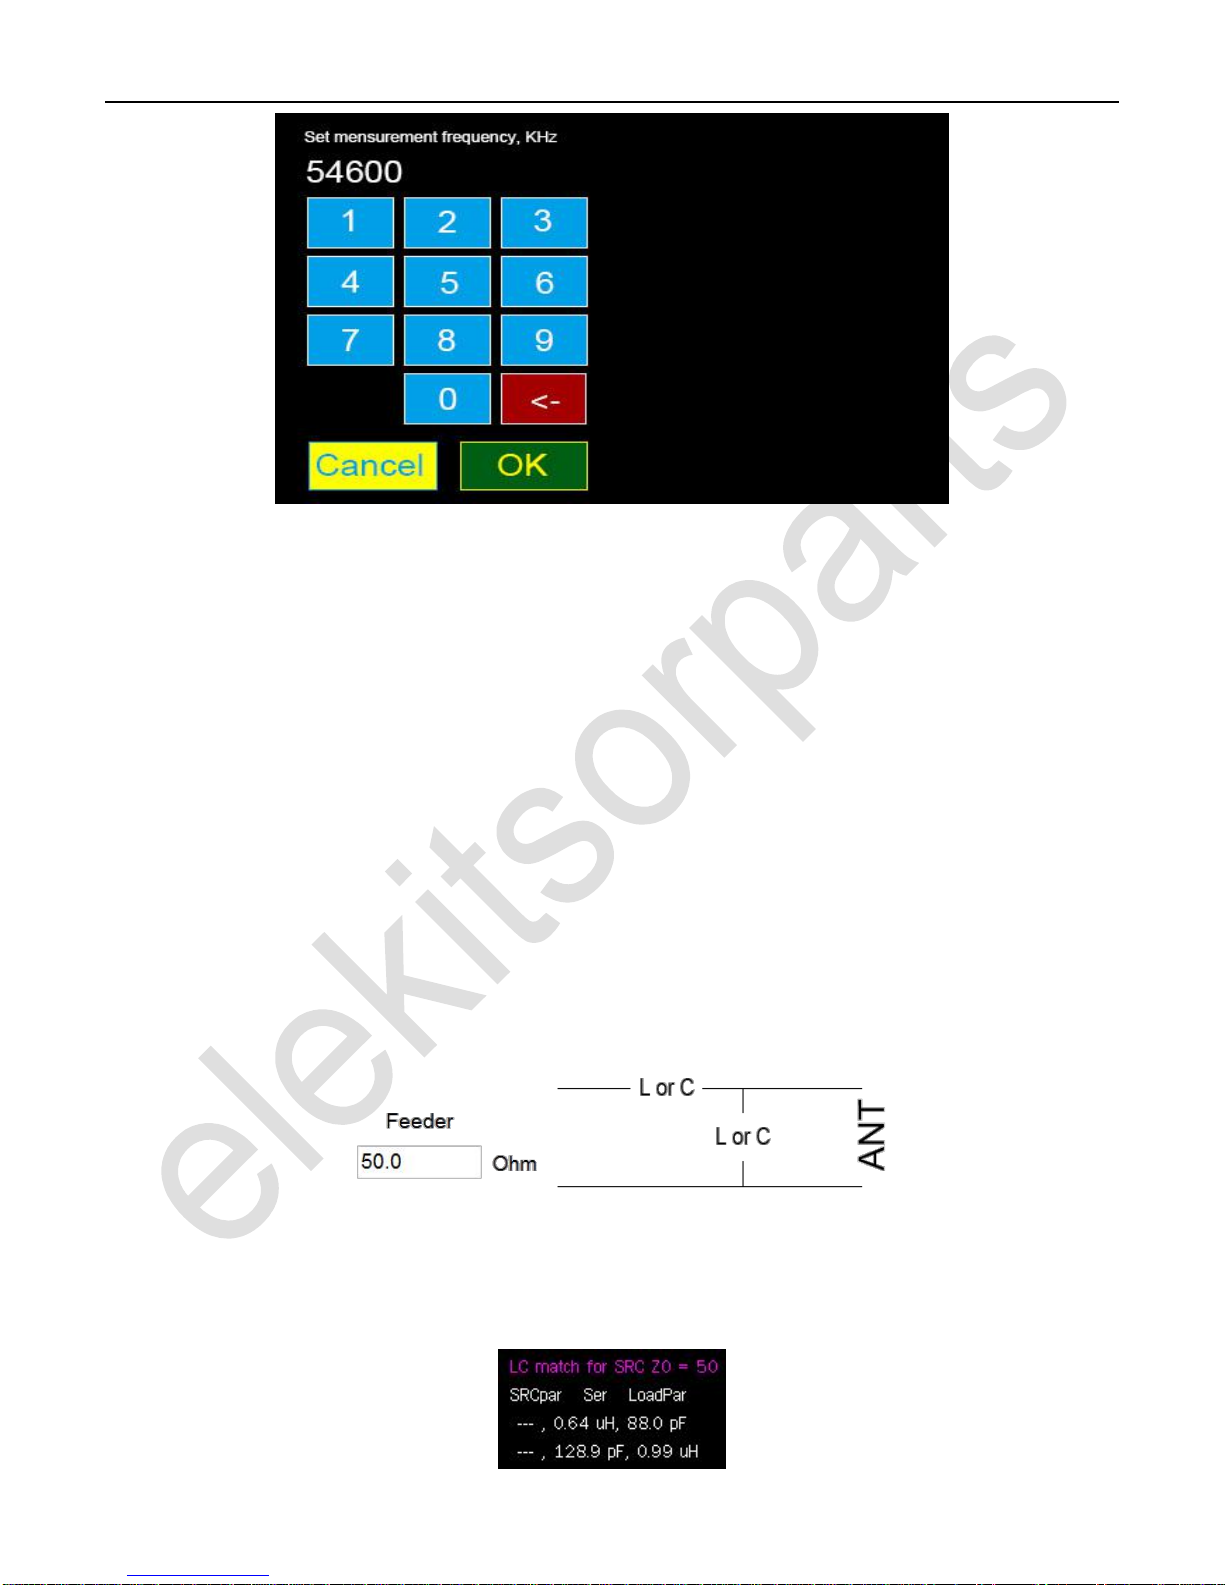
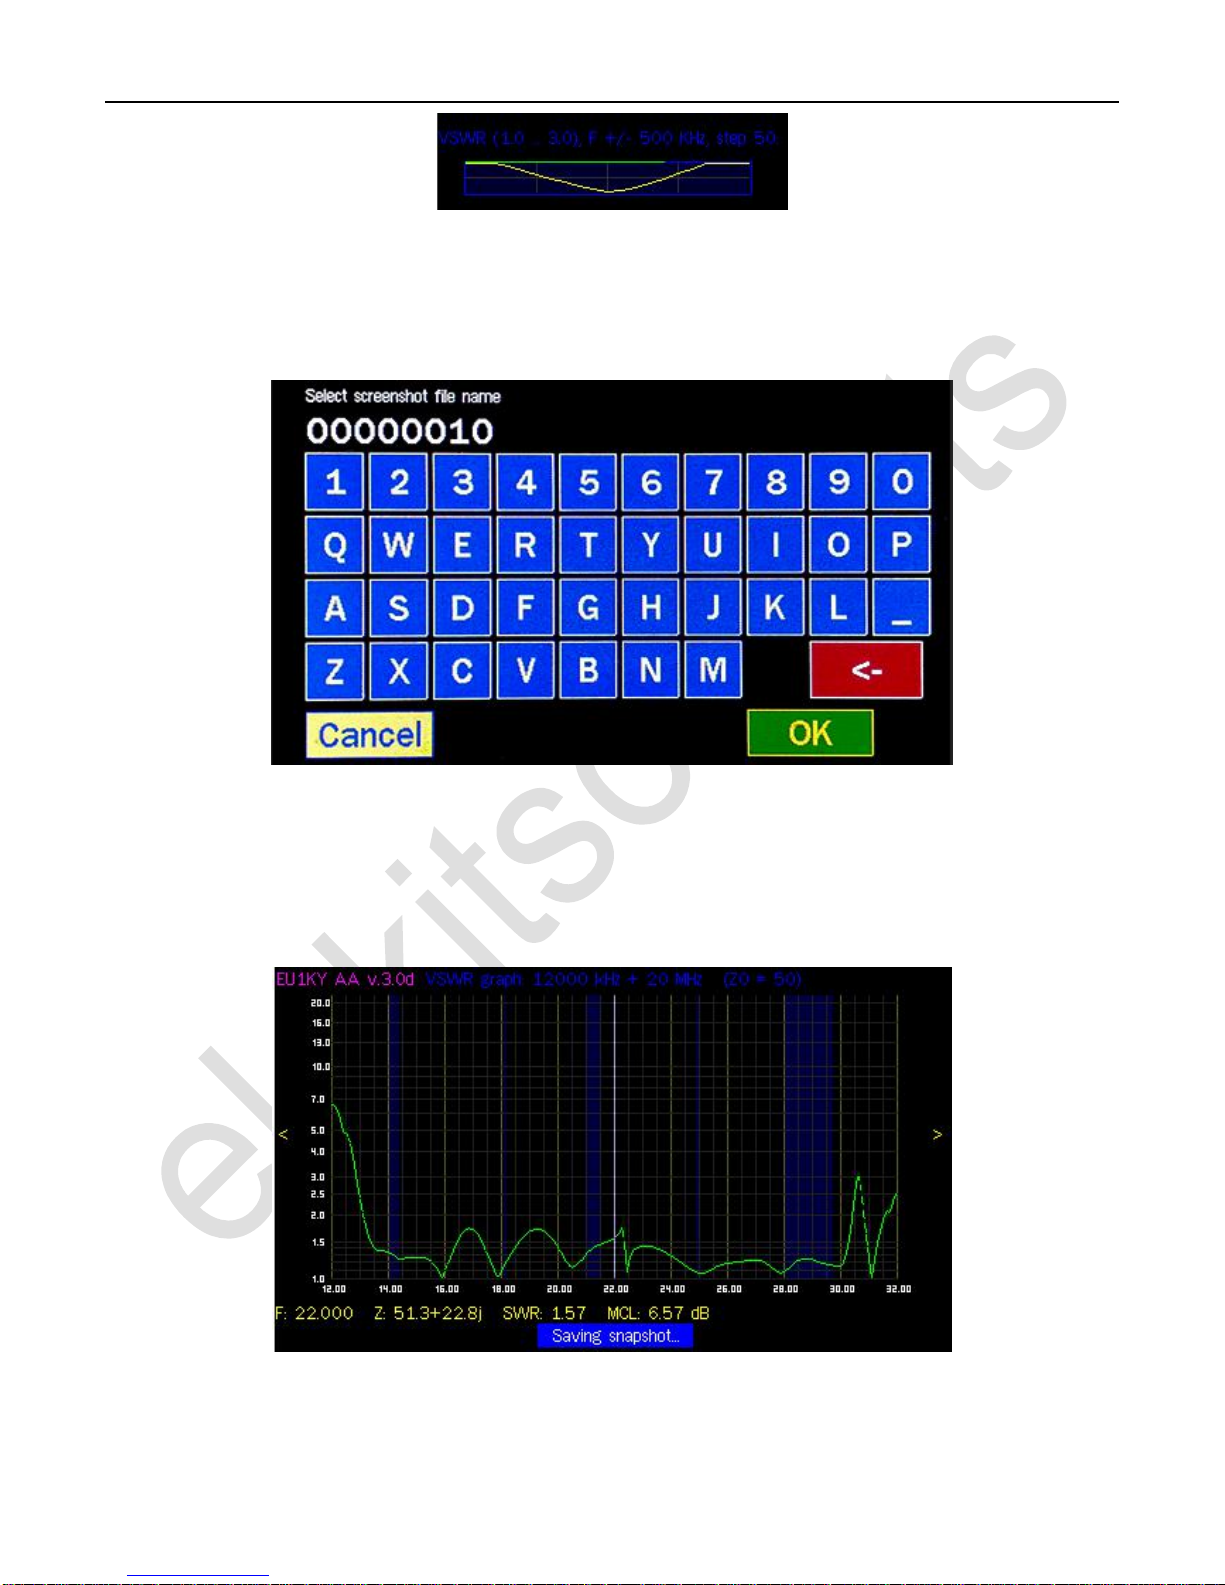
If we click the ‘Set frequency..’ button, the unit will show the direct frequency input screen.Tap the numbers on the screen to
input the frequency in KHz, click ‘OK’ to confirm. Click ‘<-’ to delete the last input. Clicking ‘Cancel’ will cancel the input and
return to the measurement screen.
Elekitsorparts Store Item Name: FAA-450_EU1KY_Antenna Analyzer Item No.: H10010 Document Type: Manual
9
Picture 10: Direct frequency input in measurement mode
B. Measured Parameters:
The explanation of the measured antenna parameters is as the following:
R: The true resistance value of the measured antenna, in OHM. It’s part of the complex impedance.
X: The reactance value of the measured antenna, in OHM, could be Positive or Negative. It’s part of the complex impedance.
The frequency point where X closes to zero is the true resonant point of the antenna. If the measured X is in Positive, that
means the reactance part of antenna acts like a inductance, while it is in Negative, it means it acts like a capacitance.
VSWR: SWR ratio, measured range from 1 to 1999. The bigger this value, the more reflected energy in your antenna, and the
lower efficiency.
MCL: Measured Cable Loss, in dB, it tells you the loss of your coax. Please note that when measuring the loss of a coax, the
far end of the coax should be left open with no loads connected. The bigger number in this value, the more lossy coax.
|Z|: The general complex impedance of an antenna, in OHMs. |Z| = R +/- (X)
Equivalent L or C: When the X > 3 or X < -3, the unit will give the equivalent L or C value. X = 2*Pi*F*L or X = 1 /
2*Pi*F*C. When X is positive, it gives the equivalent L in uH. When X is negative, it gives the equivalent C in pF.
LC Match Parameters: It represents the L or C value needed for a good match to 50 ohms. LC match is widely used in a
mismatched system for matching the system to Z0=50 OHM. It is commonly used in antenna tuners. The calculated values in
FAA-450 could be represented in the following chart:
Picture 11: LC match
For example, the calculated LC match for 50 ohms @17.5MHz is 0.64uH, 88pF, or 128.9pF, 0.99uH. In FAA-450, it shows the
following chart on the right part of the screen.
Elekitsorparts Store Item Name: FAA-450_EU1KY_Antenna Analyzer Item No.: H10010 Document Type: Manual
10
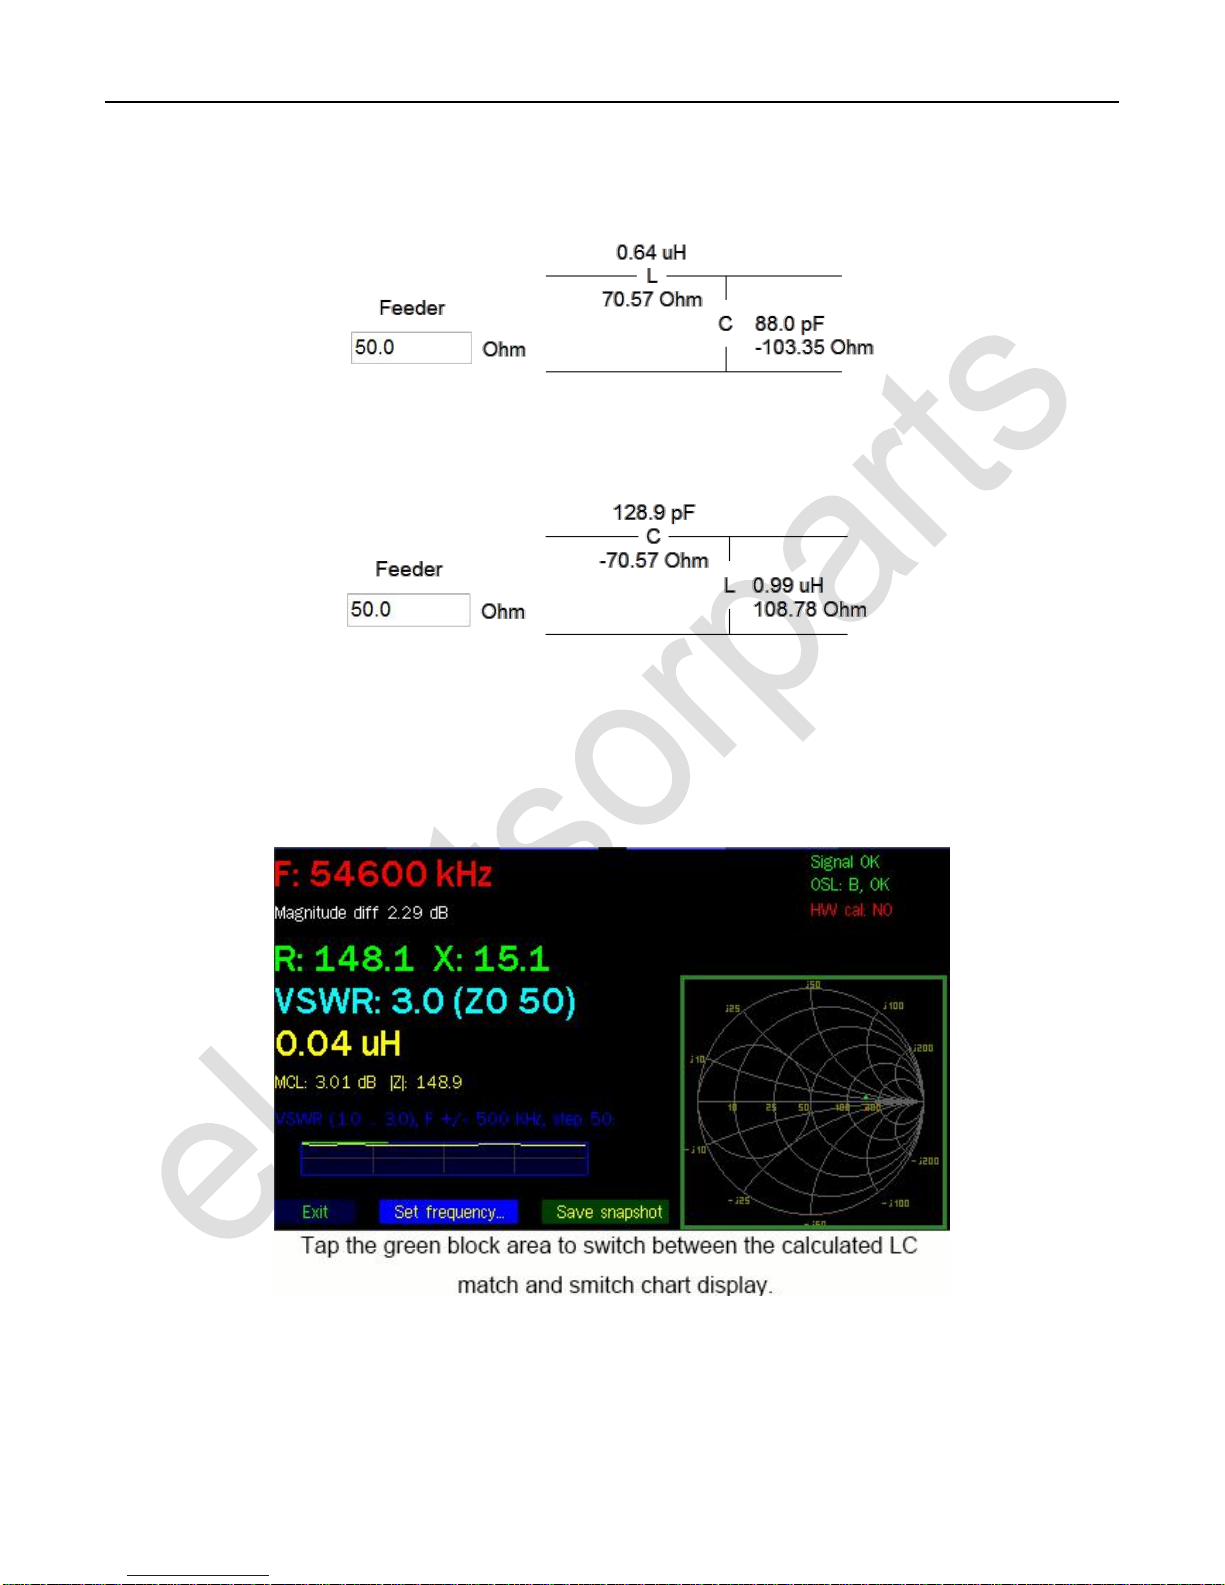
Picture 13: The Calculated LC Match Value on FAA-450
We could use the charts below to represent them. Each set of the values can transform the mismatched impedance to a true 50
OHM system.
Picture 14A: LC Match in Parallel C Configuration
OR
Picture 14B: LC Match in Series C Configuration
Smith Chart: FAA-450 also support the smith chart display. There is a green point mark in the circle (smith chart). The
diameter of the circle is labeled 10, 25, 50, 100, 200 ohms. Normally, for a well matched 50 ohm system, the green point mark
should be located rightly on the diameter line of the circle, without any up or down offset, and that says X = 0. For a detailed
information on how to use smith chart, please read the Smith Chart chapter of ARRL Antenna Book.
Picture 15: LC Match in Series C Configuration
C. Other Information:
There is also a small area of screen that shows the SWR plot in the span of +-500KHz, from SWR1.0 to SWR 3.0. It is really
convenient for monitoring the band-width of an antenna as you do not need to go to the panoramic scan.
Elekitsorparts Store Item Name: FAA-450_EU1KY_Antenna Analyzer Item No.: H10010 Document Type: Manual
11
Picture 16: SWR plot view in measurement mode
To exit ‘Measurement’ mode, just click ‘Exit’ button, then the unit goes back to the main menu screen.
To snapshot the measurement screen, just click ‘Save snapshot’ button, it then goes into the file naming screen. Tap the numbers
and characters on the screen to name the saved file, and then click ‘OK’, see the picture below:
Picture 17: File naming screen in snapshot
7.12 Panoramic Scan
In the main screen, touching ‘Panoramic scan’ will enter the panoramic scan mode. A panoramic scan can make a measurement
really intuitive, especially when measuring an antenna’s lowest SWR points, it’s really straight-forward and helpful. You can set
the scan beginning frequency and the span, and all of the measurement results will be kept in plot on the screen.
Picture 18: Panoramic scan
In panoramic scan mode, there are 4 types of graphs(plots) could be switched between, and they are VSWR graph, R/X graph,

Elekitsorparts Store Item Name: FAA-450_EU1KY_Antenna Analyzer Item No.: H10010 Document Type: Manual
12
S11 graph, and Smith chart. There are also 2 key parameters for setting in this mode, Starting or Central Frequency and
Frequency Span. See the picture below for frequency setting and graph switching. In addition, a marker is also enabled on the
screen in panoramic scan mode, to change the maker position, just touch and hold the left or right arrow on the screen.
Picture 19: Changing frequency and graph switching in panoramic scan
Picture 20: Maker operation in panoramic scan
A. Frequency and Span:
To set the frequency, tap the upper green blocked area in picture 19, and then getting into the frequency and span setting screen,
see the pictures below. Please note that you can set the scanning frequency as the scanning starting frequency or the central
frequency, and you need to configure it in the configuration menu first. By default, the system uses the scanning starting
frequency as the default scanning mode in panoramic scan.
If the PAN_CENTER_F is set to Start F in Configuration Editor, the Scanning range = starting frequency + span, and if it is set
to Center F, the Scanning range = span/2 + central frequency + span/2.

Elekitsorparts Store Item Name: FAA-450_EU1KY_Antenna Analyzer Item No.: H10010 Document Type: Manual
13
Picture 21: Input frequency in panoramic scan
Picture 22: Setting span in panoramic scan
B. Different Graphs (Plots):
4 types of graphs (plots) could be selected in panoramic scan mode. Tap the central green blocked area to switch between them
as it shows in picture 19.
In VSWR graph, x axis is the frequency span, and y axis is the swr value. In R/X graph, x axis is the frequency span, and y axis
is the R or X value in OHMs, ranging from -2000 ohms to 2000 ohms. Please also note that the y axis labeled value range could
be dynamically changed according to the measured max and min R or X value. In S11 graph, x axis is frequency span, which is
the same to the 2 previous graphs, while y axis is the return-loss in dB, whose labeled range can also be dynamically changed
according to the measured max values. The final graph is the smith chart, which is very different from the previous 3 graphs.
There no x and y axis in this graph. Instead, the horizontal diameter line of the circle shows the R value ranged from 0 to 2000
ohms, while the arc on the circle is the X value ranged from -2000 ohms to 2000 ohms.

Elekitsorparts Store Item Name: FAA-450_EU1KY_Antenna Analyzer Item No.: H10010 Document Type: Manual
14
Picture 23: Smith chart in panoramic scan
C. Other Information:
To exit the panoramic mode and return to the main screen, just tap ‘Exit’ button on the lower end of the screen. Tapping the
‘Save snapshot’ will save the current measurement to TF card in PNG format. Tapping ‘Auto (fast, 1/8 pts)’ will perform a
automatic real-time continuous scanning. To make a single time scan, tap ‘Scan’ button one time.
Picture 24: Other buttons on the lower part of the screen in panoramic scan
7.13 USB HS cardrdr
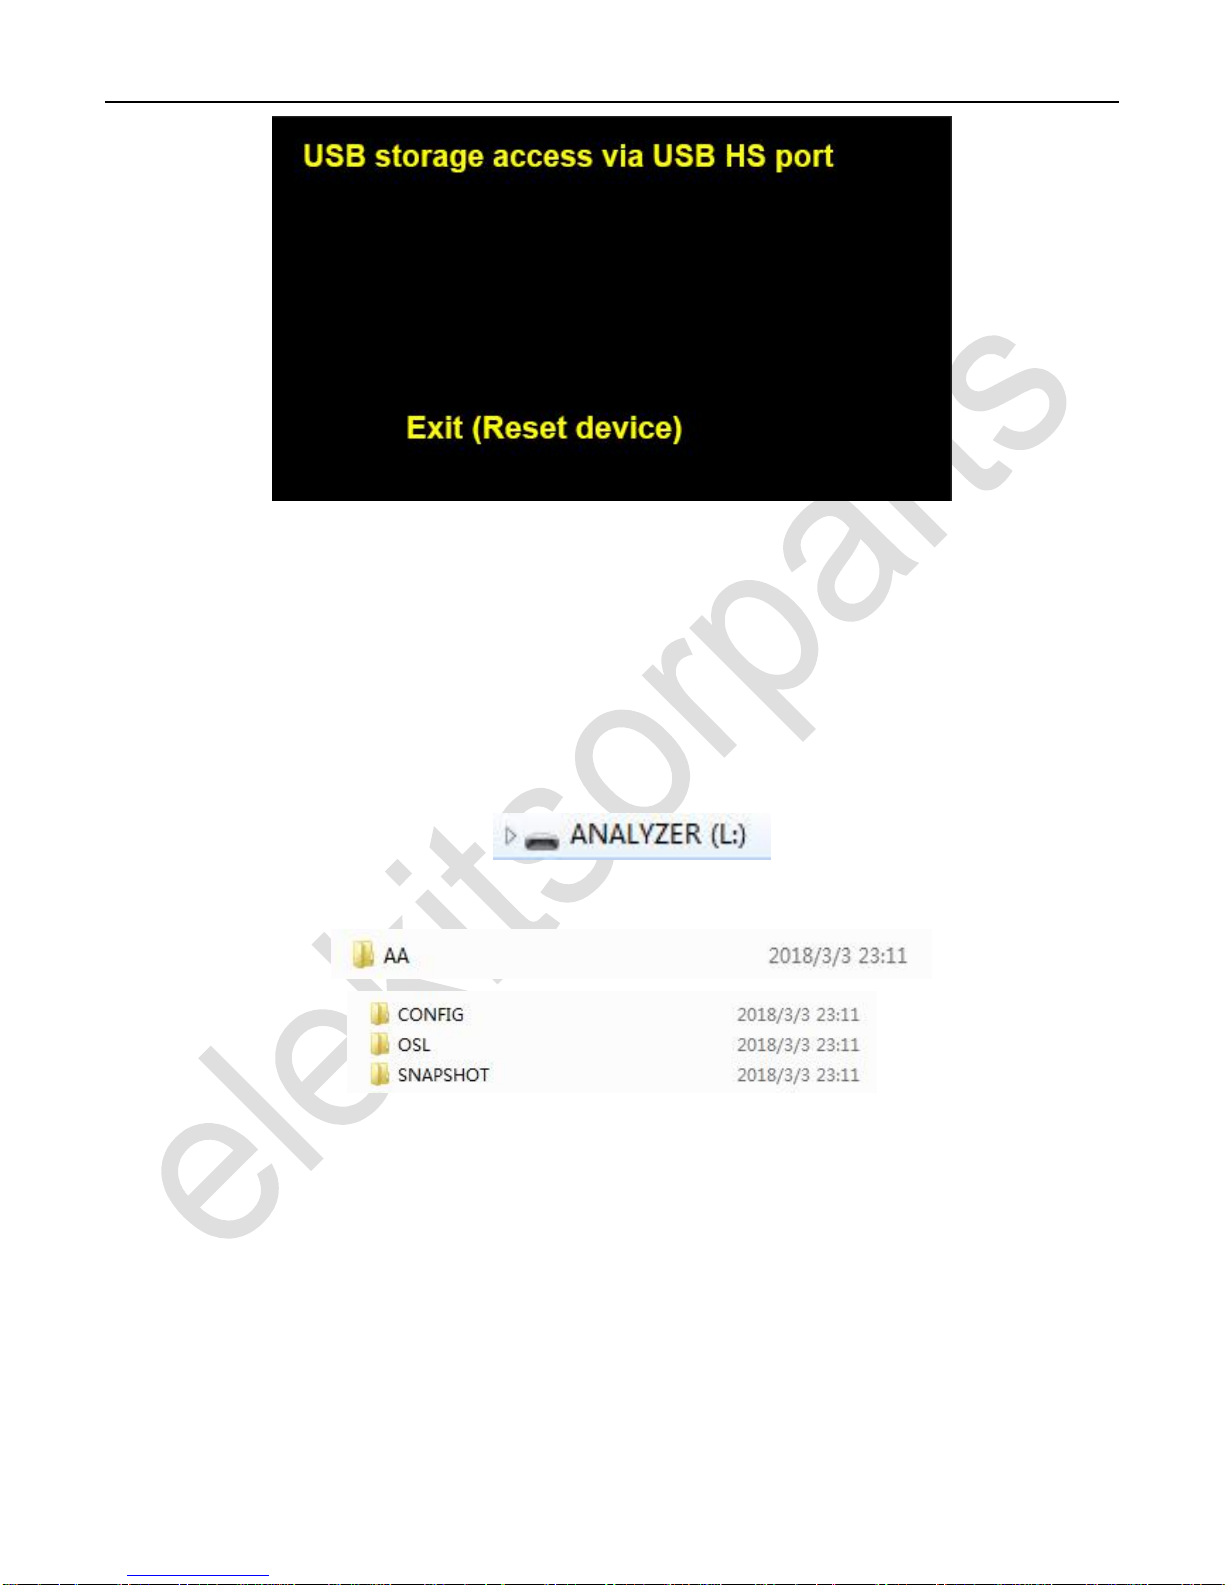
On the main screen, touching ‘USB Hs cardrdr’ will enter the usb storage access mode. In this mode, the internal TF card will
be emulated to a USB flash disk and listed in your windows explorer. You can access the configuration files, screen shot
pictures and calibration files via USB HS port from your PC. There is no need to unplug the TF card from the analyzer and read
the card via a USB card reader.
Elekitsorparts Store Item Name: FAA-450_EU1KY_Antenna Analyzer Item No.: H10010 Document Type: Manual
15
Picture 25: USB HS cardrdr
Please following the instructions below to access the files on the TF card:
a. Turn on FAA-450 and make sure it is on the main screen.
b. Connect FAA-450 to your PC via USB-HS port by the supplied micro-USB cable
c. Tap ‘USB HS cardrdr’ to get into the USB storage access mode.
d. When it is in USB storage access mode, wait about 30s until your PC finds a new hardware. The driver will be installed,
and a new disk will be added in your disk list in the windows explorer. See the picture below:
e. When finished, eject this new disk just as the normal flash disk does in your PC. Or tap ‘Exit(Reset device)’ on FAA-450,
this will eject the emulated disk automatically and reboot the analyzer.
Picture 26: A new disk is found and labeled ANALYZER
Picture 27: The AA folder contains all of the sub-folders and files used by FAA-450
The analyzer’s configuration file is saved in the CONFIG folder as CONFIG.BIN. The OSL calibration files are saved in OSL
folder named as A.OSL or B.OSL and ERRCORR.OSL. The screen shot pictures are contained in SNAPSHOT folder as PNG
format, also the logged plot file in S1P format.
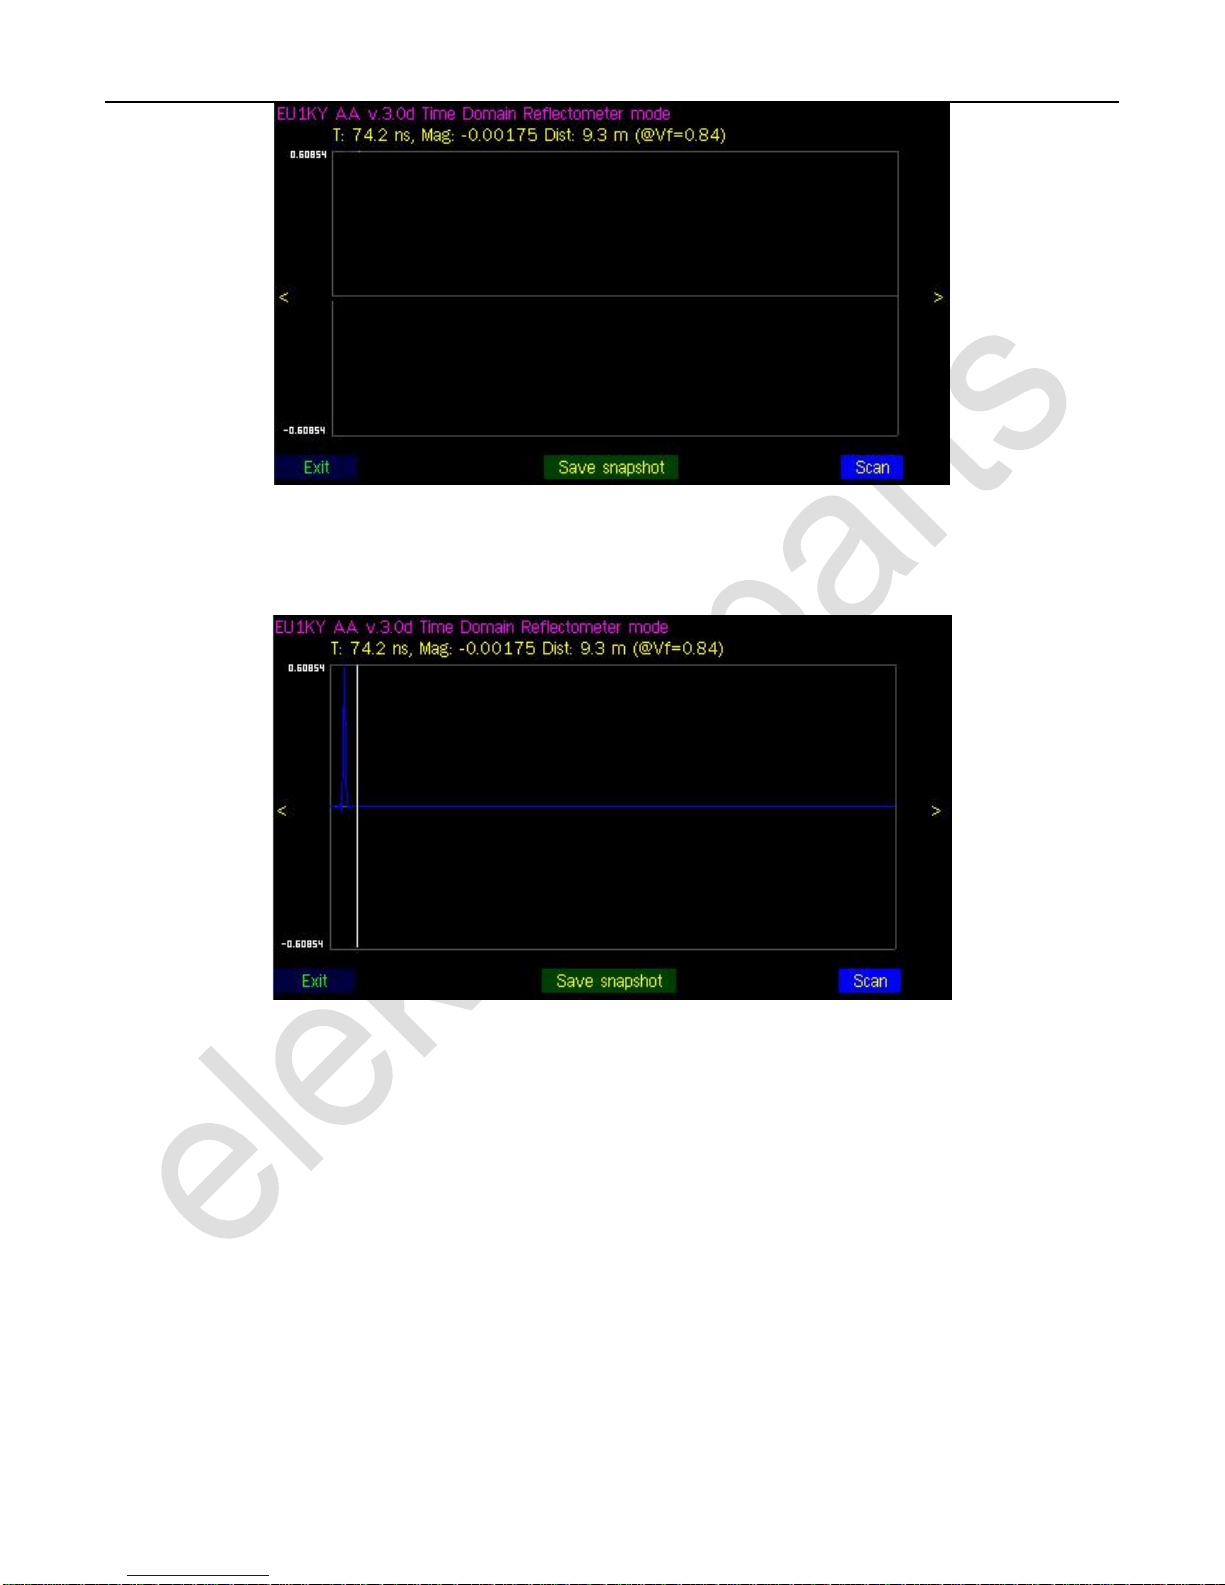
7.14 Time Domain
Time Domain mode detects the reflected RF signal in the coax and measures the distance from the coax feed point to the
reflection point. It is useful as you can determine the broken point of your cable, or the length of your coax if there is no broken
point. Please keep in mind that all of the measurement results are based on the preset TDR Velocity Factor (0.66 by default),
and you can access TDR setting from the configuration sub-menu.
To get into the TDR mode, tap ‘Time Domain’ on the main screen, then it shows:
Elekitsorparts Store Item Name: FAA-450_EU1KY_Antenna Analyzer Item No.: H10010 Document Type: Manual
16
Picture 28: Time Domain mode
Connect a coax cable, and tap ‘Scan’ to begin scanning. The unit will begin to scan and it will stop scan in about 10s. The
picture below is a example scanning of a 5 meter foam coax of which velocity factor is 0.84.
Picture 29: Information given in Time Domain mode
Tap the Left or Right arrow on the screen to make the maker line on the peak position of the plot. We will get the measured
values of the marked position as: T:39.1 ns, Mag: 0.60782 Dist: 4.9m (@Vf = 0.84) , where T is the time, in Nano Second, Mag
is the Magnitude Ratio, Dist is the distance in Meter. So, the Time Domain mode could be used to measure a unknown length
cable, but its velocity factor should be known first.
Elekitsorparts Store Item Name: FAA-450_EU1KY_Antenna Analyzer Item No.: H10010 Document Type: Manual
17
Picture 30: Moving the maker to the peak to find the distance
7.2 Configurations and Calibrations
A calibration process is needed for each initially built FAA-450, including the HW Calibration and the OSL Calibration. They
could be accessed from the main screen.
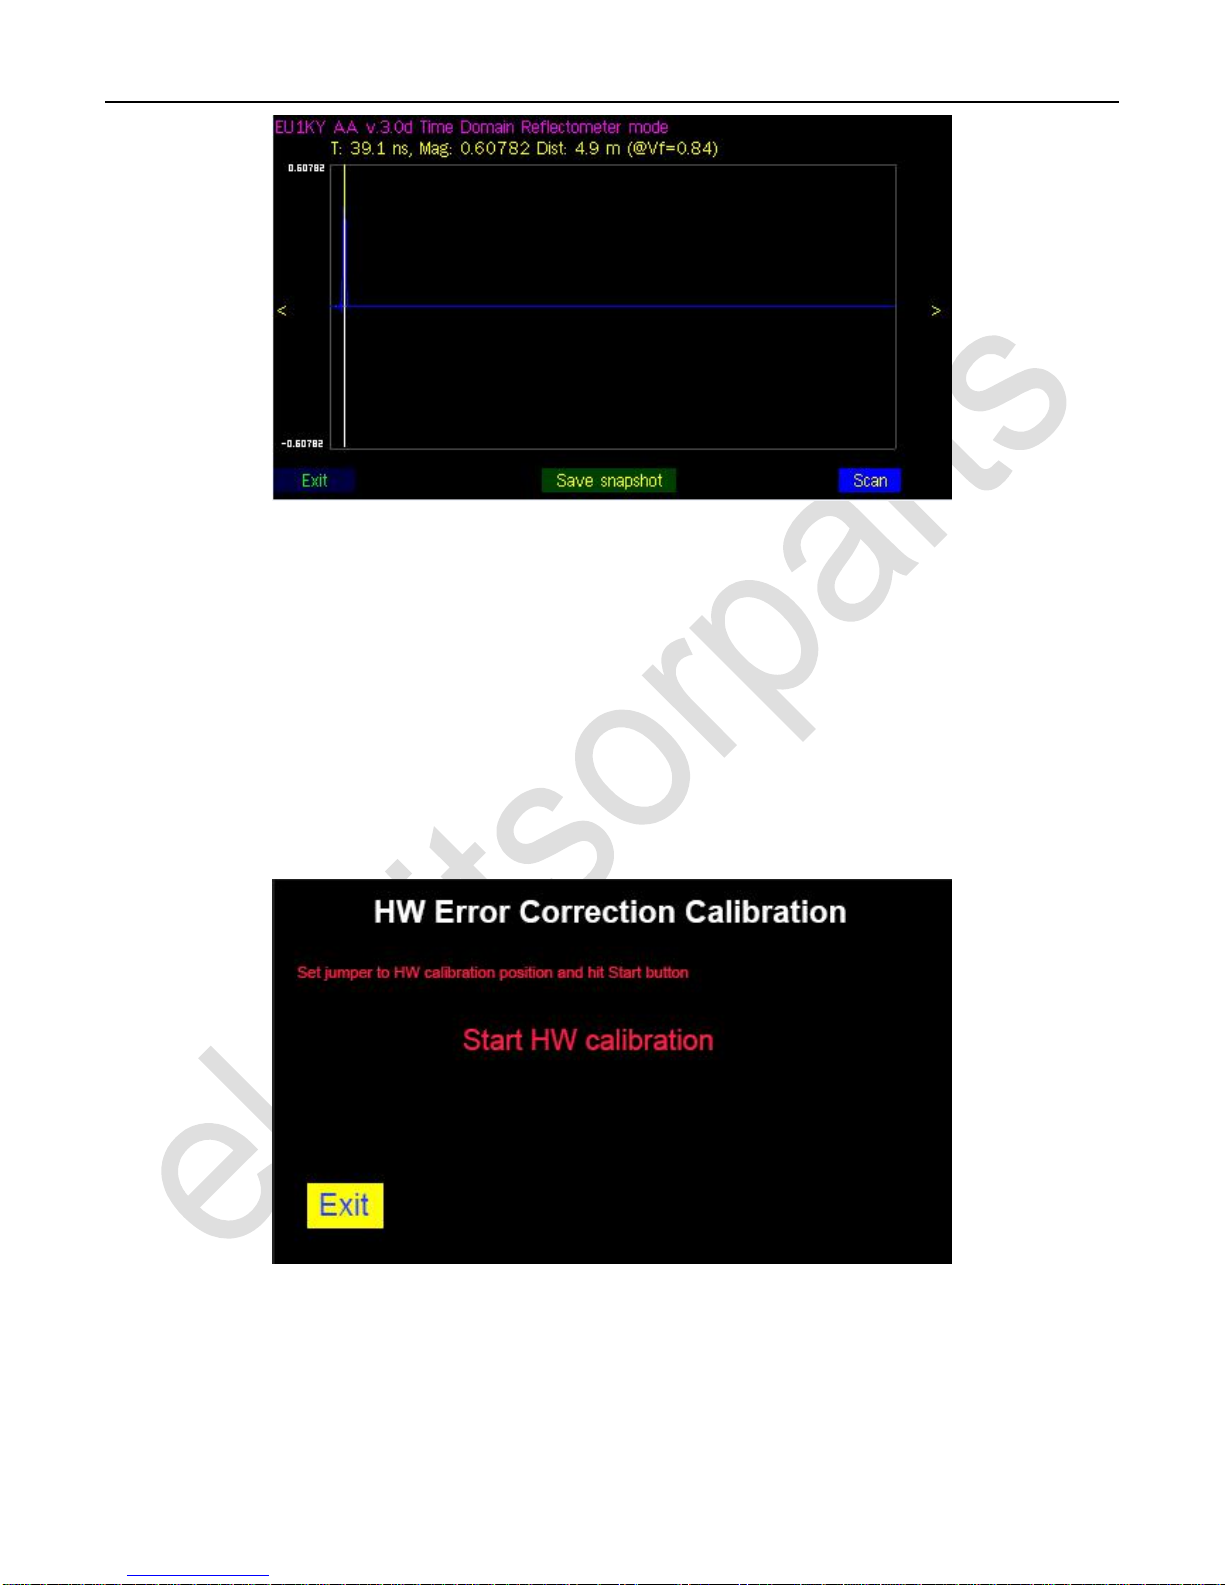
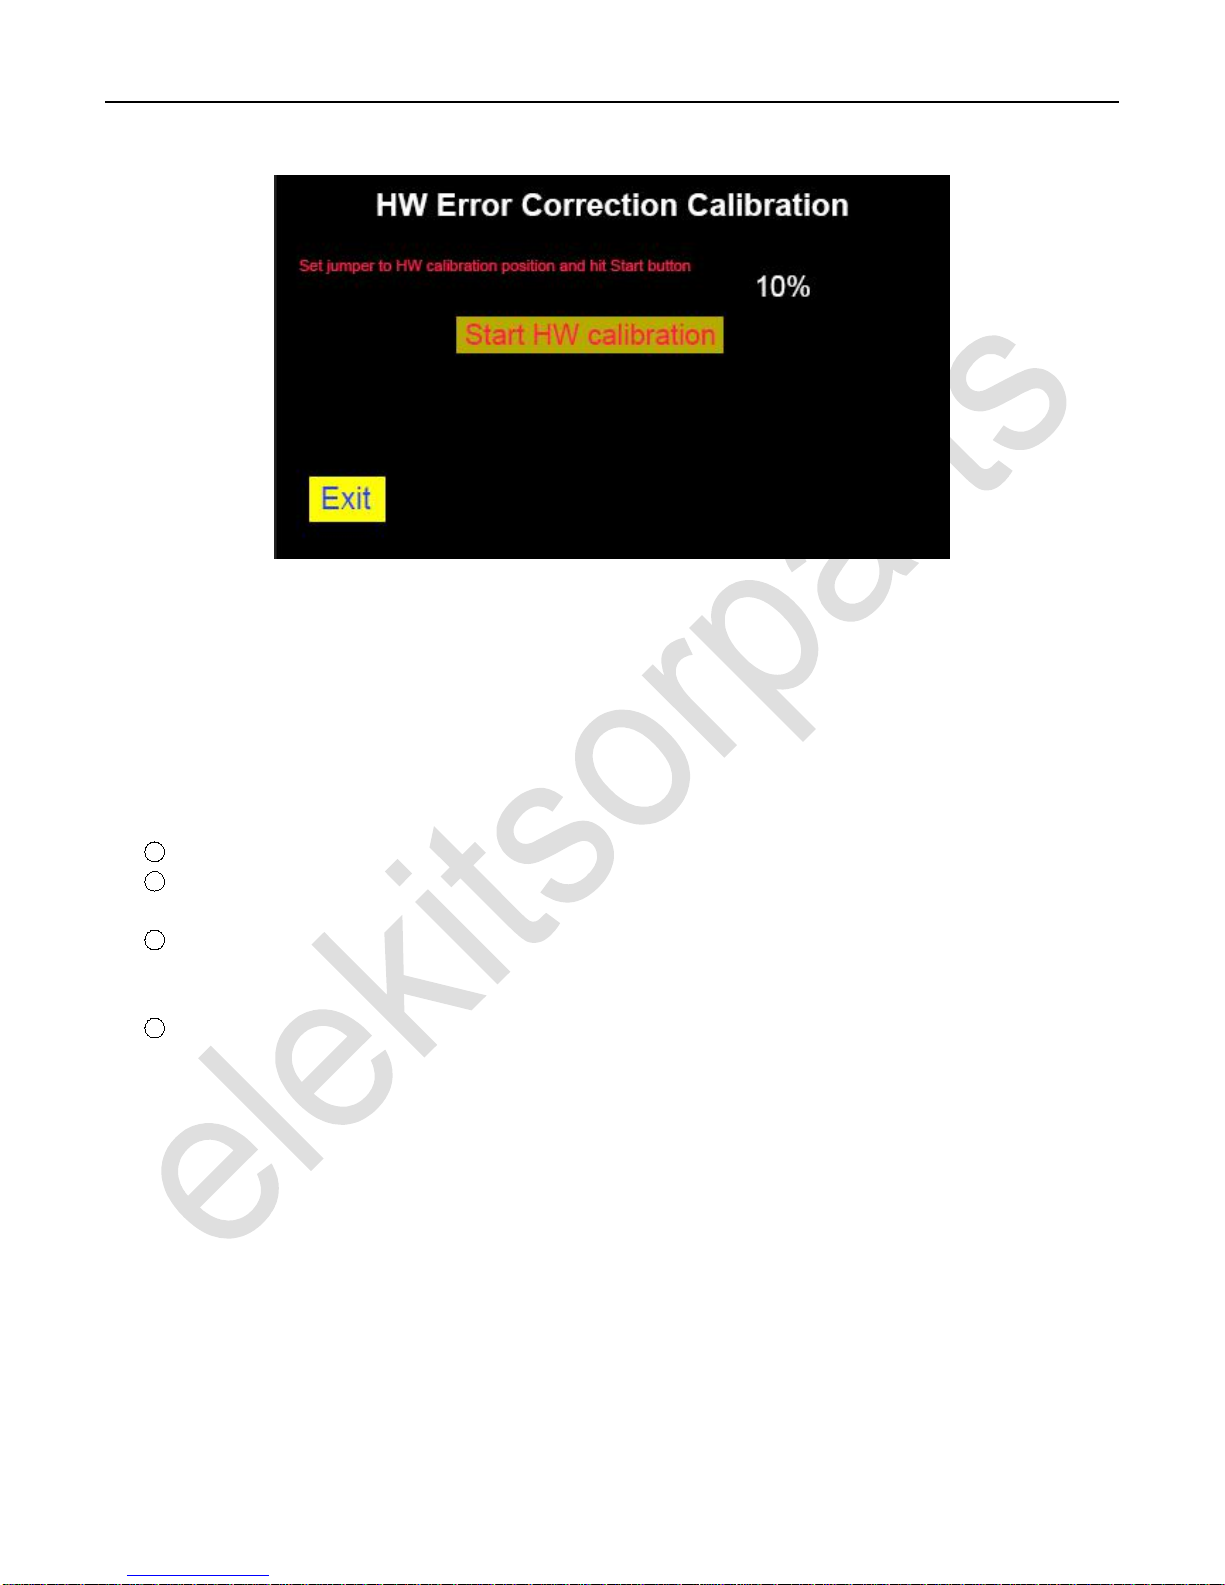
7.21 HW Calibration
For HW Calibration, the jumper on the RF board should be set to ‘HWCal’ position. The HW Calibration is used when the
unit is initially assembled and for testing the RF front end only.
To access the HW Calibration, tap ‘HW Calibration’ sub-menu on the main screen, and the unit gets into the HW calibration
screen, as it shows on picture 31.
Picture 31: HW Calibration sub-menu
Make sure the jumper on RF board is right on ‘HWCal’ position, and if everything is OK, tap ‘Start HW calibration’, then the
unit begins the HW calibration process, it will take a short while, according to the frequency range and other settings in the
configuration menu. The background of button ‘Start HW calibration’ changes to dark yellow while it is in calibration process,
and there is also a number showed in percentage on the right upper place of the button to indicate the progress. Never turn off
Elekitsorparts Store Item Name: FAA-450_EU1KY_Antenna Analyzer Item No.: H10010 Document Type: Manual
18
the unit at time. It will finish the HW calibration process and stores the calibrated file in TF card when it is in 100%. Tap ‘Exit’
to exit the HW calibration mode.
Picture 32: HW Calibration in progress
7.22 OSL Calibration
For OSL Calibration, the jumper on the RF board should be set to ‘Work’ position. The calibrated data is stored on the SD
card for the future measurement correction and these values will be used in the real work.
To access the OSL calibration, tap ‘OSL Calibration’ sub-menu on the main screen, and the unit gets into the OSL Calibration
screen, as it shows on picture 31.
Please check the following things before doing a OSL Calibration:
1Jumper on RF board is on ‘Work’ position.
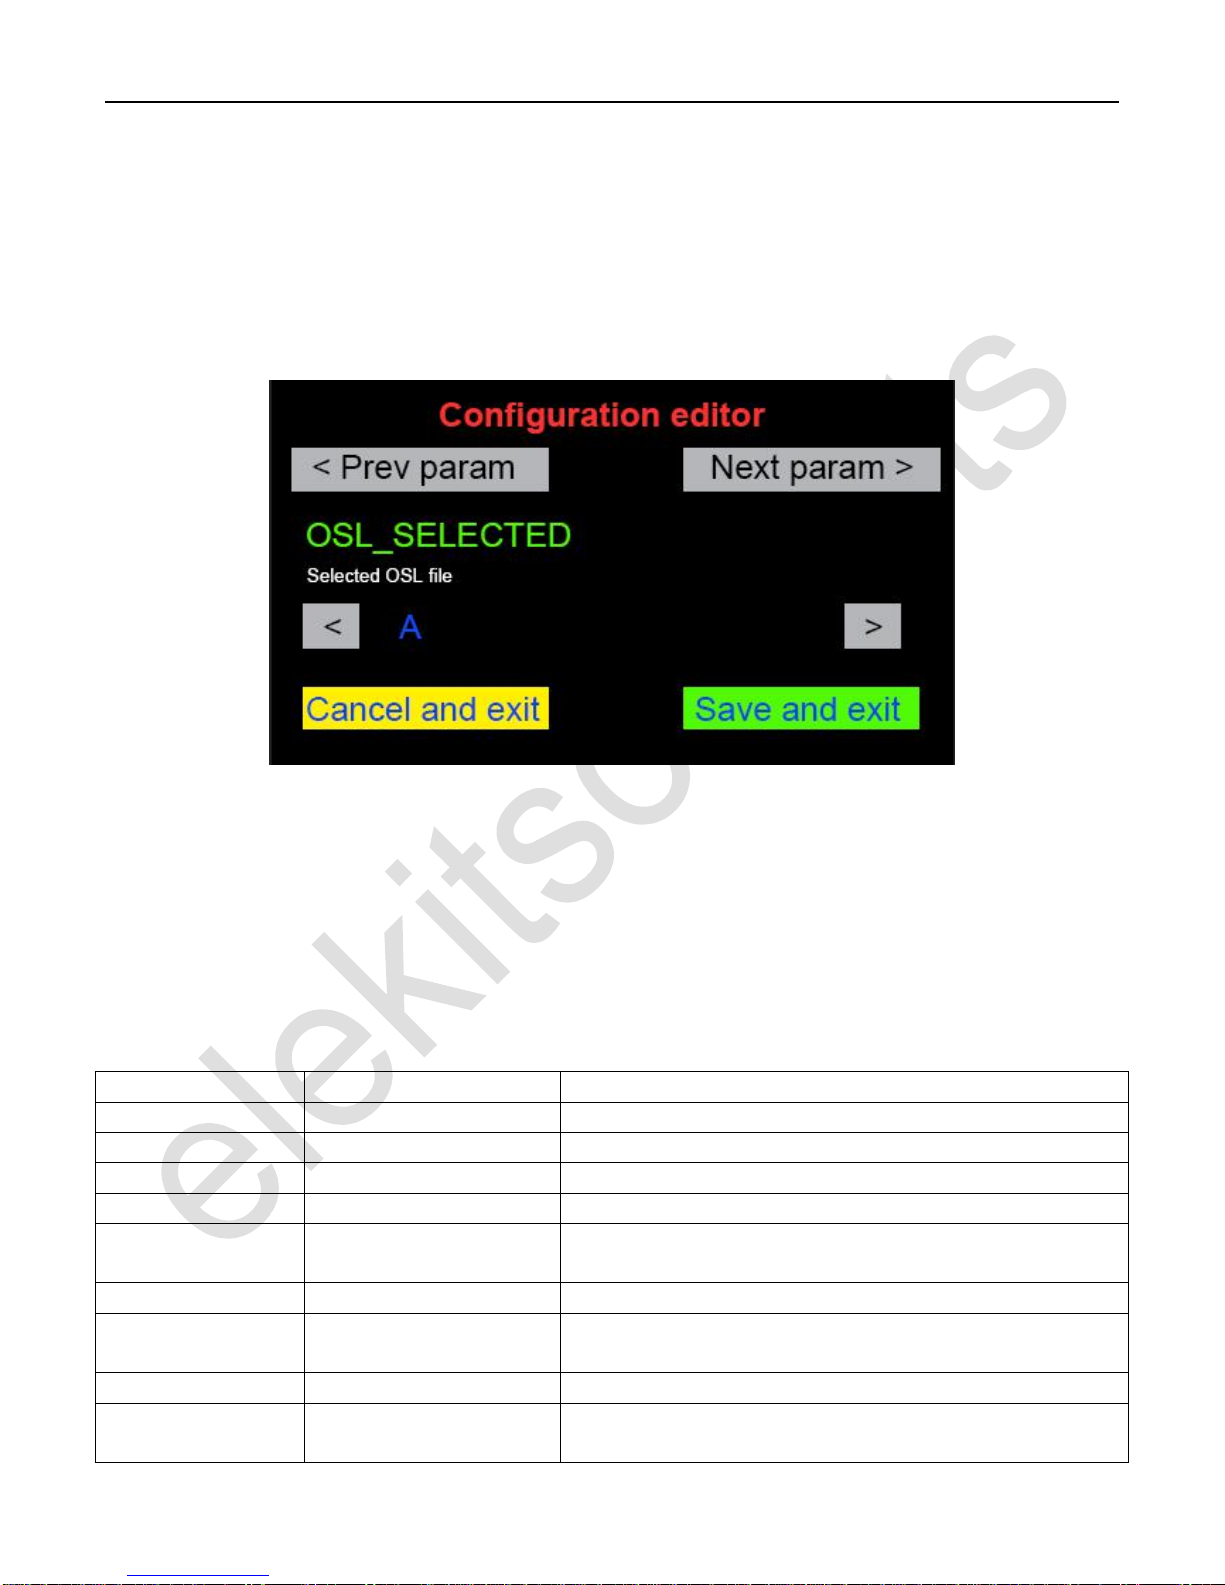
2Set the ‘OSL_SELECTED’ parameter to file A, B or C in Configuration sub-menu, otherwise you can not enter into
the OSL Calibration sub-menu.
3Also in Configuration sub-menu, set the correct values to OSL_RLOAD, OSL_RSHORT, OSL_ROPEN. For the
calibration set from elekitsorparts store, set OSL_RLOAD = 50, OSL_RSHORT = 0, OSL_ROPEN = Open. These
values are truly important, please check them before the further operation.
4Prepare the 3 loads, Short, 50 Ohm and Open.
If everything is fine, connect the 0 Ohm load to the antenna port first of all, and tap the ‘Scan short: 0 Ohm’ button on the
screen, then it begins the 0 Ohm load calibration process. The background of the button will be changed to ‘dark yellow’, and
there also a number showed in percentage on the right of the button. The process may take some times as the unit scans the
frequency in 100KHz steps in the whole operational frequency range. When the 0 Ohm calibration is done, a green background
is replaced on the button. Now, disconnect the 0 Ohm load and connect the 50 Ohm load to the antenna port, tap the button
‘Scan load: 50 Ohm’ to start the second step of OSL calibration. And, so on for the final open load.
When all of them are done, tap ‘Save and exit’ to store the calibrated data on TF card and exit OSL calibration mode.

Elekitsorparts Store Item Name: FAA-450_EU1KY_Antenna Analyzer Item No.: H10010 Document Type: Manual
19
Picture 33: OSL Calibration
Picture 34: Scanning 0 Ohm load is in progress
Picture 35: All of the steps are done
Elekitsorparts Store Item Name: FAA-450_EU1KY_Antenna Analyzer Item No.: H10010 Document Type: Manual
20
7.23 Configuration
All of the physical and operational parameters of this analyzer are configured through Configuration sub-menu. The parameters
configured here will be stored in the TF card as file AA/CONFIG/CONFIG.BIN. Please keep in mind that some of the
configurations in this sub-menu is truly important, make sure you know what to do here before changing any of the parameters.
To access the Configuration sub-menu, tap ‘Configuration’ on the main screen, then the unit gets into ‘Configuration editor’, as
showed in picture 36.
.
Picture 36: Configuration editor
The configurable parameters and their default values are listed in the table below, but please note that there may be new
parameters added in Configuration editor in the future. All of the parameters marked in red color are truly important, make sure
you know what to do before change it, otherwise the analyzer may not work correctly.
To make the analyzer work at UHF frequency, you need to set the parameter SHOW_HIDDEN to 1 in order to open up all of
the hidden parameters first of all. Next, set BAND_FMAX to 450MHz. Also keep in mind that a new OSL calibration and a
hardware calibration process are required after you change the max workable frequency of this analyzer.
Name
Default Value
Description
VERSION
PAN_F1
14000
Panoramic window initial frequency, kHz
PAN_SPAN
2
Span for panoramic window (0..9)
MEAS_F
14000000
Measurement window frequency, Hz
SYNTH_TYPE
0
Frequency synthesizer type. 0 for Si5351, do not change: other
values are reserved for future use.
SI5351_XTAL_FREQ
27000000
Si5351a’s nominal crystal frequency, Hz
SI5351_BUS_BASE_
ADDR
00H
Si5351a address on I2C bus. Can be changed to any even number in
the range 02h..FEH
SI5351_CORR
0
Si5351a’s crystal frequency offset from nominal frequency, Hz
OSL_SELECTED
FFFFFFFFH
Selected OSL file index (0..15 for files A .. P, other values - no OSL
file selected)
Table of contents


