GB
GB
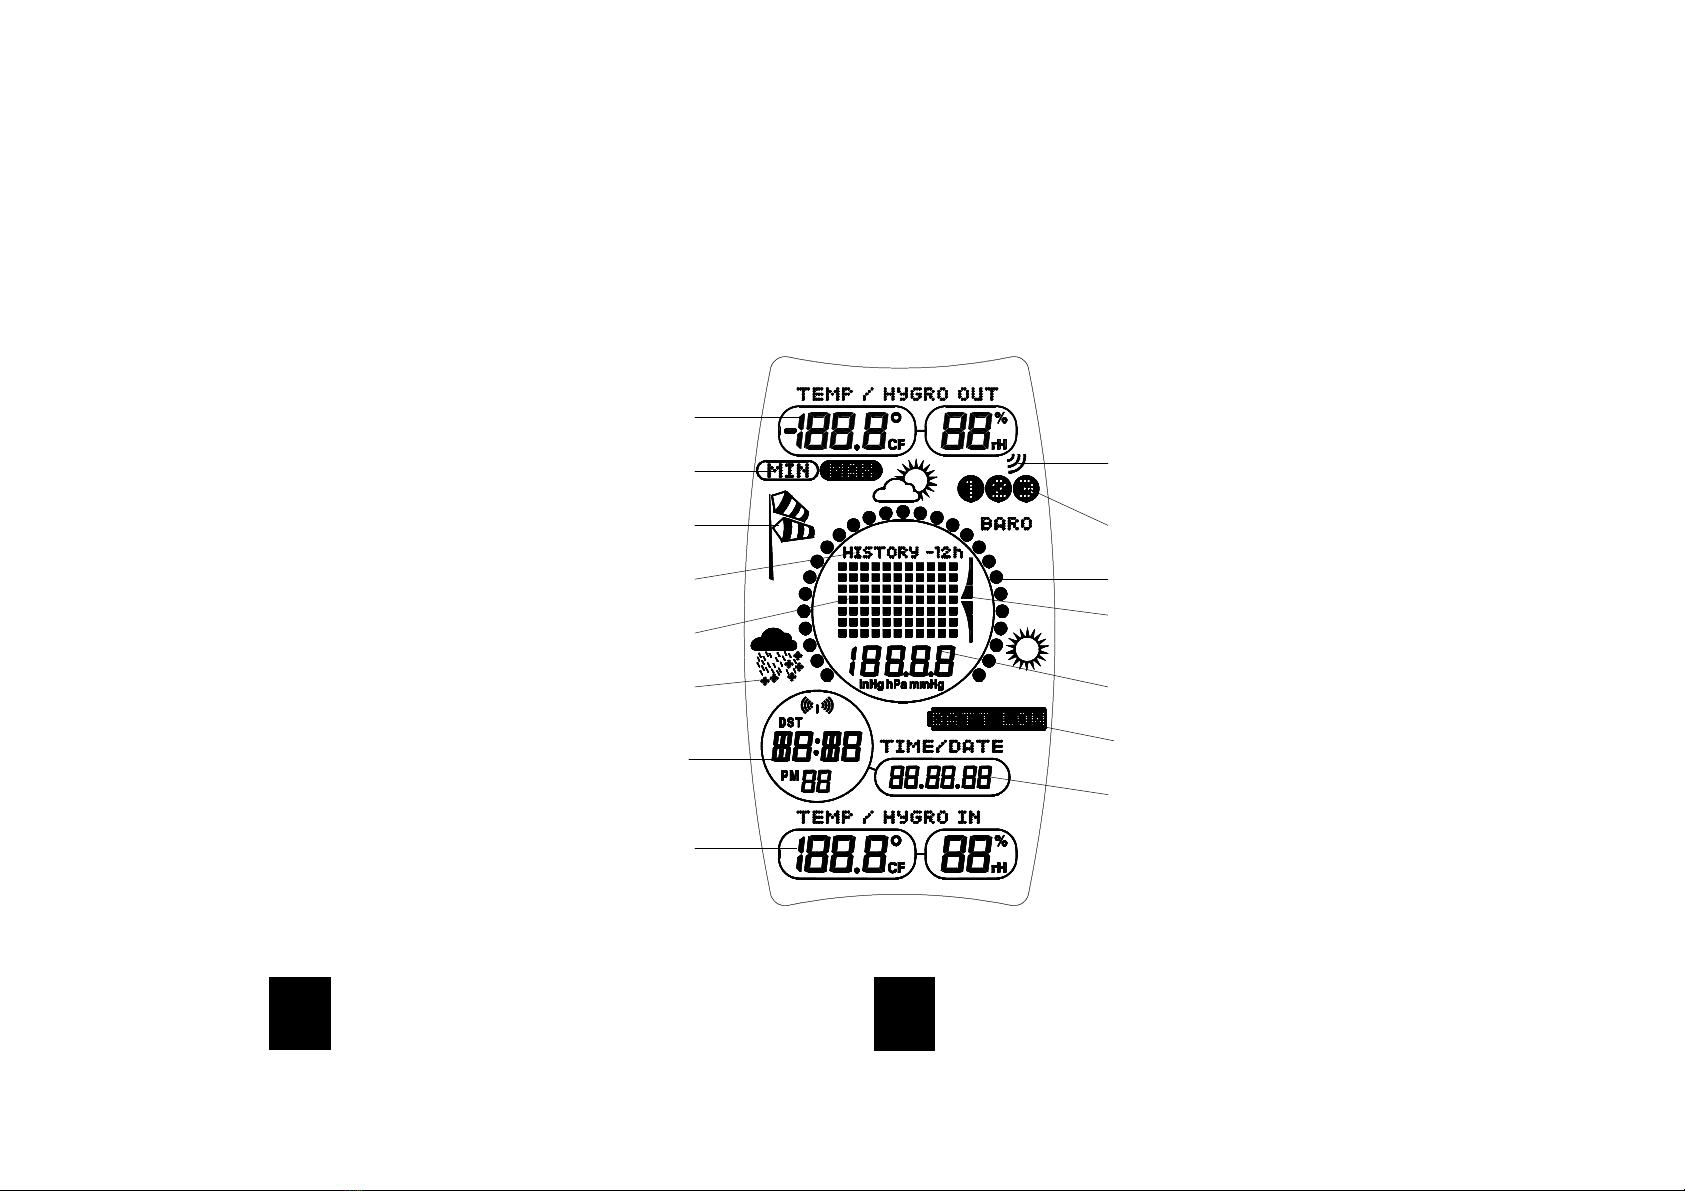
1. The ‘TEMP/HYGRO OUT’ section will display the outdoor
temperature and outdoor humidity of any one of up three thermo-
hygro sensors. Use the channel key to toggle between sensors 1, 2
and 3 (sensors are optional from your dealer).
2. MIN/MAX function, with each press of the min/max key the LCD will
toggle through:
•Maximum outdoor temperature
•Minimum outdoor temperature
•Maximum outdoor humidity
•Minimum outdoor humidity
•Maximum indoor temperature
•Minimum indoor temperature
•Maximum indoor humidity
•Minimum indoor humidity
When each respective maximum and minimum record is displayed,
the times and dates at which the records were received will be
flashing. The LCD will automatically return to the normal operation
mode after 15 seconds.
3. The high frequency transmission icon will appear each time the
sensor is transmitting out new data to the weather station
4. Channel’s 1, 2 and 3 icons represent the respective sensor being
displayed on the LCD at that moment in time. Only data from one
channel can be displayed at any one moment in time. Use the
channel key to toggle between each of the sensors.
5. The storm-warning indicator (windsock icon) works in two steps and
appears when there is an expected storm or poor weather. The first
step is for moderate wind where air pressure falling by more than
4hPa or if the air pressure falls below 995hPa within a 6-hour period,
the windsock is displayed slightly raised from the mast. The second
step indicates strong winds and possible stormy weather where the
windsock is raised horizontally from the mast. The stronger signal
appears when the air pressure falls by more than 5hPa within a 4-
hour period or if the air pressure falls to below 990hPa. The
moderate storm-warning indicator will stop when the air pressure has
risen by 1 hPa or if the air pressure rises to more than 995hPa. The
stronger storm-warning indicator will stop when the air pressure rises
by 1hPa or if the air pressure rises to more than 990hPa.
6. The electronic barometer has three weather icons, raining, cloudy
and sunny for weather forecasting. This feature allows this
instrument to be used as an analog barometer to easily check
periods of high air pressure (above 1013 hPa) or periods of low air
pressure (below 1013 hPa). The smaller circles surrounding the air
pressure bar graph functions as a bar and represents the air
pressure in a clockwise direction for increasing air pressure and anti-
clockwise for decreasing air pressure. Each circle (segment) is
equal to 1.5 hPa with the default air pressure setting at 1013 hPa,
the circle bar is set to the middle of the circle for cloudy icon. Until
the unit has run for at least 24 hours, weather forecasts given should
be discarded to allow the unit sufficient time for air pressure reading
at a consistent altitude to provide more accurate readings. The
higher the air pressure, the more circles will appear and the better
the weather is expected to be. The lower the air pressure, the fewer
the circles will appear meaning the weather is expected to become
worse. The weather icons are used as points of reference for the
barometer bar of circles that run around the main air pressure bar
graph. For best results and accurate readings, the unit should
operate constantly at the point of fixing. Common to weather
forecasting, absolute accuracy cannot be guaranteed but it will give
users an indication of the expected weather.
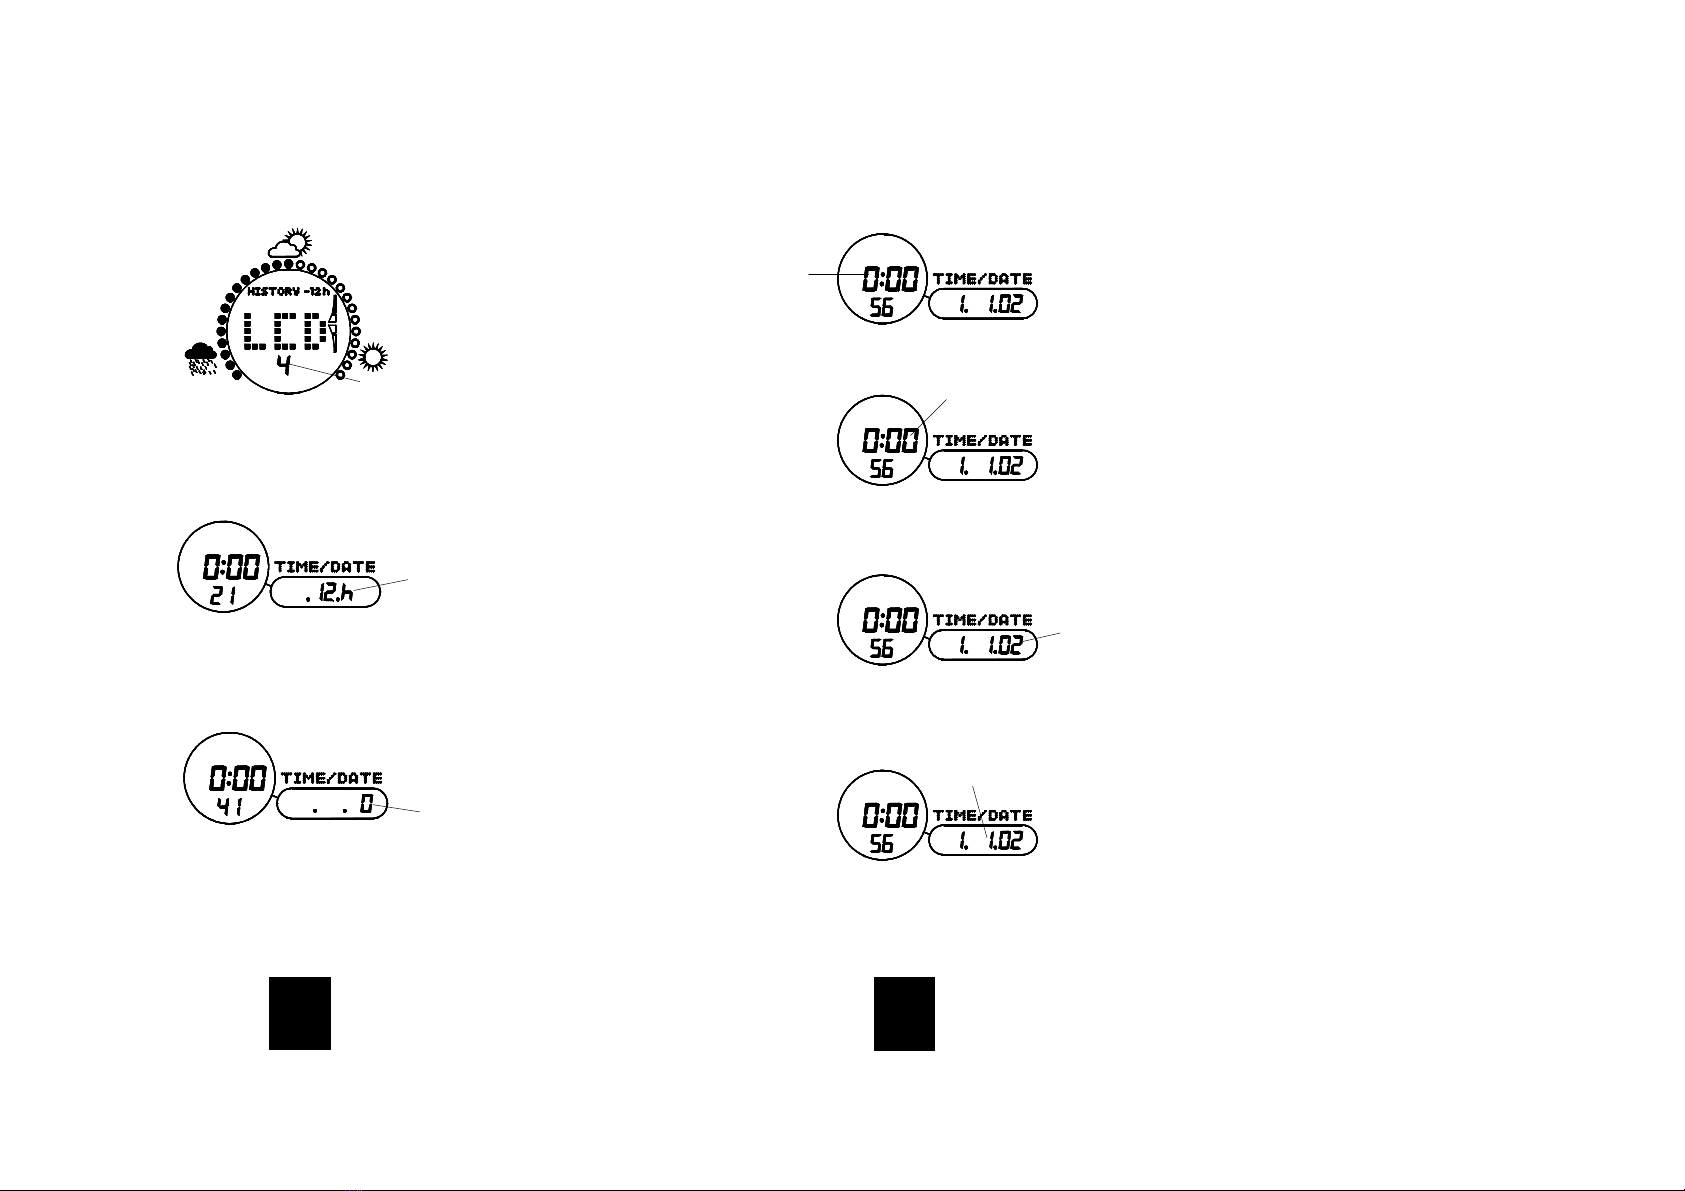
7. The unique weather history feature allows the user to select a time
interval to record up to 170 sets of weather history data. A set of
data consists of the outdoor temperature, outdoor humidity, indoor
temperature, indoor humidity, air pressure and the associated time
and date that these readings were recorded. For the outdoor data,
only history from sensor 1 will be recorded. When the history feature
is used the circle bar of the barometer for weather forecasting also
changes. To recall the data, press the history key once and then
using the ‘+’ or ‘–‘ keys to move forward or backwards or
alternatively press and hold the ‘+’ or ‘–‘ keys to scroll through the
data in fast forward and backward mode. To select the desired time
recording interval for weather history, go to the interval setting in the
‘User setting mode’.
8. The weather tendency indicator is located on the right side of the air
pressure bar graph. The indicator is split into four parts, two
indicators pointing upwards and two indicators pointing downwards.
When either one of the up or down indicators are displayed, it means
that there is a moderate change in the air pressure by more than