Figaro TGS5141-P00 Manual

Revised 11/18 1
TECHNICAL INFORMATION FOR TGS5141-P00
Technical Information for Carbon Monoxide Sensors
Figaro’s TGS5141 is a battery operable
electrochemical sensor which uses a unique
electrolyte that eliminates the need for a water
reservoir. By eliminating the water reservoir used
in TGS5042, the comparative size of TGS5141 is
reduced to just 10% of TGS5042. With its ultra
compact size, this sensor is the ideal choice for
size oriented applications such as portable CO
detectors, small residential CO detectors, and
multi-sensor fire detectors. OEM customers
will nd individual sensor data printed on each
sensor in bar code form, enabling users to skip
the costly gas calibration process and allowing
for individual sensor tracking.
Specifications Page
Features..................................................................................................2
Applications...............................................................................................2
Structure...........................................................................................2
Basic Measuring Circuit...........................................................................2
Operating Conditions & Specications...................................................3
Dimensions...................................................................................................3
Operation Principle......................................................................................................4
Basic Sensitivity Characteristics
Sensitivity to Various Gases............................................................5
Temperature and Humidity Dependency.............................................5
Gas Response Pattern.................................................................................6
Repeatability.............................................................................6
Inuence of Storage...................................................................................6
Normal Operation Test.....................................................................................7
Sensitivity Test...................................................................................7
Reliability
InterferenceGasTest......................................................................................8
Long-Term Stability................................................................................9
Corrosion Test...........................................................................................9
Variable Ambient Temperature Test................................................................9
Humidity Test.............................................................................................10
Stability Tests..................................................................................................11
Dust Test................................................................................................12
Marking..........................................................................................................................12
Cautions.......................................................................................................13
Appendix - Lead conguration............................................................................14
an ISO9001 company
IMPORTANT NOTE: OPERATING CONDITIONS IN WHICH FIGARO SENSORS ARE USED WILL VARY
WITH EACH CUSTOMER’S SPECIFIC APPLICATIONS. FIGARO STRONGLY RECOMMENDS CONSULT-
ING OUR TECHNICAL STAFF BEFORE DEPLOYING FIGARO SENSORS IN YOUR APPLICATION AND,
IN PARTICULAR, WHEN CUSTOMER’S TARGET GASES ARE NOT LISTED HEREIN. FIGARO CANNOT
ASSUME ANY RESPONSIBILITY FOR ANY USE OF ITS SENSORS IN A PRODUCT OR APPLICATION FOR
WHICH SENSOR HAS NOT BEEN SPECIFICALLY TESTED BY FIGARO.
TGS5141 is a UL recognized component in accordance with the
requirements of UL2034. Please note that component recognition
testing has conrmed long term stability in 15ppm of carbon monoxide;
other characteristics shown in this brochure have not been conrmed by
UL as part of component recognition.

Revised 11/18 2
TECHNICAL INFORMATION FOR TGS5141-P00
1. Specications
1-1 Features
* Ultra compact size
* Battery operable
* High repeatability/selectivity to carbon monoxide
* Linear relationship between CO gas concentration
and sensor output
* Simple calibration
* Long life
* UL recognized component
* Meets UL2034, EN50291, and EN54-31 requirements
1-2 Applications
* Residential and commercial CO detectors
* Fire detection
1-3 Structure
Figure 1 shows the structure of TGS5141. The gas sensing
layer is sandwiched between a stainless steel washer
(counter electrode) and a stainless steel cap (working
electrode), together with gas diffusion control stainless
lm and backing layers. This assembly is placed in the
compartment of the stainless steel can. A charcoal lter is
installed inside the stainless steel cap.
1-4 Basic measuring circuit
Figure 2 shows the basic measuring circuit of TGS5141.
The sensor generates a minute electric current which is
converted into sensor output voltage (Vout) by an op-amp/
resistor (R1) combination.
Figaro recommends the following electrical parts:
R1 : 1MΩ
C1 : 1µF
IC : AD708
An additional resistor or FET is required to prevent
polarization of the sensor when circuit voltage is off.
NOTE:When voltage is applied to the sensor output
terminal, the sensor may be damaged. Voltage applied to
the sensor should be strictly limited to less than ±10mV.
1-5 Operating conditions & specications (Table 1)
Figure 1 - Sensor structure
Figure 2 - Basic measuring circuit
(Including equivalent circuit)
Gasket
Washer
Can / Counter
electrode terminal
Cap / Working electrode terminal
Gas inlet
Gas inlet
Active charcoal filter
Gas sensing layer
Gas diffusion control film
TGS5141
Working
Counter
-
+
R1
C1
Vout
1MΩ
1µF
IC
NOTE 1: Represents sensor output in air under operating conditions
Table 1 - Operating conditions and specications
Item Specication
Model number TGS5141-P00
Target gases Carbon monoxide
Typical detection range 0 ~ 5,000ppm
Output current in CO 1.2~3.2nA/ppm
Baseline offset(*1) <±10ppm equivalent
Operating temperature -10˚C ~ +50˚C (continuous)
-20˚C ~ +60˚C (intermittent)
Operating humidity 10 ~ 95%RH (no condensation)
Response time (T90) within 60 seconds
Storage conditions -10˚C ~ +50˚C (continuous)
-20˚C ~ +60˚C (intermittent)
Weight approx. 2.5g
Standard test conditions 20±2˚C, 40±10%RH

Revised 11/18 3
TECHNICAL INFORMATION FOR TGS5141-P00
1-6 Dimensions (see Fig. 3)
Figure 3 - Dimensions
All sensor characteristics shown in this brochure
represent typicalcharacteristics. Actualcharacteristics
vary from sensor to sensor and from production lot
to production lot. The only characteristics warranted
are those shown in the Specication.
5.0±0.4
Top view
Gas inlet
Side view
Bottom view
Working electrode
8.5±0.2
unit: mm
13.9±0.4 Counter electrode

Revised 11/18 4
TECHNICAL INFORMATION FOR TGS5141-P00
2. Operation Principle
The operation principle of TGS5141 is basically
identical to that of a fuel cell. When CO passes
through the gas permeable diffusion membrane
and reaches the working electrode, protons and
electrons are generated as part of a CO oxidization
reaction (see equation 1). By creating a short circuit
between the working and counter electrodes with
external wiring, electrons and protons on the
working electrode move to the counter electrode
through the external wiring and through the proton
conductor respectively. The proton then reacts
with oxygen on the counter electrode as shown in
equation 2. The total reaction is expressed as shown
in equation 3.
A linear relationship exists between the sensor's
electric current and CO concentration (see equation
4). By calibrating the sensor with a known
concentration of CO gas, the output current of the
sensor can then be used to quantitatively determine
CO concentration.
Since, unlike conventional dry batteries, there is no
consumption of active materials or of the electrodes,
TGS5141 possesses excellent long-term stability
for its output signal and enables maintenance-free
operation. Furthermore, the sensor's self-generating
output current makes it ideal for usage in battery-
operated CO detectors.
Figure 4 - Operation principle
Figure 5 - Schematic diagram of TGS5141
operating principle
Air
Gas
H+
e-
A
Working electrode
Counter electrode
Proton exchange membrane
Working electrode (Anodic reaction)
CO + H2O →CO2 + 2H+ + 2e- (equation 1)
Counter electrode (Cathodic reaction)
2H+ + 1/2 O2 + 2e- → H2O (equation 2)
Total reaction
CO + 1/2 O2→ CO2 (equation 3)
Theoretical output current value
I = F x (A/σ) x D x C x n (equation 4)
where:
F : Faraday constant
A: Surface area of diffusion lm
D: Gas diffusion co-efcient
C: Gas concentration
σ: Thickness of diffusion lm
n: Number of reaction electrons

Revised 11/18 5
TECHNICAL INFORMATION FOR TGS5141-P00
3. Basic Sensitivity Characteristics
3-1 Sensitivity to various gases
Figure 6 shows the sensor’s sensitivity to various
gases. The Y-axis shows output current (Iout/µA) in
each gas. The output current is linear to CO concen-
tration, with a deviation of less than ±5% in the range
of 0~500ppm. Cross sensitivity data for other gases
than those in Figure 6 are tabulated in Table Y.
3-2 Temperature and humidity dependency
Figure 7a shows the temperature dependency of
TGS5141 under a constant humidity of 50%RH. The
Y-axis shows the ratio of output current in 400ppm
of CO at various temperatures (I) to the output
current in 400ppm of CO at 20˚C/50%RH (Io).
Temperature dependency is based on the difference
in the catalytic reaction rate on the electrodes,
and it can be simply compensated by utilizing a
thermistor. This linear relationship between I/
Io and CO concentration is constant regardless of
CO concentration range, according to the sensor's
operating principle.
Figure 7b shows the humidity dependency of
TGS5141 under constant temperatures of 20˚C and
50˚C. The Y-axis shows the ratio of output current
in 400ppm of CO at various relative humidities
(I) to the output current in 400ppm of CO at
20˚C/50%RH (Io). This data demonstrates that
humidity dependency is negligible as temperature
varies.
Figure 6 - Sensitivity to various gases
Figure 7a - Temperature dependency at 400ppm CO/50%RH
(Io=sensor output current at 20˚C)
Figure 7b - Humidity dependency at 400ppm CO
(Io=sensor output current at 50%RH)
0.0
0.5
1.0
1.5
2.0
0 20 40 60 80
100
20˚C
50˚C
I/Io
Relative Humidity (%)
Note: The gures in this table are typical values and should not be used
as a basis for cross calibration. Cross sensitivity for various gases may
not be linear and should not be scaled. All data based on a 4 minute
exposure. For some gases, lter saturation and gas breakthrough may
occur if gas is applied for a longer time period.
0.0
0.5
1.0
1.5
2.0
-10 0 10 20 30 40 50
I/Io
Temperature (˚C)
-0.5
0.0
0.5
1.0
1.5
2.0
2.5
0 200 400 600 800 1000
CO
H2
Ethanol
CH4
Iso-butane
Iout(µA)
Gas concentration (ppm)
Gas Concentration CO equivalent
Hydrogen 1000ppm 500ppm
Methane Heptane
1000ppm <30ppm
Butane IPA
Ethanol Freon R22
HMDS (Si vapor) Acetone
Toluene Cyclohexane
Trichloroethane CO2
NO2Ethylene
200ppm <30ppm
Formaldehye Ammonia
Xylene SO2
Acetic acid Ethyl acetate
Acetylene 200ppm 360ppm

Revised 11/18 6
TECHNICAL INFORMATION FOR TGS5141-P00
3-3 Gas response pattern
Figure 8 shows the gas response pattern of the
output signal when the sensor is placed into 30, 70,
150 and 400ppm of CO and then returned to normal
air. The response time to 90% of the saturated signal
level is within 60 seconds, and the recovery of the
signal back to 90% of the base level is within 120
seconds. This data demonstrates that TGS5141
possesses sufcient response speed for meeting UL
requirements for CO detectors.
3-4 Repeatability
Figure 9 shows the pattern of the output signal
when the sensor is repeatedly exposed to 400ppm
of CO at a constant interval of 240 seconds. The data
demonstrates extremely high reproducibility of the
output signal, the deviation being less than ±5%.
3-5 Inuence of storage
Figure 10 shows the initial action of the sensor's
output current signal in fresh air. For the purpose
of this test, sensors were stored for more than six
months under two separate conditions between the
working and counter electrodes: in short-circuited
condition, and in open-circuited condition. The
chart illustrates the behavior of sensor output
current for each group just after installation into
the operating circuit. The output current signal of
sensors stored in a short-circuited condition reaches
its saturated level quickly, while those stored with
an open-circuit exhibit much slower behavior.
Since sensors are shipped in an open-circuit
condition, stabilization time of one hour (typical) is
recommended after mounting on a PCB that includes
an anti-polarization circuit (see Item 2-4 in Application
Notes for TGS5xxx Series). If no antipolarization circuit
is used, it is necessary to wait for about one hour after
powering the circuit. One hour of powering is
required, regardless of when the sensor is placed into
the detector circuit.
Figure 8 - Response pattern
Figure 9 - Repeatability (in 400ppm of CO)
0.0
0.2
0.4
0.6
0.8
1.0
0 500 1000 1500 2000
Iout(µA)
Time (sec.)
CO 30ppm
CO 70ppm
CO 150ppm
CO 400ppm
-0.2
0.0
0.2
0.4
0.6
0.8
1.0
0 500 1000 1500 2000
Iout(µA)
Time (sec.)
-100
-50
0
50
100
0 10 20 30 40 50 60 70
Short
Open
Iout(nA)
Time (min.)
Figure 10 - Inuence of storage
(in fresh air)

Revised 11/18 7
TECHNICAL INFORMATION FOR TGS5141-P00
3-6 Normal operation test
Figure 11a shows the result of the “Normal Operation
Test” required by UL2034 where the sensor is exposed
to 600ppm of CO for 12 hours at 20˚C/40%RH. Stable
output current signal can be seen throughout the
exposure.
In addition, Figure 11b shows the CO sensitivity
characteristics of the sensor before, during, and
after the Normal Operation Test, demonstrating that
TGS5141 is hardly inuenced by exposure to high
concentrations of CO.
3-7 Sensitivity test
Figure 12a shows the results of the “Sensitivity Test”
as required by UL2034. Under this test, the sensor
was exposed to 30, 70, 150 and 400ppm of CO at
20˚C/40%RH. The period of exposure was varied
by concentration, corresponding with the maximum
time in which a CO detector should generate an
alarm for the subject concentration. Throughout the
test exposures, TGS5141 displayed a reasonable and
stable output current signal.
Figure 11a - Normal operation test
(CO 600±30ppm for 12 hours at 20˚C/40%RH)
0.0
0.5
1.0
1.5
0 5 10 15 20
Iout(µA)
Time (hrs.)
CO 600ppm
Figure 11b - Normal operation test
(20˚C/40%RH)
0.0
0.2
0.4
0.6
0.8
1.0
1.2
1.4
0 100 200 300 400 500 600 700
Before
During
After
Iout(µA)
CO concentration (ppm)
0
0.2
0.4
0.6
0.8
1
0 200 400 600 800 1000 1200 1400
Iout(µA)
Time (min.)
CO 30ppm
CO 70ppm
CO 150ppm
CO 400ppm
Figure 12a - Sensitivity test
(20˚C/40%RH)

Revised 11/18 8
TECHNICAL INFORMATION FOR TGS5141-P00
In addition, Figure 12b indicates the CO sensitivity
characteristics of the sensor before, during, and
after the Sensitivity Test, demonstrating the
excellent reproducibility of TGS5141's CO sensitiv-
ity characteristics.
4. Reliability
Tests conducted in this section demonstrate that TGS5141
can meet the requirements of various testing standards
without incurring adverse long term effects from such
tests.
4-1 Interference gas test
Figure 13a shows the results of testing the TGS5141
sensor for durability against various interference
gases as specied by UL2034. The test was conducted
by exposing the sensor to each gas shown in Figure
13a (starting with CO 30ppm) for two hours, then
removing the sensor to fresh air for just one hour,
and followed by inserting the sensor into the next
gas. This procedure was repeated for the full range
of gases shown in Figure 13a.
Because the sensor is exposed to each of the test
gases consecutively, to some small extent the effect
of the previous test gas may affect subsequent tests
for a short period. However, despite the short-term
effects of such gases remaining after exposure, the
sensor still shows signicantly less sensitivity to
each test gas when compared to 30ppm of CO, and
CO sensitivity remains unaffected.
In addition, Figure 13b shows the CO sensitivity
characteristics of the sensor before and after this test,
further demonstrating the excellent reproducibility
of the CO sensitivity characteristics of TGS5141,
demonstrating its durability against the interference
gases listed in the requirements of UL2034.
Fig. 12b - Sensitivity test
(20˚C/40%RH)
Figure 13a - Interference gas test
(20˚C/40%RH)
0.0
0.2
0.4
0.6
0.8
1.0
0 100 200 300 400 500
Before
During
After
Iout(µA)
CO concentration (ppm)
0
0.01
0.02
0.03
0.04
0.05
0.06
Iout(µA)
Air
CO 30ppm
Methane 500ppm
Butane 300ppm
Heptane 500ppm
Ethyl acetate 200ppm
IPA 200ppm
CO2 5000ppm
NH3 100ppm
Ethanol 200ppm
Toluene 200ppm
Trichloroethane 200ppm
Acetone 200ppm
CO 30ppm
0
0.1
0.1
0.2
0.2
0.3
0.3
0.4
0 20 40 60 80 100 120 140 160
Before
After
Iout(µA)
CO concentration (ppm)
Figure 13b - Interference gas test
(20˚C/40%RH)
Revised 11/18 9
TECHNICAL INFORMATION FOR TGS5141-P00
4-2 Long-term stability
Figure 14 shows long-term stability data for
TGS5141. Test samples were stored in natural clean
air under a short-circuit condition and measured at
various intervals as dictated by the standard test
conditions of UL2034. The Y-axis shows the ratio of
output current in 300ppm of CO at any point in time
(I) over output current in 300ppm of CO on the rst
day of the test (Io). This chart demonstrates very
stable characteristics for more than 700 days.
4-3 Corrosion test
To demonstrate the durability of TGS5141 against
corrosion, samples were subjected to test conditions
called for by UL2034-Corrosion Test. Over a three-
week period, a mixture of 100ppb of H2S, 20ppb of
Cl2, and 200ppb of NO2was supplied to the sensors
at a rate sufcient to achieve an air exchange rate
of ve times per hour. Figure 15 shows the CO
sensitivity characteristics before and after exposure
in the above conditions, demonstrating that TGS5141
is hardly inuenced by such corrosive gases. In
addition, the sensor's stainless steel housing did not
show any sign of corrosion as a result of this test.
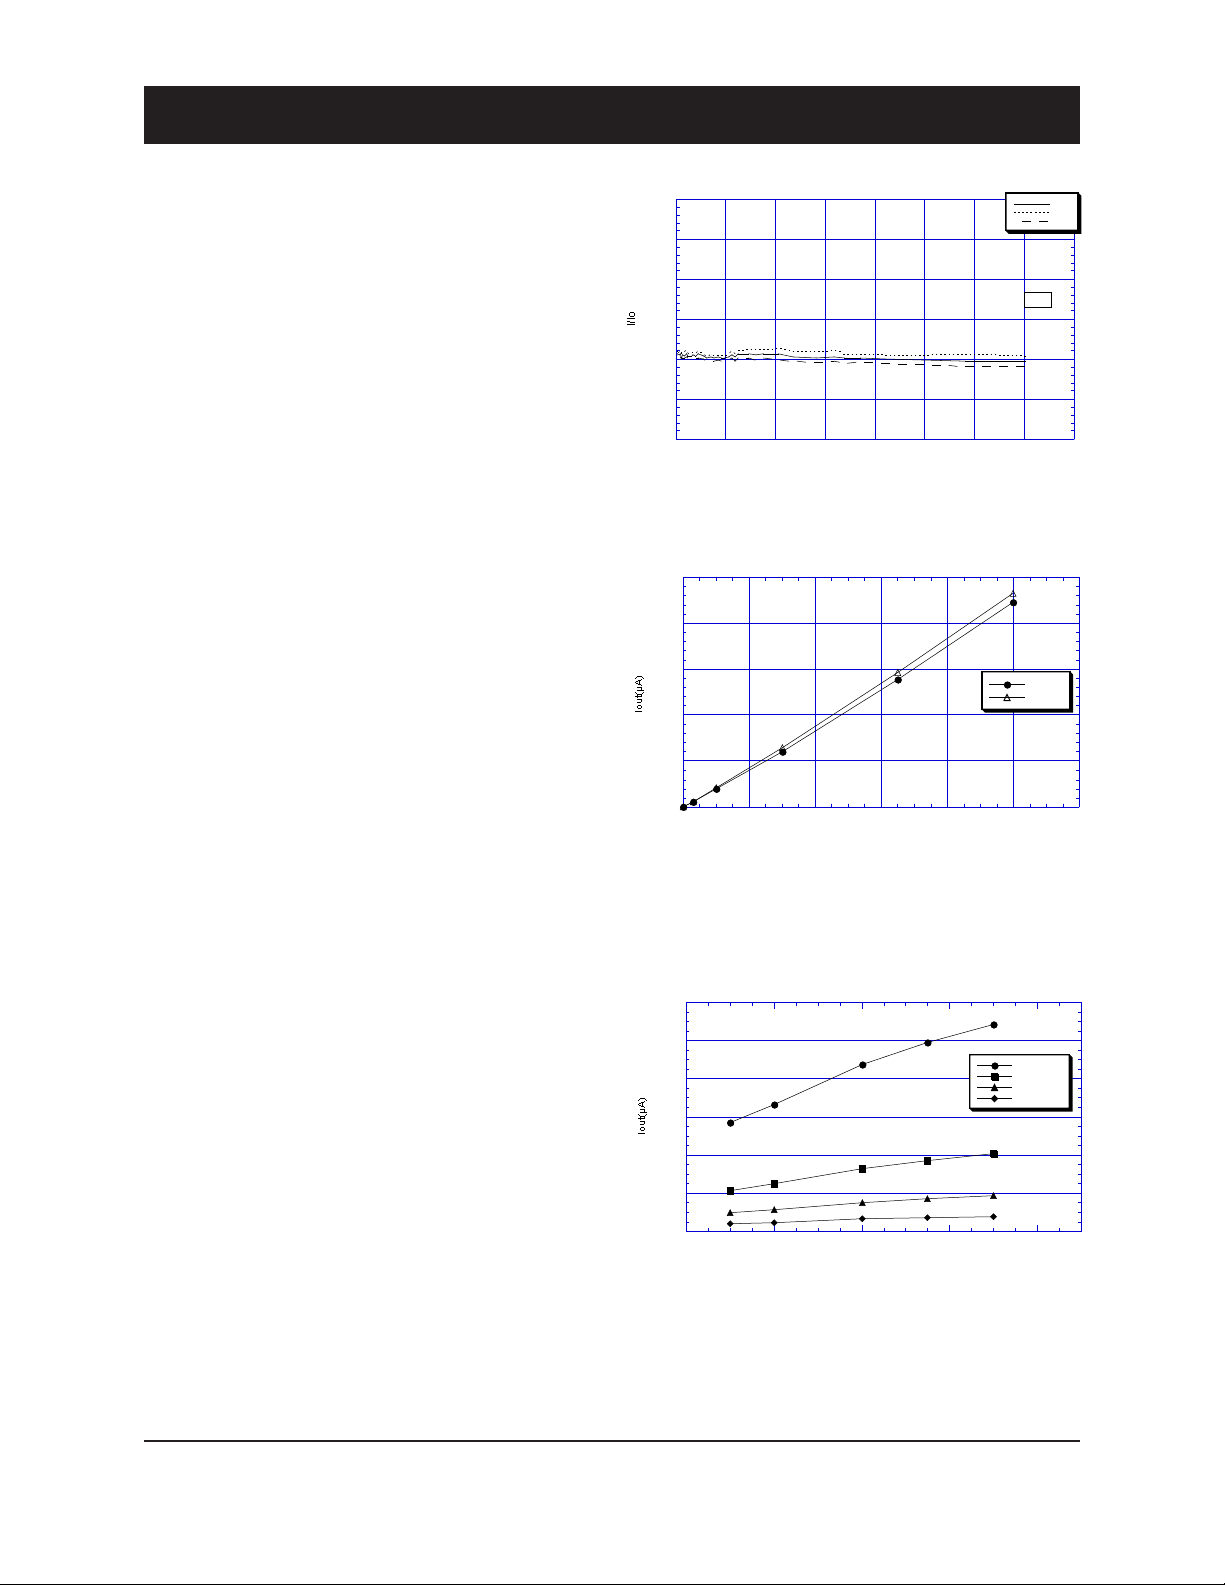
4-4 Variable ambient temperature test
To demonstrate the ability of TGS5141 to withstand
the effects of high and low temperature, the
“Variable Ambient Temperature Test” of UL2034
was conducted.
(1) Operation in high and low temperature test
Figure 16a shows the results for the “Operation in
High and Low Temperature Test” of UL2034. The
sensor was exposed to environments of 0˚C/15%RH
and 49˚C/40%RH for at least three hours each,
with measurements taken before and during the
exposure in accordance with the test conditions
of UL2034. By plotting the output current values
from these test measurements atop the data taken
prior to this test at a constant 50%RH (representing
standard temperature dependency), it can be seen
that the test data are still in line with data taken
at a constant RH. The conclusion which can be
drawn is that, regardless of exposure to extremes
of temperature and humidity, the sensor's output
is not affected by humidity. As a result, TGS5141
can meet the requirements of UL2034 by utilizing a
simple temperature compensation method.
Figure 14 - Long term stability
Figure 15 - Durability against corrosion
Figure 16a - Operation in high and low temperature
(all data at 50%RH except test points)
0.0
0.5
1.0
1.5
2.0
2.5
3.0
0 100 200 300 400 500 600 700 800
ave.
min.
max.
I/Io
Time (days)
N=10
0.0
0.5
1.0
1.5
2.0
2.5
0 200 400 600 800 1000 1200
Before
After
Iout(µA)
CO concentration (ppm)
0.0
0.2
0.4
0.6
0.8
1.0
1.2
-20 0 20 40 60
CO 400ppm
CO 150ppm
CO 70ppm
CO 30ppm
Iout(µA)
Temperature (˚C)

Revised 11/18 10
TECHNICAL INFORMATION FOR TGS5141-P00
0.0
0.5
1.0
1.5
2.0
2.5
0 200 400 600 800 1000 1200
Before
After
Iout(µA)
CO concentration (ppm)
(2) Effect of shipping and storage
To verify the effects of shipping and storage, the
sensor was tested under the conditions of UL2034.
Test samples in a short-circuited condition were
subjected to 70˚C for 24 hours, allowed to cool to
room temperature for 1 hour, subjected to -40˚C
for 3 hours, and then allowed to warm up to room
temperature for 3 hours. Figure 16b shows the CO
sensitivity characteristics before and after the test,
demonstrating that TGS5141 meets the requirement
of UL2034.
4-5 Humidity test
Figure 17a shows the results of testing the sensor
under UL2034. The sensor was exposed in an
atmosphere of 52±3˚C/95±4%RH for a period of 168
hours,returnedtonormalairfor2days,thenfollowed
by 168 hours exposure at 22±3˚C/10±3%RH. The
data demonstrates the stable characteristics in both
low and high humidity conditions.
Figure 17b shows data taken prior to the above test
at a constant relative humidity of 50%. These curves
represent the typical temperature dependency of
the sensor. When plotting measurements taken at
the environmental extremes specied on UL2034
(52±3˚C/95±4%RH and 22±3˚C/10±3%RH) onto the
temperature dependency curves, it can be seen that
measurements taken at these extreme conditions still
fall in line with the temperature dependency curve
derived prior to testing. The conclusion which can
be drawn is that, regardless of exposure to extremes
of temperature and humidity, the sensor's output
is not affected by humidity. As a result, TGS5141
can meet the requirements of UL2034 by utilizing a
simple temperature compensation method.
Figure 16b - Effects of shipping and storage
Figure 17a - Humidity test
Figure 17b - Humidity test
(all data at 50%RH except test points)
0.0
0.2
0.4
0.6
0.8
1.0
1.2
0 5 10 15 20
400ppm
150ppm
70ppm
30ppm
Iout(µA)
CO concentration (ppm)
52˚C/95%RH
20˚C/7%RH
0.0
0.2
0.4
0.6
0.8
1.0
1.2
-20 0 20 40 60
CO 400ppm
CO 150ppm
CO 70ppm
CO 30ppm
Iout(µA)
Temperature (˚C)

Revised 11/18 11
TECHNICAL INFORMATION FOR TGS5141-P00
4-6 Stability test
(1) False alarm test
To show the sensor’s behavior under continuous
low level exposure to CO, samples were tested
against the procedure detailed in UL2034--Stability
Test. Test samples were exposed to 30ppm of
CO continuously for a period of 30 days under
standard circuit conditions. Figure 18 shows the
CO sensitivity characteristics before and after the
exposure test, demonstrating that detectors using
TGS5141 will not give a false alarm as a result of
continuous low level CO exposure.
(2) Temperature cycle test
In accordance with UL2034--Stability Test, test
samples were exposed to ten cycles (<1 hour and
>15 minutes) of temperature from 0˚C/100%RH
to 49˚C/40%RH. Figure 19 shows CO sensitivity
characteristics before and after the cycle test,
demonstrating that TGS5141 is hardly inuenced by
the extreme conditions of the temperature cycle test.
Figure 18 - False alarm test
Figure 19 - Temperature cycle test

Revised 11/18 12
TECHNICAL INFORMATION FOR TGS5141-P00
4-7 Dust test
To judge the effect of dust contamination on TGS5141,
approximately 2 ounces (0.06 kg) of cement dust, capable
of passing through a 200 mesh screen, was circulated for
1 hour by means of a blower, enveloping the sensor in the
test chamber. Air ow was maintained at an air velocity of
approximately 50 fpm (0.25 m/s) at 20˚C/40%RH.
Figure 20 shows the sensor's CO sensitivity characteristics
before and after the dust exposure test. This data
demonstrates that the dust test of UL2034 has a negligible
effect on CO sensitivity.
5. Marking
The two-dimensional bar code indicates the following
information:
xxxxYYMMDDnnnnnnnnnnnnnnnnnn
xxxx = sensor's sensitivity (slope) in numeric value as
determined by measuring the sensor's output in
300ppm of CO (Ex.1827=1.827nA/ppm)
YYMMDD = sensor's sensitivity measuring date in year-
month-day format (Ex.150401=1st April 2015)
nnnnnnnnnnnnnnnnnn = 18-digit manufacturer's serial
number
0.0
0.5
1.0
1.5
2.0
2.5
0 200 400 600 800 1000 1200
Before
After
Iout(µA)
CO concentration (ppm)
Figure 20 - Dust test
Two-dimensional bar code
Figure 21 - TGS5141 markings

Revised 11/18 13
TECHNICAL INFORMATION FOR TGS5141-P00
6. Cautions
6-1 Situations which must be avoided
1) Disassembling the sensor
Under no circumstances should the sensor be disassem-
bled, nor should the sensor can and/or cap be deformed.
2) Contamination by alkaline metals
Sensor characteristics may be signicantly changed when
the sensor is contaminated by alkaline metals, especially
salt water spray.
3) Exposure to high concentration of basic (non-acidic) gases
Sensor characteristics may be irreversibly changed by
exposure to high concentrations of basic gases such as
ammonia. Avoid long term exposure to or use of packing
materials that may generate basic gases.
4) Exposure to certain VOCs
Avoid prolonged exposure to certain VOCs such as
styrene (commonly used in blister packs and packing
trays) and a-pinene (found in some kinds of printing
inks). Off-gassing from such VOCs may cause irreversible
changes to sensor characteristics. Avoid packing the sensor
or products incorporating the sensor in a tightly closed
container in which such VOC gases may be present. It is
strongly recommended to conduct a test to see if there would
be any adverse inuence by packing materials on sensor
characteristics. If the sensor is excessively exposed to other
organic vapors such as alcohols or acetone, these gases may
cause temporary change of cross sensitivity characteristics.
5) High temperature exposure
At temperatures of 80˚C or higher, the sensing membrane
may deteriorate, resulting in irreversible change of sensor
characteristics.
6) Contact with water
Sensor characteristics may be changed due to soaking or
splashing the sensor with water.
7) Application of excessive voltage
If higher than specied voltage is applied to the sensor,
breakage may occur or sensor characteristics may drift,
even if no physical damage or breakage occurs. Do not
use the sensor once excessive voltage is applied.
6-2 Situations to avoid whenever possible
1) Exposure to silicone vapors
Avoid exposure of sensor where silicone adhesives, hair
grooming materials, or silicone rubber/putty may be
present. Silicone vapors may cause clogging of the gas
diffusion route.
2) Dew condensation
If severe dew condensation occurs for a long period
inside of the sensor or on the sensor surface, it may cause
clogging of gas diffusion route or deterioration of the
sensing membrane. Mild dew condensation which occurs
in normal indoor air would not cause any signicant
damage.
3) Exposure to hydrogen sulde or sulfuric acid gas
If the sensor is exposed to hydrogen sulde or sulfuric acid
gas, sensor components such as the gas diffusion lm, can,
and cap may be corroded, resulting in the sensor damage.
4) Vibration and shock
Vibration and shock may cause an open or short circuit
inside the sensor.
5) Dust and oil mist
Extremely high concentrations of dust or oil mist
may cause clogging of the sensor's internal structure.
When such conditions are expected to be encountered,
installation of an external air lter is recommended.
6) Flux for soldering
Manual soldering is recommended since high concen-
trations of ux may affect sensor characteristics when
the sensor is soldered by wave soldering. When wave
soldering is used, a test should be conducted before
production starts to see if there would be any inuence to
sensor characteristics. Please refer to Item 7-3 of Application
Notes for TGS5xxx Series for advice on manual soldering
conditions.
6-3 Additional cautions for installation
This sensor requires the existence of oxygen in the
operating environment to function properly and to exhibit
the characteristics described in this brochure. The sensor
will not operate properly in a zero oxygen environment.
Figaro USAInc. and the manufacturer, Figaro Engineering
Inc. (together referred to as Figaro) reserve the right to make
changes without notice to any products herein to improve
reliability, functioning or design. Information contained in
this document is believed to be reliable. However, Figaro
does not assume any liability arising out of the application
or use of any product or circuit described herein; neither
does it convey any license under its patent rights, nor the
rights of others.
Figaro's products are not authorized for use as critical
components in life support applications wherein a failure
or malfunction of the products may result in injury or
threat to life.

Revised 11/18 14
TECHNICAL INFORMATION FOR TGS5141-P00
APPENDIX
TGS5141-P00 Lead Conguration
Leads are connected to sensor electrodes when the
sensors are shipped.
Stainless steel (SUS) pin version (Fig. 22)
Solid SUS pins enable the sensor to be more easily
mounted and/or directly soldered onto a PCB.
The height from the PCB to the sensor should be 0.6 mm
or more to ensure sufcient electrical insulation from the
PCB.
Figure 22 - Dimensions (w/lead pins)
4.15±0.40
13.9±0.4
Top View
Side View
Bottom View
Unit : mm
Side View
3.75±0.40
0.80±0.05
7.5±0.2
0.80±0.05
4.0±0.1
14.65±0.40
0.20±0.050.20±0.05
11.65±0.60
10.8±0.2
1.40±0.05
7.7±0.4
4.15±0.40
Working electrode
Counter electrode
Ni-plated SUS304
0.8
0.8
2.2
2.0
A
B
6.5±0.1
11.6±0.1
0.8
1.8
2.0
0.8
1.8
2.0
2.0
3.0
3.2
2.2
3.2
3.4
Note:
・Unspecified tolerance: ±0.05
Enlarged view of “A” Enlarged view of “B”
Unit : mm
Figure 23 - Recommended footprint

Revised 11/18 15
TECHNICAL INFORMATION FOR TGS5141-P00
FIGARO GROUP
HEAD OFFICE
Figaro Engineering Inc.
1-5-11 Senba-nishi
Mino, Osaka 562-8505 JAPAN
Tel.: (81) 72-728-2561
Fax: (81) 72-728-0467
email: garo@garo.co.jp
www.garo.co.jp
OVERSEAS
Figaro USA Inc.
121 S. Wilke Rd. Suite 300
Arlington Heights, IL 60005 USA
Tel.: (1) 847-832-1701
Fax.: (1) 847-832-1705
email: garousa@garosensor.com
Figaro Sensor (Shanghai) Co., Ltd
Room No. 1003-1004A 511 Weihai Road
Shanghai 200041 CHINA
Tel.: (86) 21-6253-1501
Fax.: (86) 21-6251-2166
email: garo@garo-china.com
Table of contents
Other Figaro Accessories manuals

Popular Accessories manuals by other brands

Hytronik
Hytronik HIR28 quick start guide

Endress+Hauser
Endress+Hauser Condumax CLS15 operating instructions

ProMinent
ProMinent DULCOTEST CDE Series Assembly and operating instructions

Kramer
Kramer KRT-3 user manual

Honeywell
Honeywell Fire-Lite Alarms AD365A Installation and maintenance instructions

SICK
SICK deTec4 C4C-EV03030A10000 operating instructions


