Geokon 4850 User manual

Instruction Manual
Model 4850
N.A.T.M. Style
V.W. Concrete Stress cells
No part of this instruction manual may be reproduced, by any means, without the written consent of Geokon®.
The information contained herein is believed to be accurate and reliable. However, Geokon®assumes no responsibility for errors,
omissions or misinterpretation. The information herein is subject to change without notification.
Copyright © 1993-2019 by Geokon®
(Doc Rev I, 05/1/19)


Warranty Statement
Geokon warrants its products to be free of defects in materials and workmanship, under normal
use and service for a period of 13 months from date of purchase. If the unit should malfunction,
it must be returned to the factory for evaluation, freight prepaid. Upon examination by Geokon,
if the unit is found to be defective, it will be repaired or replaced at no charge. However, the
WARRANTY is VOID if the unit shows evidence of having been tampered with or shows
evidence of being damaged as a result of excessive corrosion or current, heat, moisture or
vibration, improper specification, misapplication, misuse or other operating conditions outside of
Geokon's control. Components which wear or which are damaged by misuse are not warranted.
This includes fuses and batteries.
Geokon manufactures scientific instruments whose misuse is potentially dangerous. The
instruments are intended to be installed and used only by qualified personnel. There are no
warranties except as stated herein. There are no other warranties, expressed or implied, including
but not limited to the implied warranties of merchantability and of fitness for a particular
purpose. Geokon is not responsible for any damages or losses caused to other equipment,
whether direct, indirect, incidental, special or consequential which the purchaser may experience
as a result of the installation or use of the product. The buyer's sole remedy for any breach of this
agreement by Geokon or any breach of any warranty by Geokon shall not exceed the purchase
price paid by the purchaser to Geokon for the unit or units, or equipment directly affected by
such breach. Under no circumstances will Geokon reimburse the claimant for loss incurred in
removing and/or reinstalling equipment.
Every precaution for accuracy has been taken in the preparation of manuals and/or software,
however, Geokon neither assumes responsibility for any omissions or errors that may appear nor
assumes liability for any damages or losses that result from the use of the products in accordance
with the information contained in the manual or software.


TABLE of CONTENTS
1. INTRODUCTION ...................................................................................................................................................1
1.1 THEORY OF OPERATION.......................................................................................................................................1
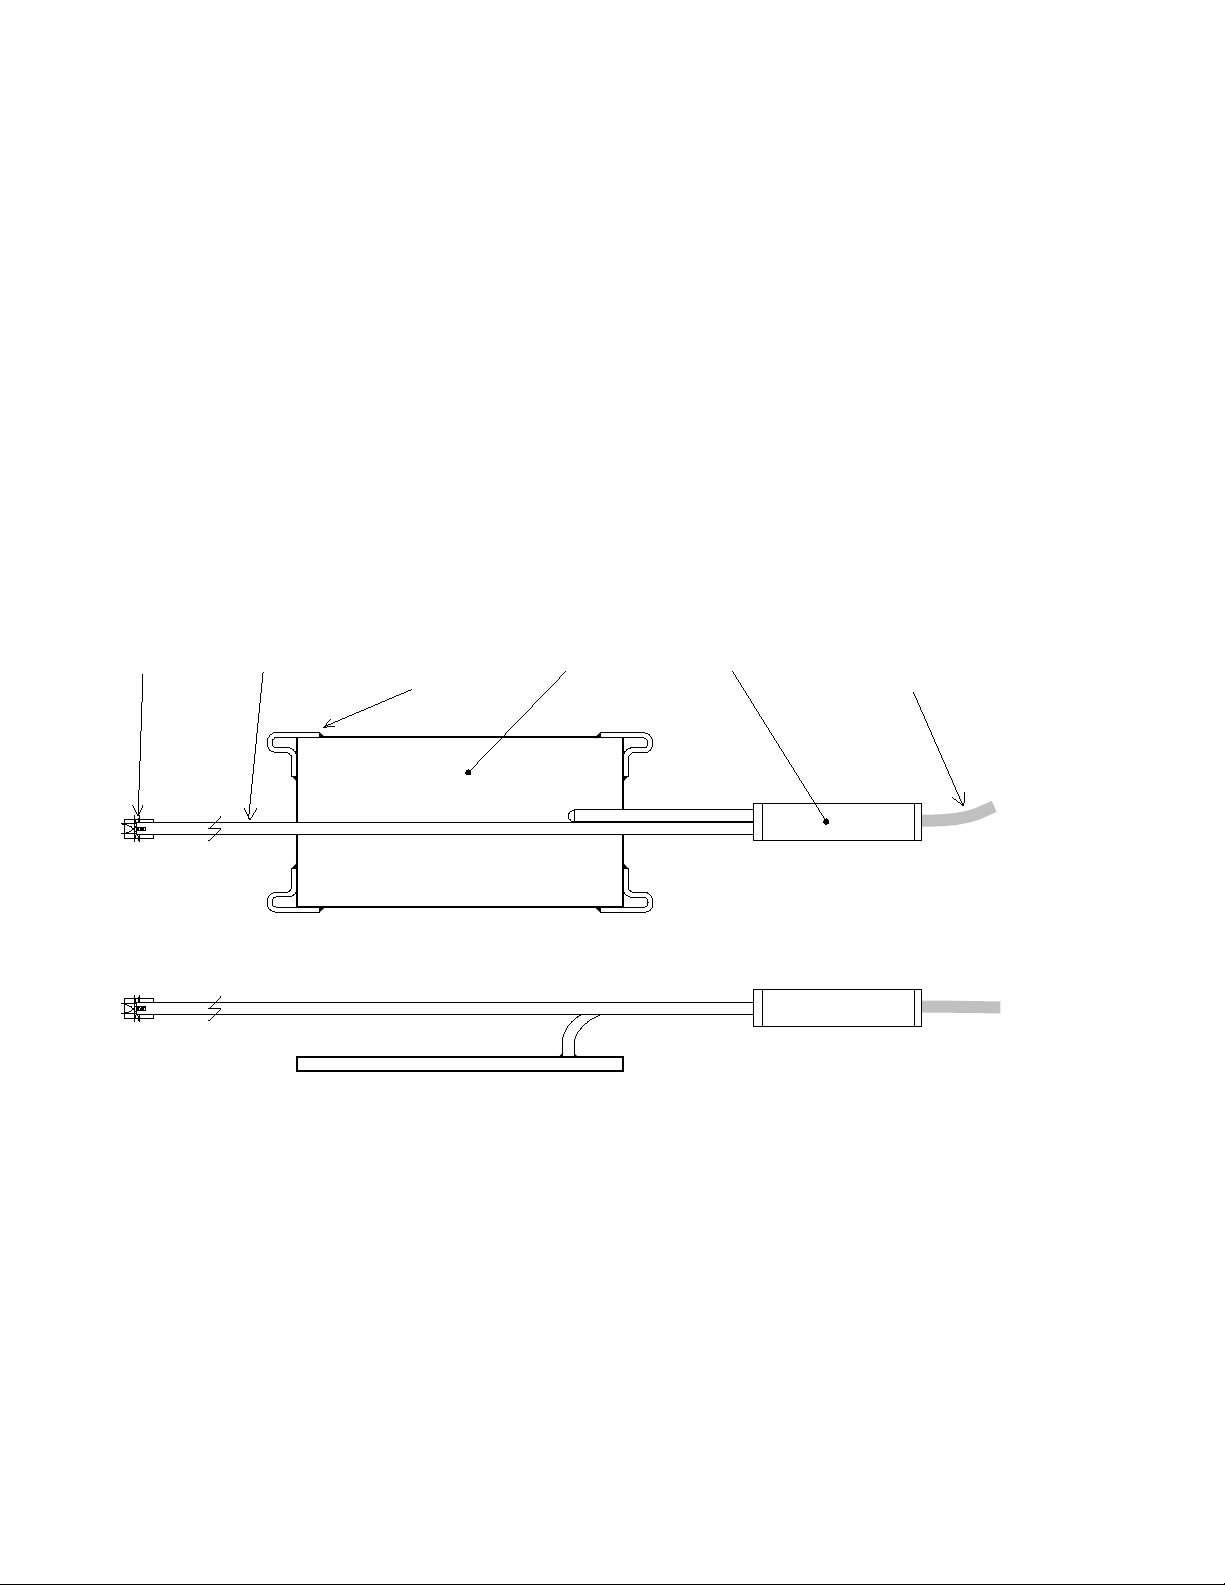
1.2 STRESS CELL DESIGN AND CONSTRUCTION.........................................................................................................2
2. INSTALLATION ....................................................................................................................................................3
2.1 PRELIMINARY TESTS............................................................................................................................................3
2.2 STRESS CELL INSTALLATION ...............................................................................................................................3
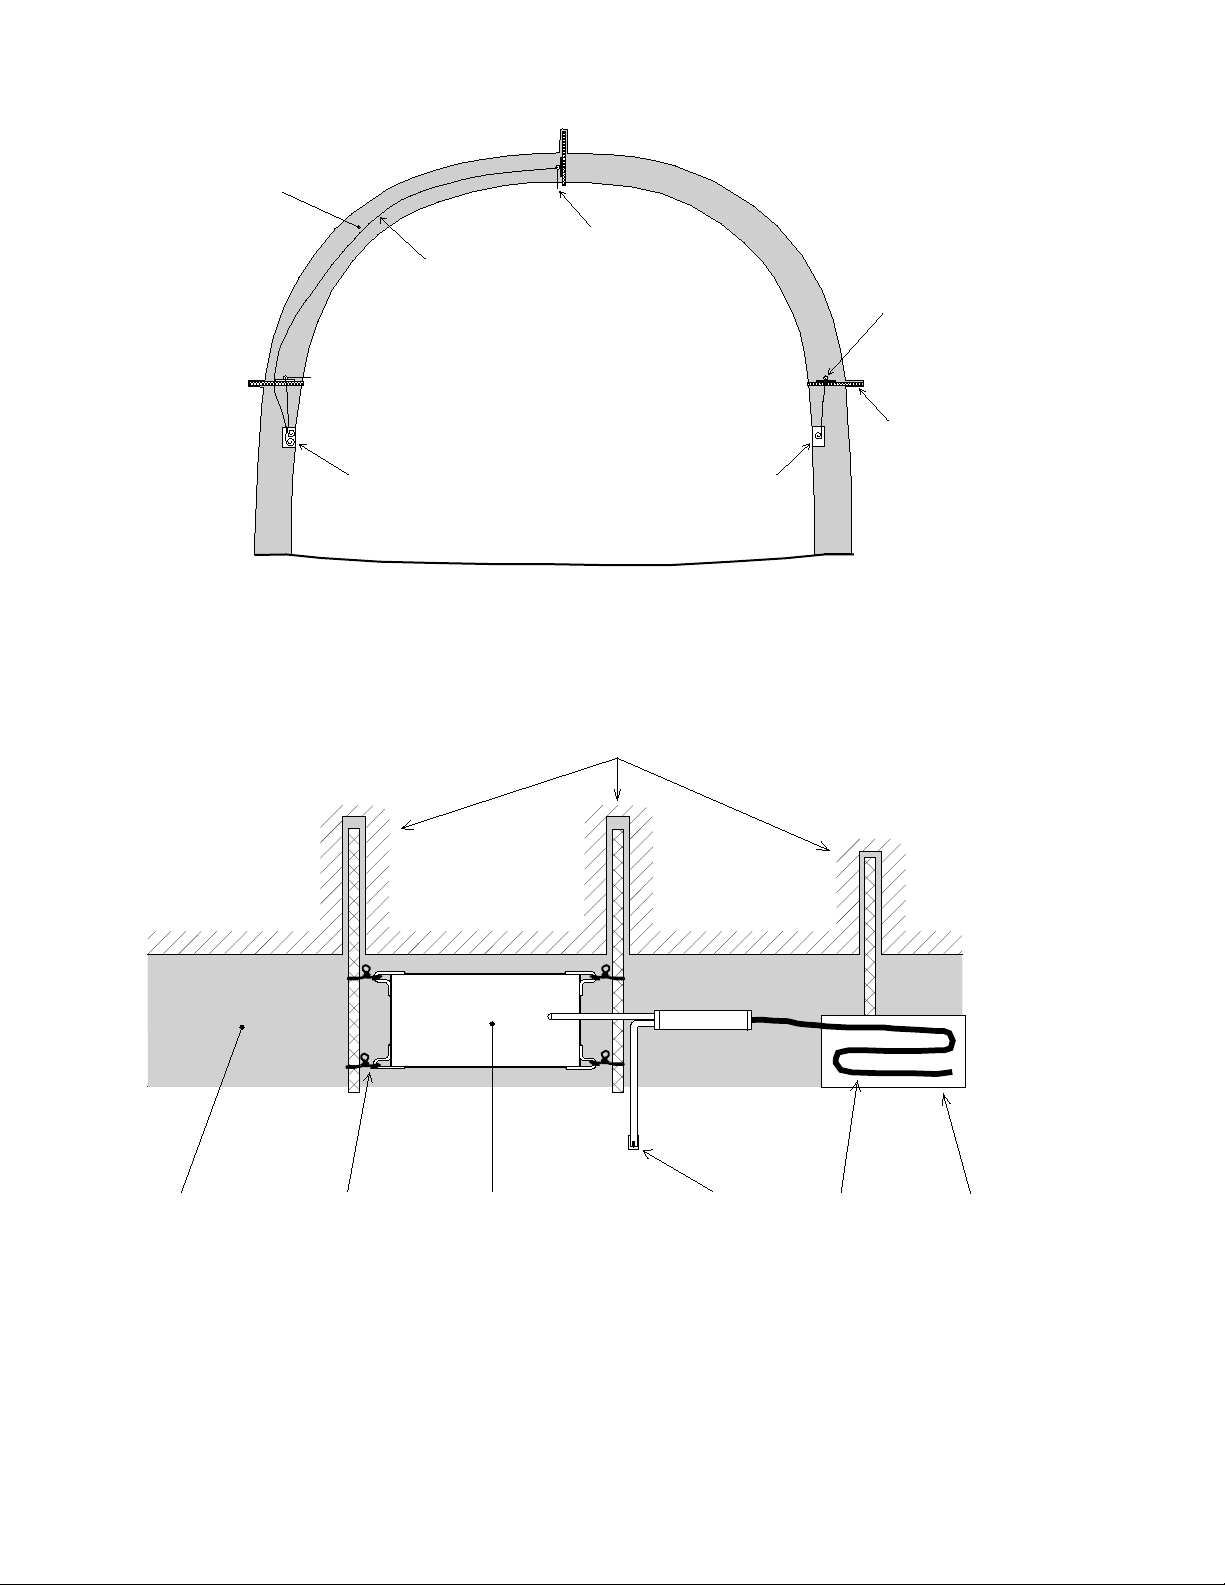
2.2.1 Installing the Model 4850-1........................................................................................................................3
2.2.2 Installing the Model 4850-2........................................................................................................................5
2.3 INITIAL READINGS ...............................................................................................................................................5
2.4 RE-PRESSURIZING THE CELL ...............................................................................................................................6
2.4.1 Standard Re-Pressurization Technique.......................................................................................................6
2.4.2 Remote Re-Pressurization Technique .........................................................................................................7
2.5 CABLE INSTALLATION .........................................................................................................................................8
2.6 ELECTRICAL NOISE..............................................................................................................................................8
3. TAKING READINGS.............................................................................................................................................9
3.1 GK-404 READOUT BOX.......................................................................................................................................9
3.1.1 Operating the GK-404 ................................................................................................................................9
3.2 GK-405 READOUT BOX.....................................................................................................................................10
3.2.1 Connecting Sensors...................................................................................................................................10
3.2.2 Operating the GK-405 ..............................................................................................................................10
3.3 GK-403 READOUT BOX (OBSOLETE MODEL)....................................................................................................11
3.3.1 Connecting Sensors...................................................................................................................................11
3.3.2 Operating the GK-403 ..............................................................................................................................11
3.4 MEASURING TEMPERATURES.............................................................................................................................11
4. DATA REDUCTION ............................................................................................................................................12
4.1 PRESSURE CALCULATION ..................................................................................................................................12
4.2 TEMPERATURE CORRECTION .............................................................................................................................12
4.3 BAROMETRIC CORRECTION ...............................................................................................................................12
5. TROUBLESHOOTING........................................................................................................................................13
6. APPENDIX A. SPECIFICATIONS.....................................................................................................................14
A.1 STRESS CELLS...................................................................................................................................................14
A.2 THERMISTOR (SEE APPENDIX BALSO) ..............................................................................................................14
APPENDIX B. THERMISTOR TEMPERATURE DERIVATION.....................................................................15
APPENDIX C. TEMPERATURE EFFECT ON EARTH PRESSURE AND CONCRETE STRESS CELLS 16
C.1 FORMULAS ........................................................................................................................................................16
C.2 EXAMPLES ........................................................................................................................................................19
APPENDIX D. TYPICAL CALIBRATION REPORT..........................................................................................21

FIGURES
FIGURE 1-GROUND REACTION CURVE ......................................................................................................................... 1
FIGURE 2-MODEL 4850 CONCRETE STRESS CELL ........................................................................................................ 2
FIGURE 3-MODEL 4850-1 INSTALLATION .................................................................................................................... 4
FIGURE 4-MODEL 4850-1 INSTALLATION DETAIL ....................................................................................................... 4
FIGURE 5-MODEL 4850-2 INSTALLATION DETAIL ....................................................................................................... 5
FIGURE 6-CELL RE-PRESSURIZATION GRAPH .............................................................................................................. 6
FIGURE 7-MODEL 4850 WITH REMOTE PINCHING APPARATUS .................................................................................... 7
FIGURE 8-LEMO CONNECTOR TO GK-404 ................................................................................................................... 9
FIGURE 9-LIVE READINGS –RAW READINGS..............................................................................................................10
FIGURE 10 -RADIUS (R) AND THICKNESS (D) ..............................................................................................................16
FIGURE 11 -TYPICAL CALIBRATION REPORT ...............................................................................................................21
TABLES
TABLE 1-SPECIFICATIONS ...........................................................................................................................................14
TABLE 2-THERMISTOR RESISTANCE VERSUS TEMPERATURE ......................................................................................15
TABLE 3-TYPICAL VALUES OF VARIOUS CELL PARAMETERS .....................................................................................18
EQUATIONS
EQUATION 1-CONVERT DIGITS TO PRESSURE .............................................................................................................12
EQUATION 2-TEMPERATURE CORRECTION FOR TRANSDUCER ONLY..........................................................................12
EQUATION 3-RESISTANCE TO TEMPERATURE .............................................................................................................15
EQUATION 4-EXPANSION OF LIQUID FOR A TEMPERATURE RISE OF 1°C....................................................................16
EQUATION 5-COMPRESSION OF LIQUID.......................................................................................................................16
EQUATION 6-EXPANSION OF LIQUID ...........................................................................................................................16
EQUATION 7-DEFORMATION AT THE CENTER .............................................................................................................17
EQUATION 8-DEFORMATION AT THE EDGE .................................................................................................................17
EQUATION 9-DIFFERENCE IN DEFORMATION ..............................................................................................................17
EQUATION 10 -AVERAGE TOTAL EXPANSION OF THE CELL.........................................................................................17
EQUATION 11 -COMBINED EQUATIONS........................................................................................................................17
EQUATION 12 -TOTAL EMBEDMENT ............................................................................................................................18
EQUATION 13 -TOTAL EMBEDMENT FOR CONTACT PRESSURE CELLS .........................................................................18

1. INTRODUCTION
1.1 Theory of Operation
The “New Austrian Tunneling Method”, or N.A.T.M., calls for the support of a tunnel by the
rapid application of shotcrete to the freshly exposed ground. The theory behind this method of
support, particularly useful in weaker ground, is that if the inherent strength of the ground can be
preserved, it will be almost self-supporting and will require much less artificial support in the
form of concrete or steel. To preserve the inherent cohesion of the ground it is necessary to
prevent it from breaking up in the first place and, hence, the need for a rapidly applied layer of
shotcrete.
Support Deformation
Ground Characteristic
In-Situ Stress Level
Radial
Support
Pressure
Failure
A
B
C
D
(A,B,C,D)
Figure 1 - Ground Reaction Curve
The above figure graphically shows the ground reaction curve, i.e., the amount of support
required versus the amount of inherent support and ground deformation. Thus, to prevent any
support deformation (or tunnel closure) at all, would require a support pressure exerted on the
tunnel walls equal to the original in-situ ground stress.
A strong lining with characteristics of curve A would allow only a small amount of ground
deformation, but might, because it is too strong, be uneconomical. A thinner lining which would
allow more deformation would have characteristics of curves B or C. However, a lining which is
too thin, with characteristics shown by curve D, would allow too much deformation of the rock
allowing it to weaken and ultimately fail.
The task of the N.A.T.M. stress cells is to provide a measure of the support pressure which, when
coupled with a measurement of tunnel closure, using a tape extensometer, will allow an
assessment to be made of the adequacy of the shotcrete lining, indicating the need for perhaps
more or less shotcrete to maintain stability. It is this ability to monitor the performance of the
shotcrete lining that can lead to significant reductions in tunnel support costs.

2
1.2 Stress Cell Design and Construction
The basic cell is comprised of two stainless steel rectangular plates welded together around their
periphery, leaving a thin space between the plates which is then filled with de-aired hydraulic
oil*. This fluid filled space is connected via a pressure tube to a vibrating wire pressure sensor.
Pressure applied normal to the plate is balanced by a corresponding build-up of internal fluid
pressure which is measured by the sensor.
Lugs are provided at the corners of the rectangular plates to facilitate holding the cells in place
while the shotcrete is applied.
One further refinement is required; this is the pinch tube, which is filled with mercury or de-aired
hydraulic oil and is connected at one end to the fluid filled space between the plates and the other
end is capped. The purpose of this pinch tube is to inflate the cell when the concrete around it has
fully cured and has cooled off to the ambient temperature. During concrete curing, temperatures
very often rise and will cause the cell to expand in the still green concrete. On cooling, the cell
contracts leaving a space between it and the surrounding concrete which, if allowed to remain,
would prevent the transmission of pressures from the concrete to the cell.
Pinch Tube Stress Cell Transducer Housing Instrument Cable
(4 conductor, 22 AWG)
Mounting Lug
Seal Screw
(4 places)
Side View
Top View
Figure 2 - Model 4850 Concrete Stress Cell
The vibrating wire sensor is a standard Geokon Model 4500H transducer inside an all welded
housing. The sensor is hermetically sealed and is connected via waterproof connectors to an
electrical cable leading to the readout location. The sensor housing also incorporates a thermistor
which permits measurement of temperature at the cell location.
* Most other commercially available concrete stress cells are filled with mercury in order to
achieve a sufficient cell stiffness. However, the filling procedures and the construction details of
the Geokon cell are such that mercury is not required.

3
2. INSTALLATION
2.1 Preliminary Tests
It is always wise, before installation commences, to check the cells for proper functioning. Each
cell is supplied with a calibration report which shows the relationship between readout digits and
pressure and shows the initial no load zero reading. The cell electrical leads (usually the red and
black leads) are connected to a readout box and the zero reading given on the sheet is now
compared to a current zero reading. (See Section 3 for readout instructions.) The two readings
should not differ by more than ≈50 digits after due regard to corrections made for different
temperatures, barometric pressures and height above sea level and actual cell position (whether
standing up or laying down).
By pressing on the cell, it should be possible to change the readout digits, causing them to fall as
the pressure is increased.
Checks of electrical continuity can also be made using an ohmmeter. Resistance between the
gauge leads should be approximately 180 ohms, ±10 ohms. Remember to add cable resistance
when checking (22 AWG stranded copper leads are approximately 14.7Ω/1000' or 48.5Ω/km,
multiply by two for both directions). Resistance between the green and white conductors varies
with the temperature. Compare the measured resistance with the values given in Table 2 of
Appendix B. Resistance between any conductor and the shield should exceed 20 megohm.
2.2 Stress Cell Installation
Cells are positioned on the wall of the tunnel in two ways, one way to measure tangential stresses
and the other to measure radial.
2.2.1 Installing the Model 4850-1
The Model 4850-1 is designed to measure tangential stresses in the lining. Figure 3 shows
one method of installation using short pieces of steel rebar grouted inside short boreholes
and protruding into the area where the lining will be placed.
The pressure cells are tied to these rebars using soft iron wire connected to the lugs at the
corners of the cell. The cable is fixed firmly to other pieces of rebar or to the reinforcing
mesh, if one is used, and is strung out to the readout location which typically is made of a
metal junction box with removable hinged cover. The cable is terminated inside this box.
Sufficient cable is coiled inside the box to allow it to be pulled out and connected to a
portable readout box.
Note: It is very important that the concrete makes intimate contact with the
pressure cell. Therefore, the concrete should be sprayed on, first from below and
then, after removing any rebound material, from above. The person spraying the
concrete should receive special instructions so that no open shadow zones are
created next to the cell.

4
Tunnel Cross Section
Shotcrete Lining
Model 4850-1
Rebar Dowel
Pinch Tube
Junction Box Junction Box
Instrument Cable
Figure 3 - Model 4850-1 Installation
The pinch tube is bent so that it will protrude from the lining after it has been placed. Or it
can be wrapped in foam, plastic, etc. so that it can be dug out and retrieved after
shotcreting.
Tie WireShotcrete Lining
Rebar Dowels
Pinch TubeModel 4850-1 Instrument Cable Junction Box
(grouted into boreholes)
Figure 4 - Model 4850-1 Installation Detail

5
2.2.2 Installing the Model 4850-2
The Model 4850-2 is designed to measure radial pressures on the tunnel lining.
To accommodate irregularities in the rock surface, it is necessary to fill the space between
the rock surface and the cell with quick setting mortar.
The rock surface is prepared by smoothing it off and flattening it as much as possible with
whatever hand tool will do the job. Nail, pins, pads, or pieces of rebar grouted into
boreholes adjacent to the cell location are now fixed in place. A quick setting mortar pad
is troweled onto the surface and the cell is then pressed down onto the pad causing the
mortar to extrude sideways thus eliminating any air bubbles or spaces between the cell
and the ground. When in place the cell must be gripped firmly using the previously
installed hardware. See Figure 5.
The cable is routed to the readout location and held firmly in place by tying it off to other
rebars, nails, etc. driven into the ground or to the reinforcing mesh, of one is used. At the
readout location the cable can be coiled inside a box, cast inside the shotcrete lining as
before.
The pinch tube should be bent so as to protrude from where the lining will be or can be
wrapped in foam, etc. so that it can be easily retrieved after shotcreting.
Model 4850-2
Pinch Tube
Shotcrete Lining
Mortar Pad
Nails
Instrument Cable
Junction Box
Radial Pressure Cell (driven into the ground
and bent over to
grip the cell)
Figure 5 - Model 4850-2 Installation Detail
2.3 Initial Readings
Before shotcreting, take initial readings on all the cells and record in the field book. Take all
initial temperatures also using either a Readout Box or a digital ohmmeter.

6
2.4 Re-Pressurizing the Cell
2.4.1 Standard Re-Pressurization Technique
After shotcreting, the cells temperature and initial reading can be read again. Once the
temperature has stabilized to ambient then the cells can be inflated using the pinch tube
and a special set of accessory pliers. The cell is first connected to the readout and then the
pliers are used to squeeze the pinch tube flat beginning at the capped end. (See Section 3
for readout instructions.)
CAUTION: Do not pinch the pinch tube closer than one inch from the end,
otherwise the seal screw in the end of the tube could be damaged.
As the tube is progressively squeezed flat, the hydraulic oil is forced out of the tube and
into the cell and the pressure will rise. It is necessary to make a chart showing the
relationship between the length of flattened pinch tube and the corresponding reading on
the readout box (which can be converted to a pressure if so desired, but this is not
necessary).
Length of Tube Pinched
Decrease
"Knee"
in
Reading
(or increase
in pressure)
Stop Here
Figure 6 - Cell Re-Pressurization Graph
As the cell expands inside any space that may exist, the pressure rise accompanying each
pinch will be small (only one or two digits). But as soon as the cell starts to fill the space
the pressure rise with each pinch will become larger.
A graph of the readings should show a pronounced “knee” where cell concrete contact is
made (as shown in Figure 6). As soon as this “knee” is passed the pinching can cease and
the pinch tube is bent out of the way, so that it lays flat on the tunnel lining surface.
However, it is also possible that the cell is already in good contact with the concrete, so
the pinching will immediately cause a pressure rise in the cell. If this is the case, then
cease pinching immediately.
Continued pinching after the cell has made good contact could cause the concrete around
the cell to split open which is not desirable and could lead to erroneous readings. Record
the new initial pressure after the cell has stabilized.

7
2.4.2 Remote Re-Pressurization Technique
Occasionally the concrete stress cell may be located at some distance from an accessible
surface and would require a pinch tube which is longer than is practical (i.e., over three
meters).
In this case it is possible to use the Geokon remote pinching apparatus as shown in Figure
7.
Figure 7 - Model 4850 with Remote Pinching Apparatus
A short pinch tube is pinched by a hydraulic piston on the end of a hydraulic line leading
to a hydraulic pump.
While the concrete is curing it will be a good idea to take simultaneous readings of
temperature and pressure to develop a temperature correction factor. See Section 4.2 for
information on temperature corrections.
When the concrete has cured and cooled the tube is pinched by applying pressure with the
hydraulic pump. The pinching effect begins at around 4 MPa (600) psi when the pinched
tube begins to crush and continues to about 10 MPa (1450 psi) when the tube is
completely flattened. The maximum burst pressure of the hydraulic tube is 17 MPa (2500
psi).
Connect the stress cell to the Model GK-404 or GK-405, readout box, (channel B), while
pinching. Stop pinching as soon as the pressure in the cell starts to rise rapidly. At this
point the cell is now in good contact with the surrounding concrete.
Generally, the pressure inside the stress cell should be increased until it is equal to about
110% of the estimated concrete stress. A slight relaxation of the cell after the re-
pressurization procedure is normal and should drop the cell pressure to a value roughly
equal to the concrete stress. From this point on, the cell pressure should then be equal to
the absolute concrete stress.

8
2.5 Cable Installation
The cable should be protected from accidental damage caused by moving equipment or fly rock.
This is best done by putting the excess cable inside a junction box (as shown in Figure 4 and
Figure 5).
Cables may be spliced to lengthen them, without affecting gauge readings. Always waterproof
the splice completely, preferably using an epoxy-based available from the factory.
2.6 Electrical Noise
Care should be exercised when installing instrument cables to keep them as far away as possible
from sources of electrical interference such as power lines, generators, motors, transformers, arc
welders, etc. Cables should never be buried or run with AC power lines. The instrument cables
will pick up the 50 or 60 Hz (or other frequency) noise from the power cable and this will likely
cause a problem obtaining a stable reading. Contact the factory concerning filtering options
available for use with the Geokon dataloggers and readouts should difficulties arise.

9
3. TAKING READINGS
3.1 GK-404 Readout Box
The Model GK-404 Vibrating Wire Readout is a portable, low-power, handheld unit that can run
continuously for more than 20 hours on two AA batteries. It is designed for the readout of all
Geokon vibrating wire gauges and transducers; and is capable of displaying the reading in either
digits, frequency (Hz), period (µs), or microstrain (µε). The GK-404 also displays the
temperature of the stress cell (embedded thermistor) with a resolution of 0.1 °C.
3.1.1 Operating the GK-404
Before use, attach the flying leads to the GK-404 by aligning the red circle on the silver
“Lemo” connector of the flying leads with the red line on the top of the GK-404 (Figure
8). Insert the Lemo connector into the GK-404 until it locks into place.
Figure 8 - Lemo Connector to GK-404
Connect each of the clips on the leads to the matching colors of the sensor conductors,
with blue representing the shield (bare).
To turn the GK-404 on, press the “ON/OFF” button on the front panel of the unit. The
initial startup screen will be displayed. After approximately one second, the GK-404 will
start taking readings and display them based on the settings of the POS and MODE
buttons.
The unit display (from left to right) is as follows:
•The current Position: Set by the POS button. Displayed as a letter A through F.
•The current Reading: Set by the MODE button. Displayed as a numeric value
followed by the unit of measure.
•Temperature reading of the attached gauge in degrees Celsius.
Use the POS button to select position B and the MODE button to select Dg (digits).
(Other functions can be selected as described in the GK-404 Manual.)
The GK-404 will continue to take measurements and display readings until the unit is
turned off, either manually, or if enabled, by the Auto-Off timer. If the no reading
displays or the reading is unstable, see Section 5 for troubleshooting suggestions.
For further information, please see the GK-404 manual.

10
3.2 GK-405 Readout Box
The GK-405 Vibrating Wire Readout is made up of two components: The Readout Unit,
consisting of a Windows Mobile handheld PC running the GK-405 Vibrating Wire Readout
Application; and the GK-405 Remote Module, which is housed in a weatherproof enclosure and
connects to the vibrating wire gauge to be measured. The two components communicate
wirelessly. The Readout Unit can operate from the cradle of the Remote Module, or, if more
convenient, can be removed and operated up to 20 meters from the Remote Module.
3.2.1 Connecting Sensors
Connecting sensors with 10-pin connectors:
Align the grooves on the sensor connector (male), with the appropriate connector on the
readout (female connector labeled senor or load cell). Push the connector into place, and
then twist the outer ring of the male connector until it locks into place.
Connecting sensors with bare leads:
Attach the GK-403-2 flying leads to the bare leads of a Geokon vibrating wire sensor by
connecting each of the clips on the leads to the matching colors of the sensor conductors,
with blue representing the shield (bare).
3.2.2 Operating the GK-405
Press the button labeled “POWER ON”. A blue light will begin blinking, signifying that
the Remote Module is waiting to connect to the handheld unit. Launch the GK-405
VWRA program by tapping on “Start” from the handheld PC’s main window, then
“Programs” then the GK-405 VWRA icon. After a few seconds, the blue light on the
Remote Module should stop flashing and remain lit. The Live Readings Window will be
displayed on the handheld PC. Choose display mode “B”. Figure 9 shows a typical
vibrating wire output in digits and thermistor output in degrees Celsius. If no reading
displays or the reading is unstable, see Section 5 for troubleshooting suggestions. For
further information, consult the GK-405 Instruction Manual.
Figure 9 - Live Readings – Raw Readings

11
3.3 GK-403 Readout Box (Obsolete Model)
The GK-403 can store gauge readings and apply calibration factors to convert readings to
engineering units. The following instructions explain taking gauge measurements using Mode
“B”. Consult the GK-403 Instruction Manual for additional information.
3.3.1 Connecting Sensors
Connecting sensors with 10-pin connectors:
Align the grooves on the sensor connector (male), with the appropriate connector on the
readout (female connector labeled senor or load cell). Push the connector into place, and
then twist the outer ring of the male connector until it locks into place.
Connecting Sensors with Bare Leads:
Attach the GK-403-2 flying leads to the bare leads of a Geokon vibrating wire sensor by
connecting each of the clips on the leads to the matching colors of the sensor conductors,
with blue representing the shield (bare).
3.3.2 Operating the GK-403
1) Turn the display selector to position “B”.
2) Turn the unit on.
3) The readout will display the vibrating wire output in digits. The last digit may change
one or two digits while reading.
4) The thermistor reading will be displayed above the gauge reading in degrees
centigrade.
5) Press the “Store” button to record the value displayed.
If the no reading displays or the reading is unstable, see Section 5 for troubleshooting
suggestions. The unit will turn off automatically after approximately two minutes to
conserve power.
3.4 Measuring Temperatures
Each Vibrating Wire Stress Cell is equipped with a thermistor for reading temperature. The
thermistor gives a varying resistance output as the temperature changes. Geokon readout boxes
will read the thermistor and display temperature in °C automatically. To read the thermistor
using an ohmmeter, complete the following:
1) Connect the ohmmeter to the two thermistor leads coming from the stress cell. (Usually
white and green.) Since the resistance changes with temperature are large, the effect of cable
resistance is usually insignificant.
2) Look up the temperature for the measured resistance in Table 2 in Appendix B.

12
4. DATA REDUCTION
4.1 Pressure Calculation
To convert digits to pressure the following equation applies;
Pressure =(Current Reading - Initial Reading) ×Calibration Factor
Or
P = (R1– R0)×G
Equation 1 - Convert Digits to Pressure
The Initial Reading is normally obtained during installation (usually the zero reading). The
Calibration Factor (usually in terms of PSI or MPa per digit) comes from the supplied calibration
report. (See Appendix D for a sample report.)
4.2 Temperature Correction
The vibrating wire stress cell is quite sensitive to temperature fluctuations. The Calibration report
shows the temperature correction for the VW transducer only and usually this effect is
insignificant and can be ignored. But, if a correction is desired it can be made using the factors
supplied on the calibration report and Equation 2. However, there can be much larger
temperature effects caused by the mismatch between temperature coefficients of the cell and
surrounding concrete. This effect is not quantifiable in the laboratory, but a theoretical treatment
is given in appendix C.
Temperature Correction =(Current Temperature - Initial Temperature) ×Thermal
Factor
Or
PT= + (T1- T0) x K
Equation 2 - Temperature Correction for Transducer Only
In practice, the best way to compensate for temperatures is to derive a thermal correction
factor from simultaneous measurements of pressure and temperature at times when it can
be safely assumed that the applied load is not changing. Perhaps the best time to do this is
while the concrete is curing.
4.3 Barometric Correction
Barometric pressure fluctuations will be sensed by the cells. However, the magnitudes (±0.5 psi)
are usually insignificant.

13
5. TROUBLESHOOTING
Maintenance and troubleshooting of Vibrating Wire Concrete Stress Cells is confined to periodic
checks of cable connections. Once installed, the cells are usually inaccessible and remedial
action is limited.
Consult the following list of problems and possible solutions should difficulties arise. Consult
the factory for additional troubleshooting help.
Symptom: Stress Cell Readings are Unstable
Is the readout box position set correctly? If using a datalogger to record readings
automatically are the swept frequency excitation settings correct?
Is there a source of electrical noise nearby? Most probable sources of electrical noise are
motors, generators and antennas. Make sure the shield drain wire is connected to ground whether
using a portable readout or datalogger. Make sure to connect the clip with the blue boot to the
shield drain wire.
Does the readout work with another stress cell? If not, the readout may have a low battery or
be malfunctioning.
Symptom: Stress Cell Fails to Read
Is the cable cut or crushed? This can be checked with an ohmmeter. Nominal resistance
between the two gauge leads (usually red and black leads) is 180Ω, ±10Ω. Remember to add
cable resistance when checking (22 AWG stranded copper leads are approximately 14.7Ω/1000'
or 48.5Ω/km, multiply by two for both directions). If the resistance reads infinite, or very high
(megohms), a cut wire must be suspected. If the resistance reads very low (<100Ω) a short in the
cable is likely.
Does the readout or datalogger work with another stress cell? If not, the readout or datalogger
may be malfunctioning.

14
6. APPENDIX A. SPECIFICATIONS
A.1 Stress Cells
Model:
4850-1
Tangential
4850-2
Radial
Ranges:
7 MPa (1000 psi)
20 MPa (3000 psi)
2 MPa (300 psi)
3.5 MPa (500 psi)
5 MPa (750 psi)
Sensitivity:
0.025% FSR
Accuracy:
0.10% FSR
Linearity:
0.25% FSR (standard)
0.1% FSR (optional)
Operating
Temperature:
-30 to +70° C
Frequency range
1400-3500Hz
Dimensions:
100 ×200 mm, 4 ×8"
150 ×250 mm, 6 ×10"
Pinch Tube Length:
600 mm
Material:
303 & 304 Stainless Steel
Electrical Cable:
2 twisted pair (4 conductor) 22 AWG
Foil shield, PVC jacket, nominal OD=6.3 mm (0.250")
Table 1 - Specifications
Consult the factory for other sizes or options available.
A.2 Thermistor (see Appendix B also)
Range: -80 to +150° C
Accuracy: ±0.5° C
Table of contents
Other Geokon Industrial Equipment manuals
Popular Industrial Equipment manuals by other brands

Martin Yale
Martin Yale intimus 9000 operating instructions

SteelMax
SteelMax ABM-28 Operator's manual

Stoll
Stoll CMS 933 operating instructions

Allen-Bradley
Allen-Bradley Guardmaster LRTS installation instructions

Axminster
Axminster PROfessional AP330ST Original instructions

Balluff
Balluff BIS U-4A7-082-01C-07-S4 manual