AQUASCAN 610 5/41
Version 1.1
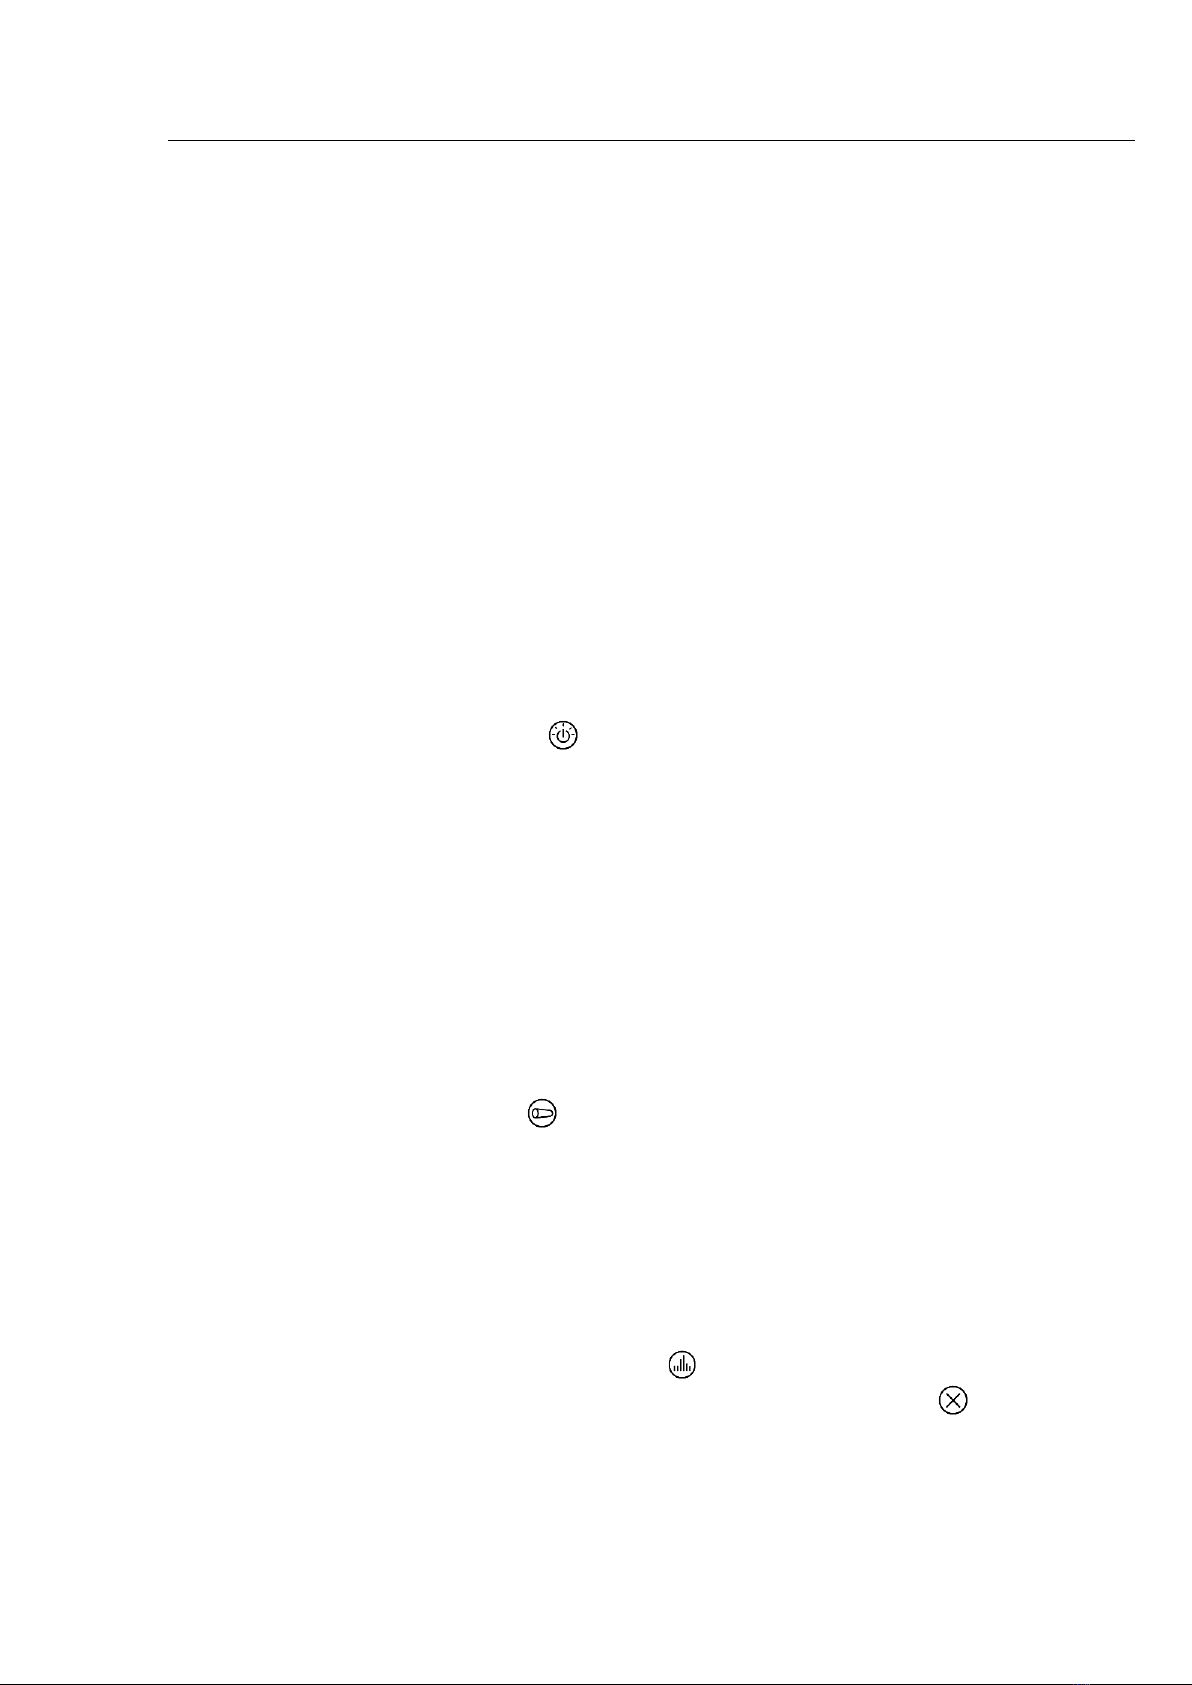
5. Leak Confidence is the percentage possibility of there being a leak;
any correlation above 80% should be investigated.
6. The radio signal strength is an indicator of the quality of the radio
reception. The more blocks filled in the better the signal. Stand half
way between sensors to balance the number of blocks also listen to
the sensors to determine any radio interference.
7. Leak position is the distance from Sensor A and B to the leak. The
tallest correlated peak determines the position.
8. Cursor position is the distance to the dotted line on the correlation
curve. This is user adjustable by using or .
9. Frequency Spectra B is the sound signal frequency curve from
sensor B and is displayed between 0 to 2500Hz. This is useful for
evaluating the sensor’s signals individually. You may be able to see:
Interferences that the sensors picked up; e.g., from the electricity
mains frequency. Mains frequency interference appears as a peak
at 50 or 60 Hz, depending on your country.
Weak radio transmission, if the radio transmission is very weak or
missing, e.g. caused by an auto-shut-off of the transmitter, the
sensor's spectrum will contain a white noise distribution. White
noise shows as a nearly equal power distribution across all
frequencies. In the graph, you will see the bars for the frequencies
form a straight horizontal line.
10. Signal level B is the sound signal strength indicated by blocks; the
more blocks filled in the stronger the signal.
11. The combined spectra or cross spectrum is a spectrum made up of
only the correlating components of the two signals. We recommend
using the cross spectrum as a guide to filter adjustment.
12. Notch Filter; Electricity interference appears as a peak at 50 or 60
Hz, depending on the country e.g. USA and Philippines = 60HZ,
Most of Europe, Australia, New Zealand, Singapore, Malaysia =
50HZ. A 50 or 60 Hz Notch filter can be applied to eliminate the
interference.
The Filter settings displayed is the bandwidth created by the lower
(e.g. 300Hz) and upper filter (e.g. 1200 Hz) which are represented
by dotted lines on the combined spectra. These filters are
determined by the pipe material selected, using manual filtering the
lower and upper filter maybe adjusted- see filtering chapter 4.4
13. Signal level A is the sound signal strength indicated by blocks; the