Heinzmann Triton CPM 500 User manual

Copyright 2017 by Heinzmann GmbH & Co. KG. All rights reserved.
This publication may not be reproduced by any means whatsoever or passed on to any third parties.
8018 Manual SF 17 001-e / 05-17
Heinzmann GmbH & Co. KG
Engine & Turbine Management
Am Haselbach 1
D-79677 Schönau
Germany
Phone +49 7673 8208 - 0
Fax +49 7673 8208 - 188
E-mail info@heinzmann.de
www.heinzmann.com
V.A.T. No.: DE145551926
HEINZMANN
Engine & Turbine Management
Safety Systems
CPM 500
Electronic
Peak Pressure Indicator
Operating manual
Software Release l.0.7.8 2017-03-22

Contents
Page 2 of 46
Content
1Scope of supply ________________________________________________________ 4
2Important information __________________________________________________ 5
2.1 Use of the operator manual__________________________________________________5
3Description ___________________________________________________________ 6
3.1 Introduction ______________________________________________________________6
3.2 Measure functions _________________________________________________________6
3.3 Functional description______________________________________________________6
4Operation_____________________________________________________________ 7
4.1 Operator push buttons _____________________________________________________7
4.2 Operating functions________________________________________________________8
4.3 Installation of visualisation- and USB driver software____________________________9
4.4 Select COM port of PC _____________________________________________________9
4.5 Charge battery ___________________________________________________________10
4.6 Change battery___________________________________________________________11
4.7 Mounting instructions on marine engines _____________________________________11
4.8 Measuring with CPM 500 __________________________________________________12
5Visualisation software release 1.0.7.8 _____________________________________ 13
5.1 Main tool bar buttons _____________________________________________________13
5.2 Load measured data from CPM 500 to PC ____________________________________15
5.3 Load measured data from hard disc to PC ____________________________________15
5.4 Monitoring of combustion data _____________________________________________16
5.4.1 Screen page “Cylinder pressure curve” _____________________________________________16
5.4.1.1 Indication of all cylinders ___________________________________________________16
5.4.1.2 Cross On function _________________________________________________________17
5.4.1.3 Save to ASCII ____________________________________________________________18
5.4.1.4 Optimize function for application on two-strokes_________________________________18
5.4.1.5 Save Shift _______________________________________________________________20
5.4.1.6 Automatic Pcomp calculation on four-strokes ___________________________________21
5.4.1.7 Additional functions _______________________________________________________22
5.4.2 Screen page “Pmax diagram” _____________________________________________________23
5.4.3 Screen page “Engine report” _____________________________________________________23
5.4.4 Screen page “Pmax balance” _____________________________________________________24
5.4.5 Screen page “Remarks” _________________________________________________________24
5.4.6 Screen page “Engine data” _______________________________________________________24
5.5 Delete measurement on CPM 500 ___________________________________________24
5.6 Open *.csv files with Excel _________________________________________________25
5.7 620-66-002-00 IPOWER- and IMEP calculation _______________________________26
5.7.1 Overview of additional functions __________________________________________________26
5.7.1.1 Power calculation function __________________________________________________26
5.7.1.2 Indication of cylinder pressure (single) versus volume_____________________________28

Contents
Page 3 of 46
5.7.1.3 Indication of all cylinder pressure (all) versus crank angle__________________________28
5.7.2 Screen page “Pcomp Balance” ____________________________________________________29
5.7.3 Screen page “IMEP”____________________________________________________________29
5.7.4 Screen page “IMEP balance” _____________________________________________________30
5.7.5 Screen page “Engine data” _______________________________________________________30
5.7.6 Screen page “Engine report” _____________________________________________________31
5.7.7 Screen page “Trending” _________________________________________________________31
6Accuracy check _______________________________________________________ 33
6.1 Connection of CPM 500 to pressure calibrator_________________________________34
6.2 Generate pressure at pressure calibrator _____________________________________35
6.3 Example of displayed CPM 500 values during pressure check ____________________36
6.4 Disconnect CPM 500 from pressure calibrator_________________________________36
7Cleaning ____________________________________________________________ 37
7.1 Periodically cleaning ______________________________________________________37
7.2 Cleaning in case of hard deposit_____________________________________________37
7.3 Cleaning procedure of adaptor______________________________________________38
7.4 Cleaning procedure of cylinder pressure sensor _______________________________38
8Basic check for fault finding ____________________________________________ 39
9Nomenclature ________________________________________________________ 40
10 Technical data________________________________________________________ 41
11 Thomson Adapter _____________________________________________________ 42
Please note:
(*) IPOWER- and IMEP calculation functionality
is only available with Dongle 620-66-002-00
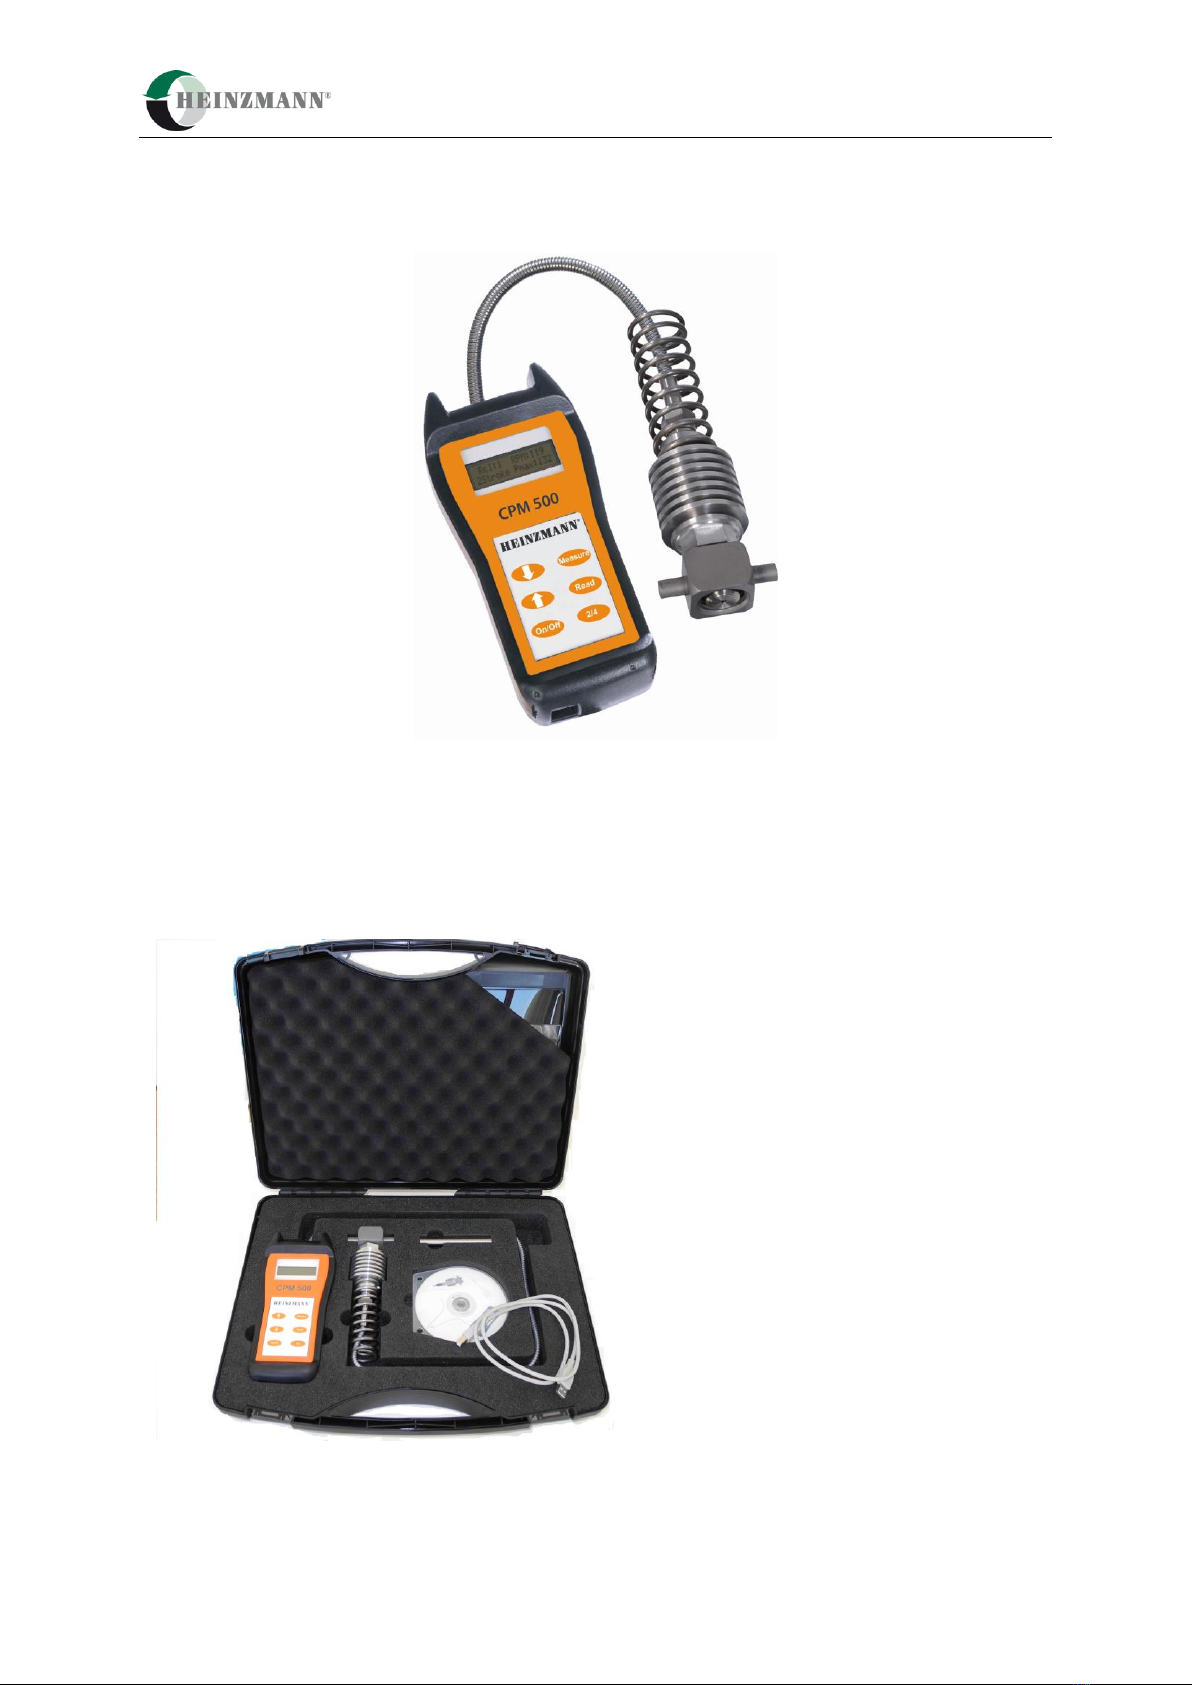
1 Scope of supply
CPM 500 Electronic Peak Pressure Indicator 4
1 Scope of supply
Fig.1: Instrument case with all components

2 Important information
CPM 500 Electronic Peak Pressure Indicator 5
2 Important information Please study this manual carefully before using the
equipment. This will ensure that you will receive maximum
benefits from using this engine performance tuning tool with
its versatile functionality and it will guarantee optimum
benefits over its lifetime.
2.1 Use of the operator manual We strongly recommend you to read the complete manual
before using the equipment. If you already have experience
with HEINZMANN systems you may only read the
relevant chapters for the required information.
It was our intention to structure this manual in a clear
layout, to enable you to get easy and instant access to the
information you are looking for. Please keep this manual in
a safe place where it is always available for easy access.
We ask for your understanding, that we will reserve the
right to change information and instructions in this manual
if necessary without giving notice in advance.

3 Description
CPM 500 Electronic Peak Pressure Indicator 6
3 Description
3.1 Introduction The electronic indicator CPM 500 is a handy, battery powered,
portable device to measure and evaluate cylinder pressure on
diesel engines at speed up to 1500 RPM.
The CPM 500 collects 10 consecutive pressure measure-
ments (cycles) and calculates peak pressure and engine
speed. The measured data are displayed in numerical format
on the LCD screen and can be stored in memory.
Up to 20 measurement data sets can be stored in the
CPM 500. The stored data can be downloaded via USB-
interface to a personal computer for evaluation.
The scope of supply includes software for Windows which
allows additional evaluation and visualization of the
collected data.
3.2 Measure functions Pmax: average maximum pressure of 10 cycles
Pcomp: compression pressure
RPM: engine speed
A complete individual pressure curve average over the 10
cycles will be stored in the CPM 500 memory with each
measurement.
3.3 Functional description The cylinder pressure will be measured with the CPM 500
unit incl. high temperature pressure sensor at the indicator
cock on marine diesel engines.
Memory : for 20 data sets
Application 2 –stroke: 40 –300 RPM
Application 4 –stroke: 200 –1500 RPM
The battery must be re-charged after approximately one
hour of continuous operation.

4 Operation
CPM 500 Electronic Peak Pressure Indicator 7
4 Operation
4.1 Operator push buttons
Remarks: After switching “On“, the CPM 500 automatically starts in 2-stroke mode. For converting to initial 4-
stroke mode, the user must connect the CPM 500 via USB cable to a powered up PC.
When connected, press “Read“ and “Measure“ simultaneously. The display starts to toggle between 4- and 2-
stroke start mode.
After display of the desired mode, immediately unhand the push buttons to store the selected start mode.
The same procedure can be used for switching from 4-stroke start mode to 2-stroke.
Fig. 2: Push buttons
Arrow up ““
Arrow down ““
On/Off
Start measurement
Read measurement
Selection of
2- or 4-stroke engine

4 Operation
CPM 500 Electronic Peak Pressure Indicator 8
4.2 Operating functions
Function
Key board
push button
Display
Notes
Switch On/Off
Basic settings will be dis-
played after switching on:
Cyl:1 = cylinder no.1
2 stroke = 2 stroke engine
4 stroke = 4 stroke engine
Pmax in bar ; RPM: speed
Selection of 2 -stroke or 4
–stroke engine
Push key “2/4“to change
the mode of operation to
the desired value (4 or 2
stroke application).
Battery check
Push key “2/4“two times
to check the battery status.
Also temperature at mea-
suring element will be dis-
played.
Sensor check
Push key “2/4“three
times to check the sensor
status at 0 bar.
Selection of cylinder
Push arrow key ““and
change the displayed value
to the number of the
selected cylinder.
Start measurement
During measurement the
following information
“Recording cylinder” will
be indicated.
Display indication (1-2 s)
of measured cylinder
values. Then CPM 500
unit automatically
switches to the next
cylinder.
Read Pmax
The measured value for
Pmax of the selected
cylinder will be displayed.
Read Pcomp (only on two
stroke engines)
Press 2x
The measured value for
Pcomp of the selected
cylinder will be displayed.
Delete measurements
+
Push “Read” and ““
at the same time for 2s to
delete the currently dis-
played measurement.

4 Operation
CPM 500 Electronic Peak Pressure Indicator 9
4.3 Installation of visualisation- and USB driver software
The scope of supply includes the HEINZMANN visualisation software on CD-ROM for displaying and
analysing the measured data in numeric and graphic format.
Hardware requirements:
IBM PC Pentium or 100 % compatible, USB port
Windows 7, XP
Main memory minimum 16 MB RAM,
Monitor with minimum resolution of 1024 x 768.
Install CD ROM on your Personal Computer. Open directory “software”and make a double click at setup.exe
for installation of visualisation- and necessary USB driver software.
The program will automatically install a new directory and places an icon on the desktop of your computer.
USB driver will be installed automatically
Press enter to finalize USB driver installation
4.4 Select COM port of PC
For selection of COM Port the CPM 500 should be
connected via USB cable to PC
Switch on CPM 500
Connect USB port of PC via USB cable to CPM 500
Run “Visualisation software“ by double click on
the desktop icon.
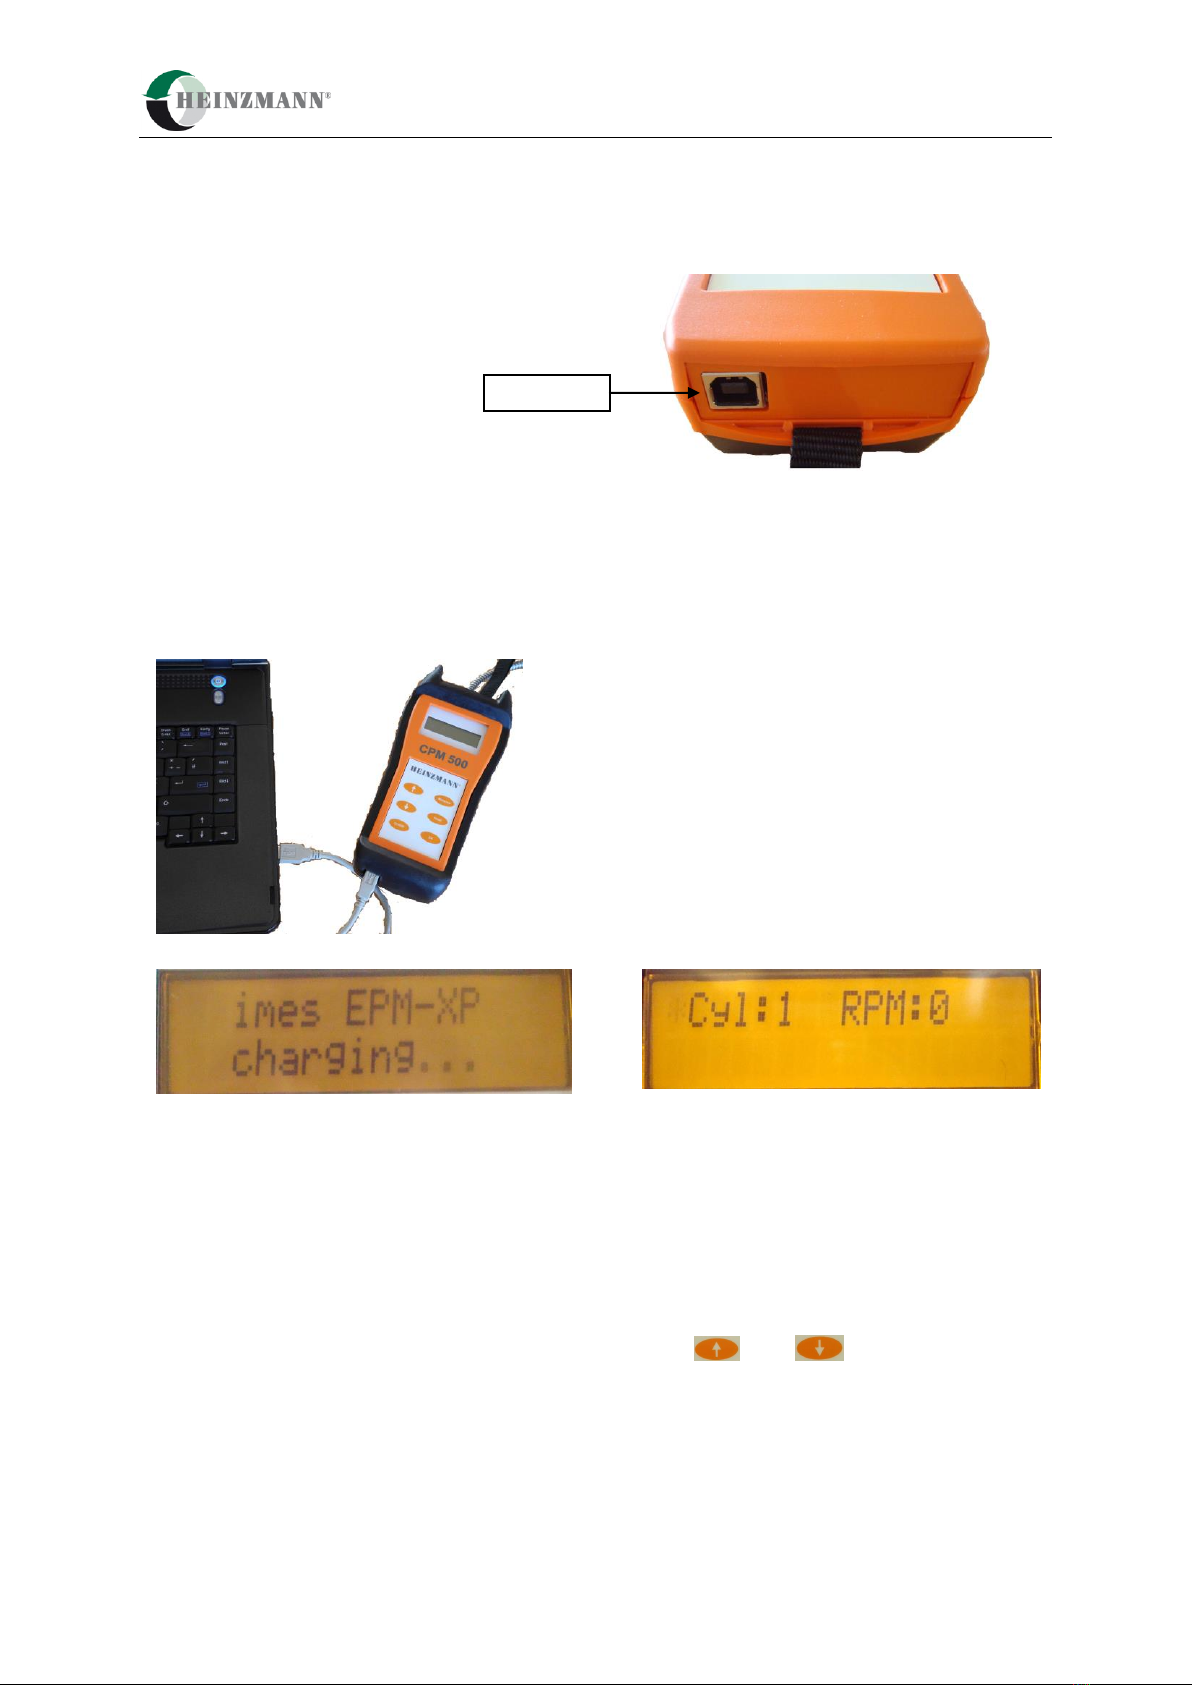
Fig.3: CPM 500 connected via USB cable to PC
For selection of COM Port the CPM 500 should be connected via USB cable to PC and visualisation software
should be started by double click on desktop icon.
With mouse click on “Tools” and selection “Interface” the COM port of PC will be selected.
4 Operation
CPM 500 Electronic Peak Pressure Indicator 10
4.5 Charge battery
The CPM 500 has a re-chargeable battery. The battery
charging will start automatically after the CPM 500 unit
has been connected via USB cable from USB port to PC
(fig. 4,5,6,7)
Fig. 4: USB-port of CPM 500
Note: At first usage please connect CPM 500 via USB cable to PC.
Charge battery for 2h continuously without disconnecting from PC !
Fig. 5: CPM 500 connected via USB cable to PC
Fig. 6: Indication during charging process Fig. 7: Indication charging process completed
Do not change battery during charging process while CPM 500 is connect via USB cable to PC.
When the indicator is connected by USB, the battery charging runs automatically. The indicator can detect the
charging status and continues charging until the battery is fully loaded. Then the charging process stops
automatically. It is not recommended to interrupt the charging process before it is automatically stopped. The
charging process is finished when the display message "CPM 500 charging..." has disappeared.
If the battery status is low and the charging process stops after 5-10 minutes, then the user can manually force
the unit to charge the battery for 90 minutes by pressing both arrows + at the CPM 500 unit
for 2 seconds (Forced Charging Mode).
Note: It is not recommended to use the Forced Charging Mode when the battery charge condition is more than
40%, due to the risk of overcharging. Please see chapter 5.2 for a description how to check the charge state.
USB port

4 Operation
CPM 500 Electronic Peak Pressure Indicator 11
4.6 Change battery
Note: Please only use re-chargeable battery E-block type “ANSMANN 250 mAh NiMH”
For changing the re-chargeable battery the battery cover on the back side of CPM 500 must be opened
(fig.9,10,11). Do not change battery during charging process while CPM 500 is connect via USB cable to PC.
Fig.8: Battery cover Fig.9: Re-chargeable E-block battery type:Ansmann
Fig.10: Battery installed on backside of CPM 500
Note: If battery of standard NiMh 250 mAh type Ansmann can not be charged or is not available, then the
operator can use for measurements Alkaline battery 9V only for a short time. In this case please immediately
disconnect the CPM 500 unit after transferring data to PC !
4.7 Mounting instructions on marine engines
Measuring at the indicator valve
Before mounting the adapter, please clean the indicator valve by opening (1-2s).
To avoid measurement distortion:
Check adaptor and sensor periodically for dirtiness and clean it if necessary.
+ Pol
The battery should only be installed by
correct pole of battery !
DANGER!
The indicator valve ejects hot gas under high
pressure. Danger of sparks and burning.
Hot gases and particles may be ejected.
Wear gloves and safety glasses!
- Pol

4 Operation
CPM 500 Electronic Peak Pressure Indicator 12
4.8 Measuring with CPM 500
Charge battery
Charging time: min. 2 hours
Start measurements on the engine
2-and 4 stroke application
Open indicator cock and close. Install sensor with adaptor at cylinder no.1 and open indicator cock
Press “On” at CPM 500
Press “Measure” and wait about 5-10 s
Fig.11: Indication during measurement on cylinder
Fig.12: Indication (1-2 s) of measured values from cylinder
After indication of measured cylinder values (1-2s) the display switches automatically to next cylinder.
Repeat measuring procedure for all remaining cylinders!
For to change engine mode 2- or 4-stroke press “2/4” to select application on a 2- or 4 stroke engine
Remark: The CPM 500 has a overheating protection of measuring cell for temperature > 300°C
Remark: The CPM 500 turns off automatically after 2 minutes without pressing any push button!
5 Visualisation software release 1.0.7.8
CPM 500 Electronic Peak Pressure Indicator 13
5 Visualisation software release 1.0.7.8
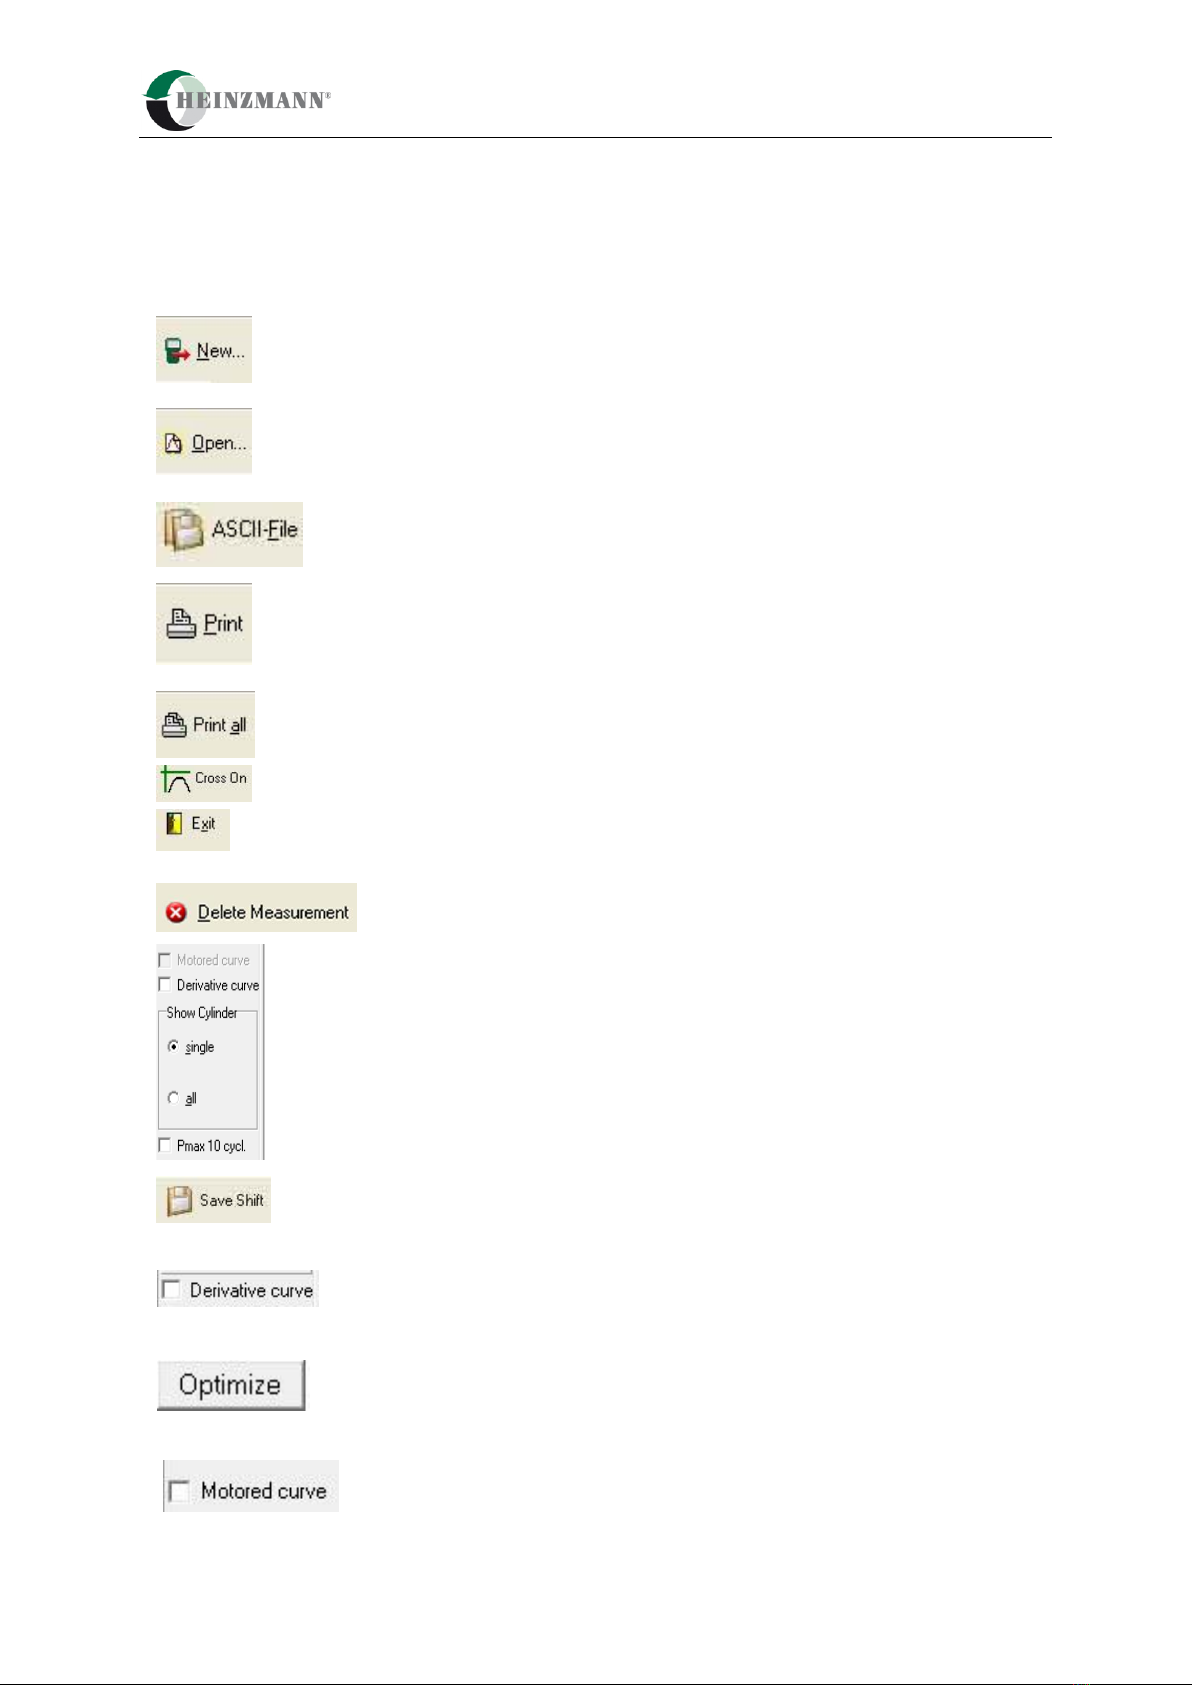
5.1 Main tool bar buttons
Load new measurement data from EPM-XP
Open stored measurement data set
Save all data to ASCII file
Print screen page
Print all screen pages
Cross On function
Program exit
Delete measurements at EPM-XP
Selection of “Motored curve “ on 4-strokes
Selection of derivative curve
Selection of all cylinder in screen page “Engine diagram”
Selection of Pmax bar graph function
Save value of shifted curves
Function “Derivative curve”
Function for optimizing Pcomp position
Function “Motored curve”
5 Visualisation software release 1.0.7.8
CPM 500 Electronic Peak Pressure Indicator 14
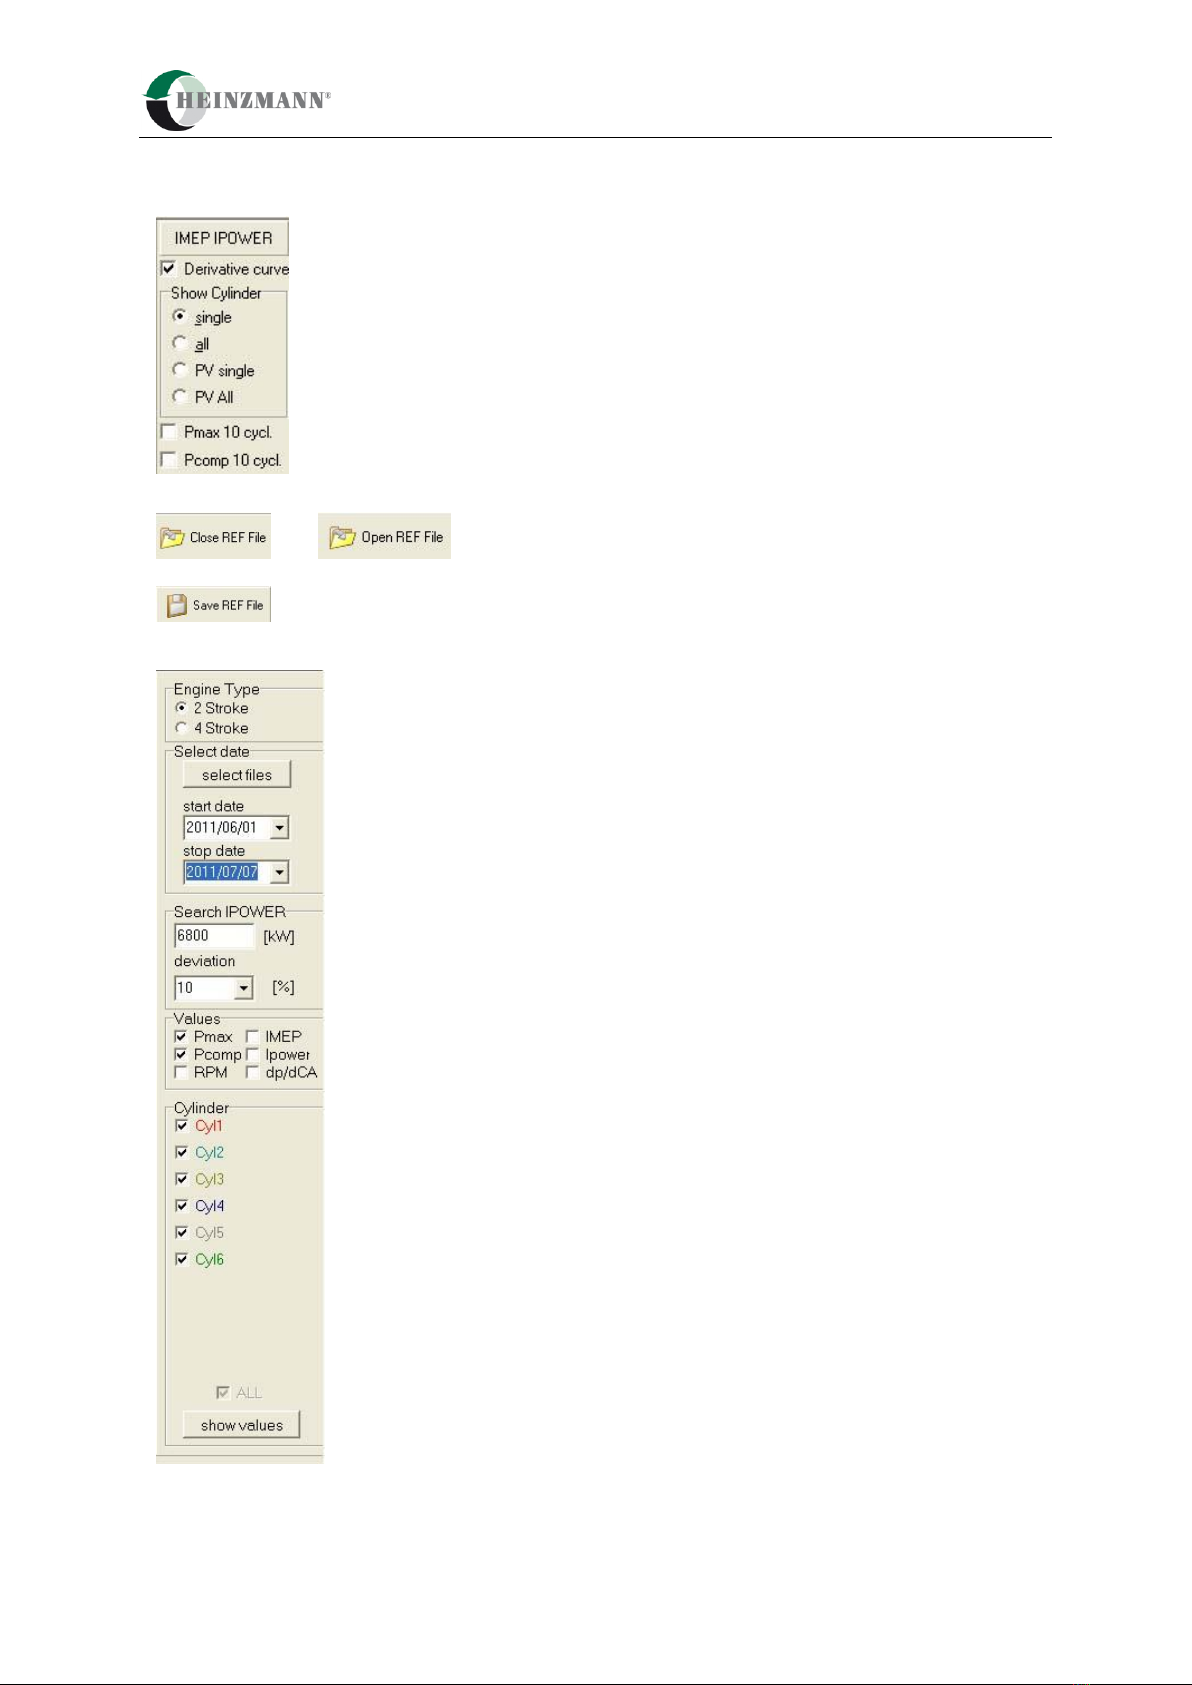
Functions for power calc. function. Only visible with Dongle 620-66-002-00
Selection window of cylinder
Derivative curve
p/alpha, p/v diagram
Indication Pmax 10 cycles
Indication of Pcomp 10 cycles (only on two strokes)
Close and open reference file
Save a reference file
Selection of engine type
Select files (*.ext format)
Select start and stop date
Input of indicated engine
power and selection deviation
in %
Selection of values
Selection of cylinder
5 Visualisation software release 1.0.7.8
CPM 500 Electronic Peak Pressure Indicator 15
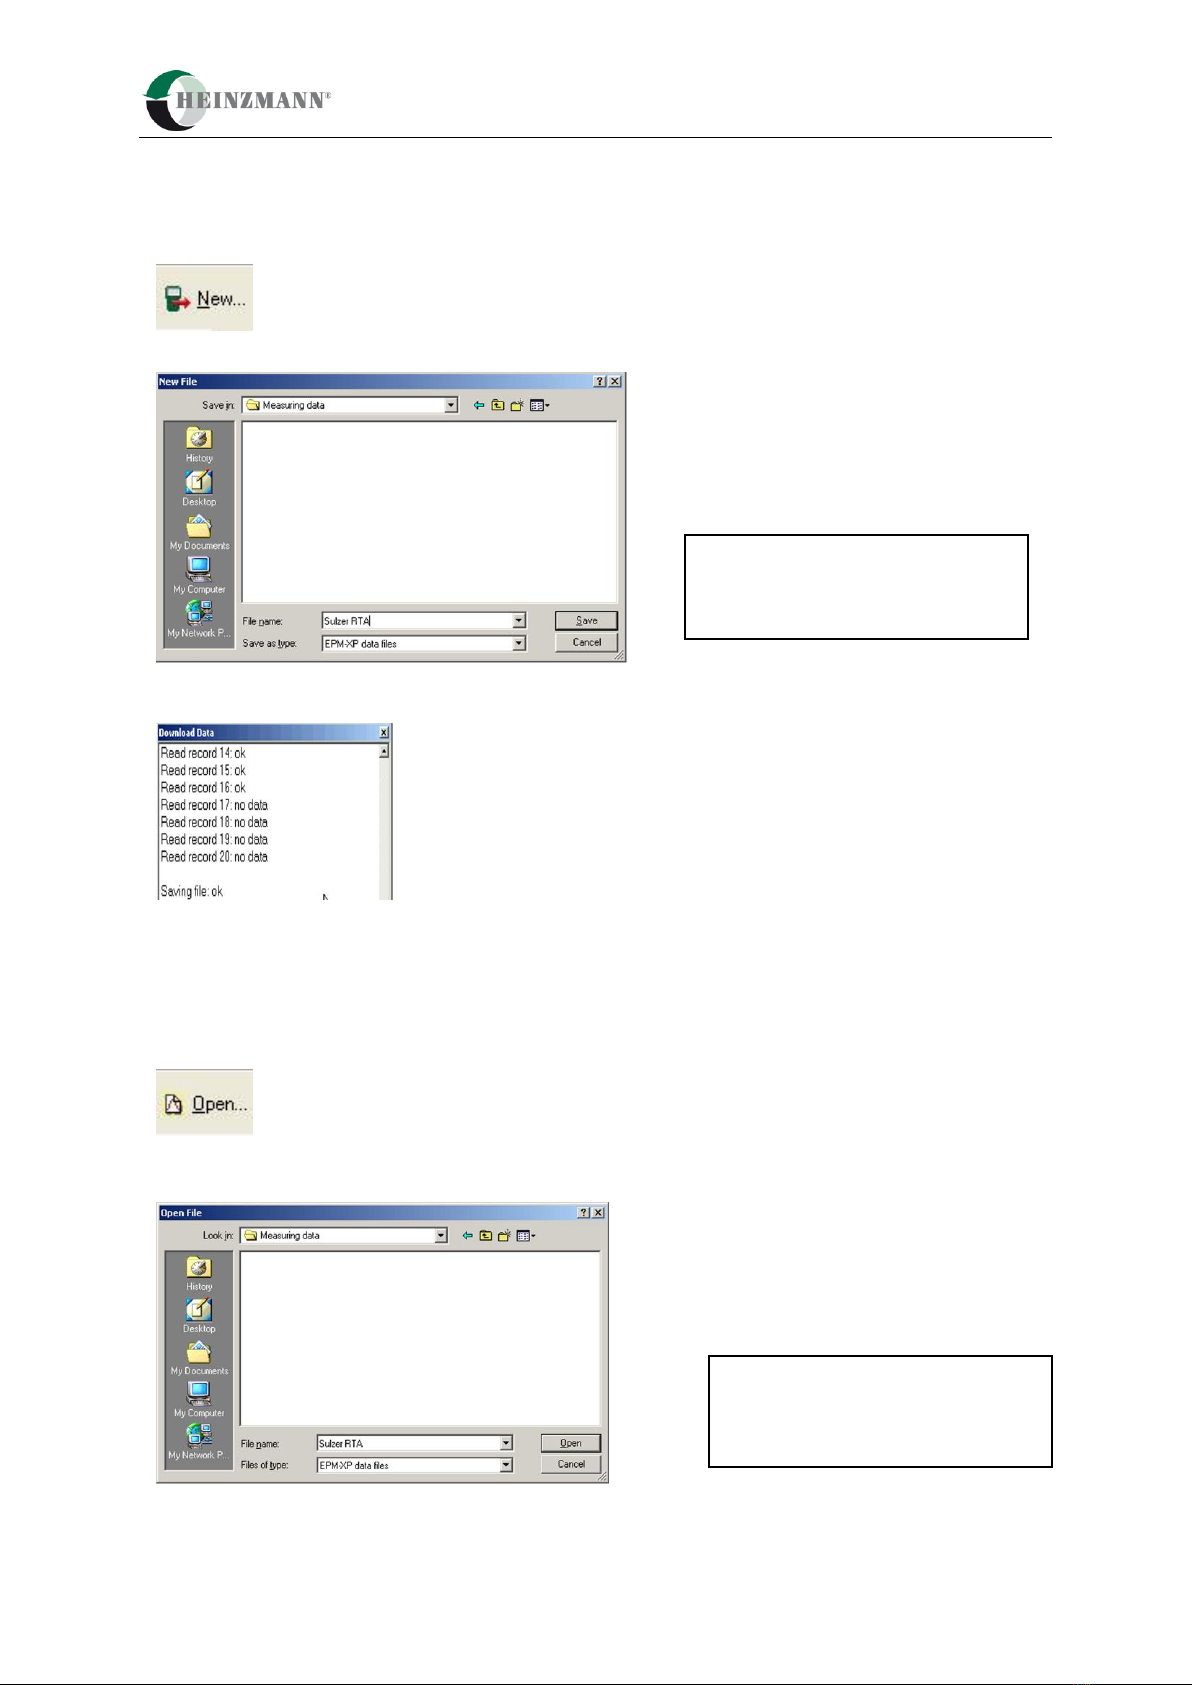
5.2 Load measured data from CPM 500 to PC
At first visualisation software must be started. CPM 500 must be connected via USB cable to PC
Press “New” to load measurement data from CPM 500 to PC
The software opens a window to name the file for storing on PC
After entering a file name and storing the data will be transmitted to PC.
After this procedure the measured data will be monitored at visualisation software.
5.3 Load measured data from hard disc to PC
At first the visualisation software must be started.
Press “Open” to load measurement data from CPM 500 to PC.
The software opened a window for to open a stored file on PC.
After this procedure the selected data file will be monitored at visualisation software.
Remark: The format of data files are
*.ext. The software release 1.0.6.0 or
higher can read and open old data
formats of *.exd
Remark: The format of data files are
*.ext. The software release 1.0.6.0 or
higher can read and open old data
formats of *.exd

5 Visualisation software release 1.0.7.8
CPM 500 Electronic Peak Pressure Indicator 16
5.4 Monitoring of combustion data
5.4.1 Screen page “Cylinder pressure curve”
5.4.1.1 Indication of all cylinders
Cylinder
selection
Indication of pressure curves of
measured cylinder 1…n.
(n = measured cylinder; max:20)
Indication of
Pmax diagram
Indication of
Engine Report
Indication of
Pmax Balancing
Motored curve
Derivative curve
Indication of all measured
curves overlapped or single
cylinder selection
Remark field
Field „Engine data“
Selection of scav. air
pressure
Pmax bargraph diagram
10 cycles
Arrow function to shift
curves with 0.1 resolution
on 2 strokes.
On 4-strokes shift curves
with 0.5 resolution.
“Optimize“ function“

5 Visualisation software release 1.0.7.8
CPM 500 Electronic Peak Pressure Indicator 17
Zoom-function
Zoom function on: Hold left mouse button pushed down and draw across the curve from top left down to
right bottom corner.
Zoom function off: Hold left mouse button pushed down and draw across the curve from right bottom up
to top left corner.
5.4.1.2 Cross On function
Cross On: Push with mouse “Cross On” button and move mouse to the position of curve
Cross Off: Push with mouse “Cross Off” button
Indication of pressure
[bar] and crank angle
position [CA]

5 Visualisation software release 1.0.7.8
CPM 500 Electronic Peak Pressure Indicator 18
5.4.1.3 Save to ASCII
Press “ASCII-File” to save all measurement data to Excel (*.csv) files.
The software opened a window to store data to (*.csv) files.
5.4.1.4 Optimize function for application on two-strokes
IMES algorithm for automatic Pcomp position calculation on two-strokes can be influenced by some noises on
the pressure signal. If Pcomp Position is not exact centred on TDC position than please press button
“OPTIMIZE”
Remarks: Optimum Pcomp position influences also IPOWER and IMEP calculation for application with dongle
620-66-002-00!
1. Check all curves
Some curves should be
checked for optimum
position of Pcomp !

5 Visualisation software release 1.0.7.8
CPM 500 Electronic Peak Pressure Indicator 19
2. Check lowest position of derivative curve
3. Shift curve into optimum pos. of Pcomp by pressing button “Optimize”. All incorrect curves are shifted
automatically into optimum position of Pcomp.
4. All curves shifted
Lowest point of
derivative curve
is before TDC!
Curve shifted into
optimized Pcomp position
Derivative curve
Select „Derivative curve“

5 Visualisation software release 1.0.7.8
CPM 500 Electronic Peak Pressure Indicator 20
5.4.1.5 Save Shift
After shifting curves the operator has the possibility to save shifted data as *.ext file under new name.
All curves shifted into
optimum Pcomp position
Table of contents


