IFR NAVAIR NAV-750 User manual

ME~
REV]
N
N
TECHNICAL
MANUAL
c~Jr,
2
I
INSTRUMENT
CALIBRATION
PROCEDURE
VOR/LOCICOMM
AND
G/S
BENCH
TEST SETS
IFR
INC.
NAV-750,
NAV-750A,
AND NAV-750B
DISTRIBUTION
WITHIN GIDEP
IS
AUTHORIZED
BY
NAVAL
WEAPONS
STATION,
SEAL
BEACH
LETTER,
SER
313/0994
DATED
14
MAY
1987
THIS
PUBLICATION
SUPERSEDES
NAVAIR
17—2OAX—737
DATED
1
JULY
1991
DISTRIBUTION
STATEMENT
C.
DISTRIBUTION
AUTHORIZED
TO
U.S.
GOVERNMENT
AGENCIES
AND
THEIR
CONTRACTORS
TO
PROTECT
PUBLICATIONS
REQUIRED
FOR
OFFICIAL
USE
OR
FOR
ADMINISTRATIVE
OROPERATIONAL
PURPOSES
ONLY.
OTHER
REQUESTS
FOR
THIS
DOCUMENT
SHALL
BE
REFERRED
TO
NAVY
MEASUREMENT
SCIENCEDIRECTORATE,
NAVAL
WARFARE
ASSESSMENT
DIVISION,
P0.
BOX
5000
CORONA.
CA
91718-5000
DESTRUCTION
NOTICE-
FORUNCLASSIFIED,
LIMITED
DOCUMENTS,
DESTROY
BY
ANY
METHOD
THAT
WILL
PREVENTDISCLOSURE
OF
CONTENTS
OR
“RECONSTRUCTION
OF
THE
DOCUMENT”
PUBLISHED
BY
DIRECTION OF
COMMANDER
NAVAL
AIR
SYSTEMS
COMMAND
1
AUGUST
1995
[BUL
This
document
has
been
modified
primarily
for
the
purpose
of
incorporating
changes
[SION
previously
identified
in
the
Metrology Bulletin
(METBUL)
as
unpublished
procedure
[‘ICE
changes.
NAVAIR
17-2OAX-737

Section
3
4
4.1
4.2
4.3
4.4
4.5
4.6
4.7
4.8
4.9
4.10
4.11
4.12
4.13
4.14
4.15
TABLE
OF CONTENTS
NAVAIR
17—2OAX—737
Page
1
4
6
7
7
8
9
10
11
14
15
18
18
19
20
20
22
24
27
29
1
Introduction
and
Description
Equipment
Requirements
Preliminary
Operations
Calibration
Process
Frequency
Accuracy
Tests
Attenuator
FrequencyResponse
Tests
Attenuator
Line
aritv
Tests
DEMOD
Tones
and DC
OFFSET
Tests
Tone
Frequency
Tests
Tone
Distortion
Tests
Percent
Amplitude
Modulation
ofTones and
ModulationMeter
Tests
RF
Level
Meter
Tests
VOR
Bearing
Tests
LOC
Centering
Test
GIS
Centering
Test
Spectral
Purity
Tests
(NAV—750
only)
Spectral
Purity
Tests
(NAV—750A
only)
Spectral
Purity
Tests
(NAV—750B
only)
Residual
FM
Tests
Navy
Calibration
Checklist
ILLUSTRATIONS
Page
FM
Deviation
Display
12
9960
Hz
Deviation
(Expanded)
13
TABLES
Page
Calibration
Description
Figure
1
2
Table
1

NAVAIR
17—2OAX—737
SECTION
1
INTRODUCTIONAND
DESCRIPTION
1.1
This
procedure
describes
the
calibration
of
IFR
Inc.
NAV—750,
NAV—750A,
NAV—750B
VOR/LOC/COMM
and
G/S
Bench
Test
Sets.
The
instrument
being
calibrated
is
referred
to
herein
as
the
TI (Test
Instrument).
1.2
This
procedure
wasderived
from
draft
prepared
by
NADEP
Cherry
Point.
All
comments
concerning
this
procedure
should
be
directed
to
Navy
Measurement
Science
Directorate,
Naval
Warfare
Assessment
Division,
P.O.
Box 5000,
Corona,
CA
91718—5000.
1.3
This
procedure
includes
tests
of
essentialperformance
parameters
only. Any
malfunctionnoticed
duringcalibration,
whether
specifically
tested
for
or not,
should
be
corrected.
DEMOD
tones
DC
offset
Frequency
range:
108.000
to
335.000
MI-Iz;
(70.000
to
79.000,
NAV—750B
only)
Tolerance:
±1
ppm
Range:
70.0
MHz
to
335.0
MHz
Tolerance:
±1.5
dB
@
—6
dBm
to
-50
dBm;
±2.5
dB
@
-51
dBm
to
—120
dBm
Range:
—6
to
—50
dBm
Tolerance:
±1.5
dB
Range:
—51
to
—120
dBm
Tolerance:
±2.5
dB
Tone
frequencies:
30, 90,
150,
1020,
and
9960
Hz
DC
offset: +40 mV
to
—40
mV dc
Tone
Frequencies:
400,
1300,
and
3000
Hz
DC
offset: +80 mV
to
—80
mV dc
Tone
frequencies:
30,
90,
150,
and
9960
Hz
Tolerance:
±0.02%
Tone
frequency:
1020
Hz
Tolerance:
±0.5%
Tone
frequencies:
400,
1300,
and
3000
Hz
Tolerance:
±0.7%
Tone
frequencies:
90
and
150
Hz
Tolerance:
±0.4%
Tone
frequencies:
30
and
1020
Hz
Tolerance:
±0.5%
Tone
frequencies:
400,
1300,
and
3000
Hz
Tolerance:
±0.7%
Measured
with
an
electronic
counter.
Attenuatoroutput
monitored
by
a
power
meter
while
the
frequency
is
verified.
Attenuatoroutput
measured
with
a
signal
analyzer.
Offset
measured
using
a
digital
multimeter.
Measured
with
an
electronic
counter.
Table
1.
Calibration
Description
TI
Characteristics
Performance
Specifications
Test
Method
Frequency
accuracy
Attenuator
frequency
response
Attenuator
linearity
Tone
frequency
Tone
distortion
Measured
with
a
signal
analyzer.
1

NAVAIR
11—2OAX—737
Harmonic
spurious
noise
VOR
30
Hz: 20% AM
Tolerance:
±1.2%
VOR
9960
Hz: 30% AM
Tolerance:
±1.2%
LOC
90
Hz: 20% AM
Tolerance:
±0.8%
LOC
150
Hz: 20% AM
Tolerance:
±0.8%
G/S
90
Hz: 40%
AM
Tolerance:
±1.6%
G/S
150
Hz: 40% AM
Tolerance:
±1.6%
Comm
1020
Hz: 30% AM
Tolerance:
±1.2%
Range:
0 to 30% AM
Tolerance:
@
20%,
±0.8%;
@
30%,
±1.2%
Range:
0
to
100%
AM
Tolerance:
@
40%,
±1.6%;
@
95%,
±3.0%
Frequency
range:
108.000
to
335.000
MHz;
(70.000
to
79.000
MHz,
NAV—750B
only)
Tolerance:
±1.5
needle widths
Bearing
range:
00 to
360°
Tolerance:
±0.05%
Tone
frequencies:
90
and
150
Hz
Tolerance:
±2.75
mV
>30 dBc
from
108.000
to
335.000
MHz;
(>20
dBc
from
70.000
to
79.000
MHz,
NAV—750B
only)
NAV—750
only
Frequency:
108.000
MHz
Tolerance:
>68 dB
below
carrier
@
±12.5
kHz, and ~71
dB
below
carrier
~
±25.0
kHz
in
300
Hz
resolution
bandwidth
Frequency:
334.700
MHz
Tolerance:
~63
dB
below
carrier
@
±12.5
kHz,
and
74
dB
below
carrier
@
±15.0
kHz
in
300
Hz
resolutionbandwidth
Modulation
meter
indication
is
compared
to
signal
generator
calibrator
indication.
Frequency
varied
and
meter
monitored
for
deflection.
Compared
to
a
bearing
standard.
Measured
with
a digital
multimeter.
Measured
with
a
spectrum
analyzer.
Measured
with
a
spectrum
analyzer.
TI
Characteristics
Performance
Specifications
Test
Method
Measured
with
a
signal
analyzer.
Tone
modulation
Modulation
meter
Meter
RF
level
Bearing
LOC-G/S
Harmonics
2

NAVAIR
17—2OAX—737
Frequency:
108.000
MHz
Tolerance:
75
dB
below
carrier
@
±12.5
kHz,
and
~83
dB
below
carrier
@
±25.0
kHz
in
300
Hz
resolutionbandwidth
NAV-750Aonly
Frequency:
334.700
MHz
Tolerance:
66
dB
below
carrier
@
±12.5
kHz,
and
77
dB
below
carrier
@
±25.0
kHz
in
300
Hz
resolutionbandwidth
NAV—750B
only
Frequency:
334.700
MHz
Tolerance:
>75
dB
below
carrier
@
±12.5
kHz,
and
~83 dB
below
carrier
@
±25.0
kHz
in
300
Hz
resolution
bandwidth
NAV—750
only
Frequency:
108.000
MHz
Tolerance:
14
dB
below
carrier
@
±20
kHz
in
300
Hz
resolutionbandwidth
Frequency:
334.700
MHz
Tolerance:
68
dB
below
carrier
@
±20
kHz
in
300
Hz
resolutionbandwidth
NAV-750A
and
NAV-750B
Frequency:
108.000
MHz
Tolerance:
~78 dB
below
carrier
@
±15
kHz
in
300
Hz
resolution
bandwidth
Frequency:
334.700
MHz
Tolerance:
>74
dB
below
carrier
@
±20
kHz
in
300
Hz
resolutionbandwidth
NAV-750Aonly
Frequency:
130.000
MHz
Tolerance:
.78
dB
below
carrier
@
±15
kHz
in
300
Hz
resolutionbandwidth
NAV-750and
NAV-750B
Frequency:
108.000
MHz
Tolerance:
~80
dB
below
carrier
@
±100
kHz
in
1
kHz
resolutionbandwidth
TI
Characteristics
Performance
Specifications
Test
Method
NAV-750A
and
NAV-750B
Single—sideband
noise
Broadband
noise
Measured
with
a
spectrum
analyzer.
Measured
with
a
spectrum
analyzer.
3

NAVAIR
17—2OAX—737
TI
Characteristics
Performance
Specifications
Test
Method
NAV-750
and
NAV-750B
Frequency:
334.000
MHz
Tolerance:
>80
dB
below
carrier
@
±100
kHz
in
1
kHz
resolutionbandwidth
NAV—750A
only
Frequency:
108.000
MHz
Tolerance:
>82dB
below
carrier
@
±100
kHz
in
1
kHz
resolutionbandwidth
Frequency:
334.000
MHz
Tolerance:
>82
dB
below
carrier
@
±100
kHz
in
1
kHz
resolutionbandwidth
Residual
FM
Frequency:
108.000
MHz
Residual
FM: ~200
Hz
Frequency:
334.700
MHz
Residual
FM:
~.400
Hz
Measured
with
a
signal
generator
RF
Type
N
Centerconnector
depthrange:
Measured
using
a
connector
connector
dimensions
0.197 inch
Tolerance:
±0.01
inch
(MIL—C—71B)
gage
kit
SECTION
2
EQUIPMENT
REQUIREMENTS
NOTE
Minimum
use
specifications
are
the
principal
parameters
requiredfor
performance
of
the
calibration,
and
are
included
to
assist
in the
selection
of
alternateequipment,
which maybe
used
at the
discretion
ofthe
using
laboratory. Satisfactory
performance
of
alternate
items
shall
be
verified
prior
to
use.
All
applicable
equipment
must
bear
evidence
of
current
calibration.
Theinstruments
utilized
in this
procedure
were
selected
from those
known
to
be
available
at
Navy
calibration
facilities,
and
the listing
by
make
or
model
number
carries
no
implication
of
preference,
recommendation,
or
approvalfor
use
by
other
agencies.
It is
recognized
that
equivalentequipmentproduced
by
other
manufacturers
may be
capable
of
equally
satisfactory
performance
in this
procedure.
I
4

NAVAIR
17—2OAX—737
2.2
Electronic
counter
2.3
Digital
multimeter
(DMM)
2.4
Power
meter/power
sensor
2.5
Signal
generator
calibrator
2.7
Navigation
indicator
T/S
2.8
Spectrum
analyzer
2.9
Connector
gage
kit
*Non_NCE
equipment
Bandwidth:
50
MHz
Uncertainty:
±3%
timebase
Dualtrace
and
delayed
sweep
capability
Frequency
range:
25
Hz
to
335
MHz
Uncertainty:
±0.25
ppm
Resolution:
1
Hz
DC
voltage
range:
0
to
±80
mV dc
Uncertainty:
±1%
Powerrange:
—25
to
—35
dBm
Uncertainty:
±1.25%
Frequency
range:
70
to
335
MHz
Frequency
range:
108
to
118
MHz
Tuned
RF
level
rang:
e—6
to
—100
dBm
Uncertainty:
±0.35
dB
AM modulation
range:
15%
to
100% AM
Uncertainty:
±1%
AM
FM
modulation
range:
<200
Hz
to
400
Hz
FM
Uncertainty:
±2%
Capable
of
measuringdistortion
down
to
0.1%
with
0.01%
resolution
No
known
substitute
Range:
50
MHz
to
1.2
GHz
Resolution:
300
Hz
mm
Dynamic
range:
>85
dB
Range:
0
to
0.197 inch
Uncertainty:
±0.0025
inch
(MIL—C--71B)
Tektronix
7704AM0D
1
29GOPTO3,
7904AOPT03
or
7704AM0D129G
with
7A26
and
7B92A
plug—ins
Hewlett—Packard
5335A0PT010,
030,
040,
5345A0PT012,
or 5345A
Fluke
8SO6AAN,
8502AAT,
or
884OAAFOPTO5
Hewlett—Packard
436A0PT022,
436A, or
435A
with
8484A
Hewlett—Packard
8902A0PTE02
(consists
of:
H-P
8902A0PT002;
and
H—P
11722A) or
8902A0PTE04
(consists
of:
H—P8902A;
H—P
8672AOPT001,
008;
H—P
11792A0PT001,H04;
and
H—P
1
1793A0PTH04)
Sound
Technology
1700BOPTOO3, 005;
or
Hewlett—Packard
8903B0PT050,
907, 910,
or
8903BOPT907
Collins
478A—3
ZIFOR
111*
Hewlett—Packard
8562A0PTE50,
8569BOPT001,
or 8566B
Maury
Microwave
AOO7B,
AOO7A
2.1
Oscilloscope
Item
Minimum
Use
Specifications
Calibration
Equipment
2.6
Distortion
analyzer
5

NAVAIR
17—2OAX--737
SECTION
3
PRELIMINARY
OPERATIONS
3.1
Ensure
that
all
power
switches
are set
to
off,
and
set
all
auxiliary
equipment
controls
as
necessary
to
avoid
damage
to
the
equipment
and
so that
dangerous
voltages
will
not
be
present
on
output
terminals
when
the
power
switches
are
turned
on.
3.2
Connect
the
auxiliary
equipment,
and
theTI,
to
theappropriatepower
source.
3.3
Verify
that
the
TI
panel
meter
indicateszero.
If
the
TI
meter
does
not
indicate
zero,
adjustthe
TI
meter
mechanical
screw
adjustment
for
a
zero
scale indication. (Perform
adjustment
only
after
TI has
been
off for
at
least
30
minutes.)
3.4
Setthe
TI
controls
as
follows:
TO—FROM
bearing
switch
to
Meter
function
switch
to
MASTER
MOD
control
to
1020
Hz
indent
tone
MOD
control
to
9960
Hz
FM
tone
MOD
control
to
30
Hz
tone
MOD
control
to
.01—.05
degree
bearing
switch
to
LOC
DDM
switch
to
LOC
variable
DDM
control
to
LOC—GIS
frequency
switch
to
G/S
DDM
switch
to
G/S
variable
DDM
control
to
FREQUENCY
MHz
switches
to
Channeling
frequencyincrement
switch
to
AUTO-MANUAL
switch
to
CHANNELING
rate
control
to
~F
control
to
BEARING—FREQ
display
select
switch
to
Attenuator
control
to
FROM
0—100
or
OFF
CAL
(UNCAL
lamp
off)
CAL
(UNCAL
lamp
off)
CAL
(UNCAL
lamp
off)
CAL
(UNCAL
lamp
off)
.01
0
0
LOC
0
0
108.000
25
kHz
MANUAL
fully
ccw
fully
ccw
FREQ
-3OdBm
3.5
Turn
all
power
switches
on,
and
allow a
sufficient
warm—up
time
forthe
equipment
(the
TI
requires
a
1
hour
warm—up
time).
3.6
Using
connector
gage
kit
(item
2.9),
ensure
the
TI
RF
connector
complies
with
specifications
of
MIL—C—71B.
6

NAVAIR
17—2OAX—737
SECTION
4
CALIBRATION
PROCESS
NOTE
Unless
otherwise
specified,
verify
the
results
of
each
test
and
take
corrective
action
whenever
the
test
requirement
is
not
met,before
proceeding.
4.1
FREQUENCY
ACCURACY
TESTS
4.1.1
Set the TI
controls
as
follows:
FREQUENCY
MHz
switches
to
108.000
MASTER
MOD
control
to
UNCAL
[fully
ccw
(0)]
Output
attenuator
control
to
—20
dBm
4.1.2
Ensure
that
the
TI
0
LOCK
indicator
is
on.
4.1.3
Connect
the
electronic
counter
to
the
TI
RF
output
connector,and
set
the
electronic
counter
for
frequency
measurements,
as
necessary.
4.1.4
Adjust
the TI
output
attenuator
control,
if
necessary,
to
obtain
a
stable
electronic
counter
indication.
(Repeat
this
step,
if
necessary,
for
the
following
tests
of
the
TI
frequency
accuracy.)
4.1.5
Verify
that
the
electronic
counter
indicates
between
107.999892
and
108.000108
MHz.
4.1.6
Set
the TI
FREQUENCY
MHz
switches
to
130.000,
and
verify
that
the
electronic
counter
indicates
between
129.999870
and
130.000130
MHz.
4.1.7
Setthe
TI
FREQUENCY
MHz
switches
to
157.000,
and
verify
that
the
electronic
counter
indicates
between
156.999843
and
157.000157
MHz.
4.1.8
Set
the TI
FREQUENCY
MHz
switches
to
328.000,
and
verify
that
the
electronic
counter
indicates
between
327.999672
and
328.000328
MHz.
4.1.9
Set
the TI
FREQUENCY
MHz
switches
to
335.000,
and
verify
that
the
electronic
counter
indicates
between
334.999665
and
335.000335
MHz.
4.1.10
If
the
TI is a
NAV—750B,
proceed
with
step
4.1.11.
Otherwise,
if
the
TI is
not
a
NAV—750B,
skip
to
step
4.1.13.
4.1.11
Set
the TI
FREQUENCY
MHz
switches
to
070.000,
and
verify
that
the
electronic
counter
indicates
between
69.999930
and
70.000070
MHz.
4.1.12
Set
the TI
FREQUENCY
MHz
switches
to
079.000,
and
verify
that
the
electronic
counter
indicates
between
78.999921
and
79.000079 MHz.
4.1.13
Disconnect
the
electronic
counter
from
theTI.
7

NAVAIR
17—2OAX—737
4.2
ATI’ENUATOR
FREQUENCY
RESPONSE
TESTS
4.2.1
Connect
the
power
sensor
to
the
powermeter.
Zero
and
reference
calibrate
the
power
sensorand
powermeter.
4.2.2
Set the
TI
attenuator
to
—30
dBm.
and
the
TI
frequency
switches
to
108
MHz.
Connect
the power
sensor
input
to
the
TI
RF
output
connector.
4.2.3
Set
the
power
meter
controls
for
auto
ranging
or
—25
dBm
range,
as
applicable.
NOTE
For
that
following
tests,
set
the
power
meter
calibration
factor
switch
to the
appropriate
setting
corresponding
to the
power
sensor
cal
chart
at
the
test
frequency
(TI
FREQUENCY
MHz
switchessetting).
4.2.4
Verify
that
thepowermeter
indicates
between
—28.5
and—31.5
dBm.
4.2.5
Setthe
TI
FREQUENCY
MHz
switches
to
the
followingsettings.
At
each
setting,
verify
that
the
power
meter
indicates
within
the
tolerance
limits
listed.
TI
FREQUENCY
MHz
Switch
Setting
Power
Meter
Tolerance
Limits
(dBm)
115.000
125.000
135.000
145.000
157.000
—28.5
to
—31.5
“
“
“
“
4.2.6
Setthe
TI
FREQUENCY
MHz
switches
to
328.000.
4.2.7
Verify
that
the
TI
G/S
Mode
indicator
is
on,
and
that
thepowermeter
indicates
between
—28.5
and
—31.5
dBm.
4.2.8
Set
the
TI
FREQUENCY
MHz
switches
to the
following
settings.
At
each
setting,
verify
that
the
power
meter
indicates
within
the tolerance
limitslisted.
TI
FREQUENCY
MHz
Switch
Setting
Power
Meter
Tolerance
Limits
(dBm)
330.000
332.000
335.000
—28.5
to
—31.5
“
“
4.2.9
If
the
TI
is
a
NAV—750B
continue
with
step
4.2.10.
Otherwise,
if
the
TI
is
not
a
NAV—750B,
proceed
to step
4.2.13.
4.2.10
Set the
TI
FREQUENCY
MHz
switches
to
70.000.
4.2.11 Verify
that
thepowermeter
indicates
between
—28.5
to
—31.5
dBm.
8

NAVAIR
17—2OAX—737
4.2.12
Setthe
TI
FREQUENCY
MHz
switches
to
the
followingsettings.
At
each
setting,
verify
that
the
power meter
indicates
within
thetolerance
limits
listed.
TI
FREQUENCY
MHz
Switch
Setting
Power
Meter
Tolerance
Limits
(dBm)
072.000
074.000
076.000
079.000
—28.5
to
—31.5
“
“
“
4.2.13
Disconnect
thepower
sensor
from
the
TI.
4.3
ATTENUATOR
LINEARITY
TESTS
4.3.1
Set
the
TI
controls
as
follows:
FREQUENCY
MHz
switches
to
MASTER
MOD
control
to
108.000
MHz
UNCAL
[fully
ccw
(0)]
Output
attenuator
control
to
-6
dBm
4.3.2
Connect
the
signal
generator
calibratorsensor
module
input
to
the
TI
RF
output
connector.
4.3.3
Press the
signal
generator
calibratorINSTR
PRESET
key
(Blue
key,
AUTOMATIC
OPERATION
key),
and
ensure
that
the
signal
generator
calibrator
is in
the
FREQ
measurement
mode
and
tunes
to
the
TI
FREQUENCY
MHz
switches
setting.
Setthe
signal
generatorcalibrator
for
TUNED
RF
LEVEL
measurements
with
log
(dBm)
display,
enter
39.9
SPCL,
and
then
press
the
CALIBRATE
key.
4.3.4
Set
the
TI
outputattenuator
control
to
each
of
the
followingsettings.
At
each
setting,
verify
that
the
signal
generator
calibrator
indicates
within
thetolerance
limits
listed.
TI
Output
Attenuator
Control
Setting
Signal
Generator
Calibrator
Tolerance
Limits
(dBm)
—6
—4.5
to
—7.5
—10
—8.5
to
—11.5
—20
—18.5
to
—21.5
—30
—28.5
to
—31.5
—40
—38.5
to
—41.5
—50
—48.5
to
—51.5
—60
—57.5
to
—62.5
—70
—67.5
to
—72.5
—80
—77.5
to
—82.5
—90
—87.5
to
—92.5
—100
—97.5
to
—102.5
4.3.5
Disconnect
the
signal
generator
calibratorsensor
module
from
theTI.
9
NAVAIR
17—2OAX—737
4.4
DEMOD
TONES
AND
DC
OFFSET
TESTS
4.4.1
Set the
TI
controls
as
follows:
BEARING-FREQ
switch
to
FREQ
MASTER
MOD
control
to CAL
(UNCAL
lamp off)
1020
Hz
indent
tone
MOD
control
to
CAL
(UNCAL
lamp off)
9960
Hz
FM
tone
MOD
control
to
CAL
(UNCAL
lamp
off)
30
Hz
tone
MOD
control
to
CAL
(UNCAL
lamp
off)
LOC
DDM
switch
to
0
G/S
DDM
switch
to
0
4.4.2
Connect
the
oscilloscope
vertical
amplifierinput
to
the
TI
rear
panel
DEMOD
jack.
Connect
the
DMM
voltage
input
to
the
TI
rear
panel
TONES
jack.
4.4.3
Set
the TI
oscilloscope
and
DMM
controls
as
necessary
to
measure
the
TI
signals
in the following
steps:
4.4.3.1
Setthe
TI
FREQUENCY
MHz
switches
to
108.100
MHz.
Ensure
that
the
TI
frequency
display
indicates
108.100,
and
the
LOC
mode
indicator
is on.
4.4.3.2
Set
the
TI
G/S
DDM
switch
to
90
Hz,
and
ensure
that
the
150
Hz
tone
offindicator
ison.
4.4.3.3 Verify
that
the
oscilloscope
displays
a
90
Hz
tone,
and
that
the
DMM
indicates
between
—40.0
and
+40.0
mV
dc.
4.4.3.4
Set
the
TI
LOC—G/S
frequency
switch
to
G/S.
4.4.3.5
Ensure
that
the
TI
frequency
display
indicates
334.700,
and
the G/S
mode
indicator
is
on.
4.4.3.6
Verify
that
the
oscilloscope
displays
a
90
Hz
tone,
and
that
the
DMM
indicates
between
—40.0
and
+40.0
mV dc.
4.4.3.7
Set the TI G/S
DDM
switch
to
150
Hz,
and
then
ensure
that
the
90
Hz
tone
offindicator
is
on.
4.4.3.8 Verify
that
the
oscilloscope
displays
a
150
Hz
tone,
and
that
the
DMM
indicates
between
—40
to
÷4OmVdc.
4.4.3.9
Set
the
TI
LOC—G/S
frequency
switch
to
LOC.
4.4.3.10
Ensure
that
the
TI
frequency
display
indicates
108.100,
the
90Hz
tone
offindicator
is on, and the
LOC
mode
indicator
is on.
4.4.3.11
Verify
that
the
oscilloscope
displays
a
150
Hz
tone,
and
that
the
DMM
indicates
between
—40
to
+4OmVdc.
4.4.3.12 Set the
TI
G/S
DDM
switch
to 0, and
the FREQUENCY
MHz
switches
to
108.000.
4.4.3.13
Ensure
that
the
TI
VOR
mode
indicator
is
on.
4.4.3.14
Verify
that
the
oscilloscope
displays a
9960
Hz
tone,
and
that
the
tone
is
both
frequency
and
amplitudemodulated
with
a
30
Hz
tone.
10

NAVAIR
17—2OAX—737
4.4.3.15
Verify
that
the
DMM
indicates
between
—40.0
and
+
40.0 mV dc.
4.4.3.16
Adjust
the
TI
9960
FM
tone modulation
controltoUNCAL
[fully
ccw
(0)].
4.4.3.17
Verify
that
the
oscilloscope
displays a
30
Hz
tone,
and
that
the
DMM
indicates
between
—40.0
and
+40.0
mV dc.
4.4.3.18 Set the
TI
9960
Hz
tone modulation
control
to the
CAL
(UNCAL
lamp
off)
position,
and
set the
FREQUENCY
MHz
switches
to
118.000.
4.4.3.19
Verify
that
the
oscilloscope
displays
a
1020
Hz
tone,
and
that
the
DMM
indicates
—40.0
to
+40.0
mV dc.
4.4.3.20
If
the
TI
is
a
NAV—750B
continue
with step
4.4.3.21.
Otherwise,
if
the
TI
is
not
a
NAV—750B,
proceed
to
step
4.4.3.27.
4.4.3.2
1
Set
the
TI
meter
function
and
toneselector
switch
to
400
Hz.
4.4.3.22
Verify
that
the
oscilloscope
displays
a
400
Hz
tone,
and
that
the
DMM
indicates
between
—80.0
to
+
80.0
mV dc.
4.4.3.23
Set
the
TI
meter
function
and
tone selector
switch
to
1300
Hz.
4.4.3.24
Verify
that
the
oscilloscope
displays a
1300
Hz
tone,
and
that
the
DMM
indicates
between
—80.0
and
+
80.0 mV dc.
4.4.3.25
Set
the
TI
meter
function
and
tone selector
switch
to
3000
Hz.
4.4.3.26
Verify
that
the
oscilloscope
displays
a
3000
Hz
tone,
and
that
the
DMM
indicates
between
—80.0
to
+80.0
mV dc.
4.4.3.27
Disconnect
the
oscilloscope
and
the
digital
multimeter
from
the
TI.
4.5
TONE
FREQUENCY
TESTS
4.5.1
Setthe
TI
controls
as
follows:
FREQUENCY
MHz
switches
to
108.000
LOC—G/S
frequency
switch
to
LOC
BEARING-FREQ
switch
to
FREQ
MASTER
MOD
control
to
CAL
(UNCAL
lamp
off)
1020
Hz
indent
tone
MOD
control
to
CAL
(UNCAL
lamp
off)
9960
Hz
FM
tone
MOD
control
to
CAL
(UNCAL
lamp
off)
30
Hz
tone
MOD
control
to CAL
(UNCAL
lamp
off)
LOC
DDM
switch
to
0
G/S
DDM
switch
to
0
4.5.2
Connect
the
electronic
counter,
set
for
a
30
Hz
measurementandAC
coupled,
input
to
the
TI
rear
panel
30
Hz
REF
jack.
11
NAVAIR
17—2OAX—737
4.5.3
Verify
that
the
electronic
counter
indicates
between
29.994
and
30.006 Hz.
4.5.4
Set
the TI
FREQUENCY
MHz
switches
to
108.100,
and
the G/S
DDM
switch
to
90
Hz.
4.5.5
Disconnect
the
electronic
counter
from
the
TI
30
Hz
REF
jack,
and
connect
it
to
the
TI
rear
panel
DEMOD
jack.
4.5.6
Verify
that
the
electronic
counter
indicates
between
89.982
and
90.018
Hz.
4.5.7
Set
the
TI
LOC—G/S
frequency
switch
to
G/S.
Ensure
that
the TI
frequency
display
indicates
334.700.
4.5.8
Verify
that
the
electronic
counter
indicates
between
89.982
and
90.018 Hz.
4.5.9
Set
the TI G/S
DDM
switch
to
150
Hz.
4.5.10 Verify
that
the
electronic
counter
indicates
between
149.97
and
150.03
Hz.
4.5.11
Set
the
TI
LOC—G/S
frequency
switch
to
LOC.
4.5.12 Verify
that
the
electronic
counter
indicates
between
149.97
and
150.03
Hz.
4.5.13
Set
the TI
FREQUENCY
MHz
switches to
108.000.
4.5.14
Adjust
the TI
30
Hz
tone modulation
control
to
UNCAL
[fully
ccw
(0)].
4.5.15
Connect
the
oscilloscope
vertical
amplifier
input
to
the
TI
rear
panel
TONES
jack.
4.5.16
Set
the
oscilloscope
controls
for
500
mV
vertical
sensitivity,
100
i.ts/div
sweep
time,
and
the
trigger
slope
to
positive
(+).
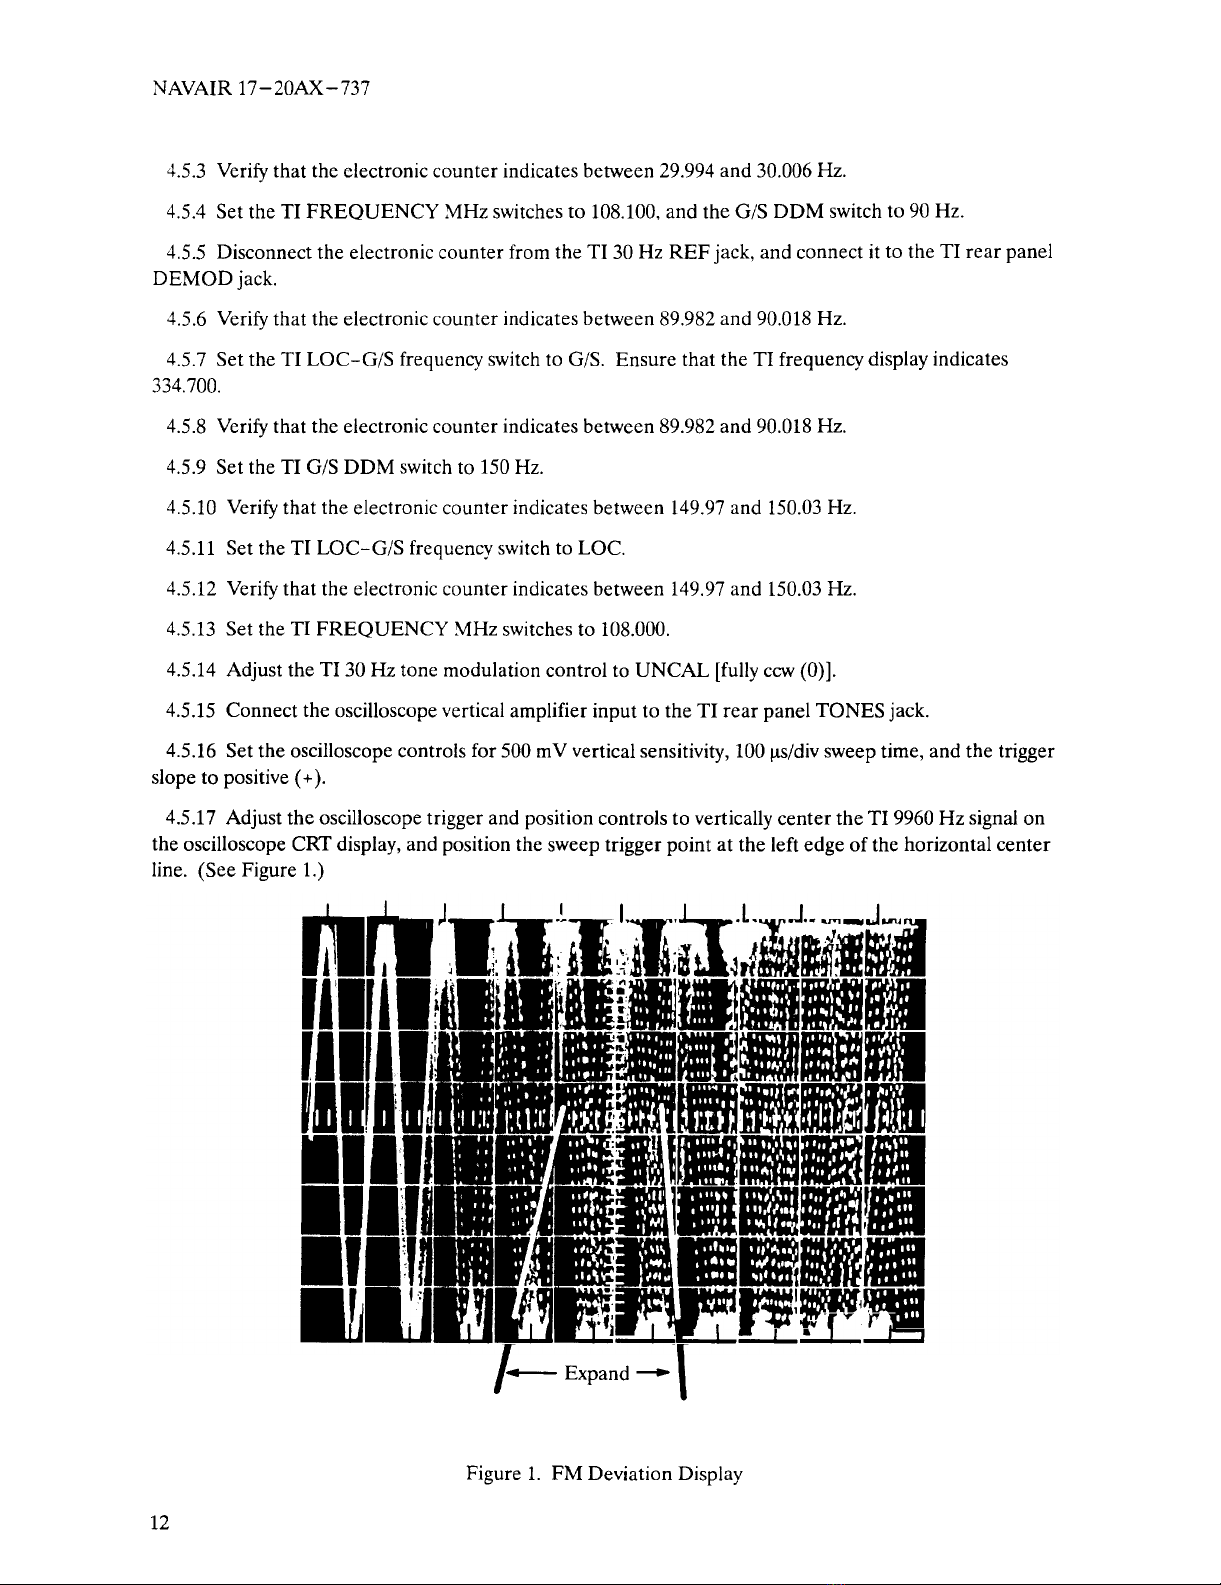
4.5.17
Adjust
the
oscilloscopetrigger
and
position
controls
to
vertically
centerthe
TI
9960
Hz
signal
on
the
oscilloscope
CRT display,
and
position
the
sweep
trigger
point
at
the
left
edge
of
the
horizontal
center
line.
(See
Figure
1.)
Figure
1.
FMDeviation
Display
..,~.I
~
Expand
—~
I
:(“
~
12

NAVAIR
17—2OAX—737
4.5.18
Use
the
oscilloscope
delayed
sweep
function
to
expand
the
portion
of
the
TI
signal
indicated
in
Figure
1,
with the
oscilloscope
delayed
timebase
set
for
10
p.s/div.
such
that
the
display
is
similar
to
Figure
2.
Verify
that
the
deviation
of
the
expanded
display
corresponds
to
delta
time
(st)
=
48.5
p.s
±2.4
p.s.
Figure
2.
9960
Hz
Deviation
(Expanded)
4.5.19 Verify
that
the
electronic
counter
indicates
between
9958.008
and
996
1.992
Hz.
4.5.20
Adjust
the TI
9960
FM
tone modulation
control
to
UNCAL
[fully
ccw
(0)].
4.5.21
Setthe
TI
30
Hz
tone modulation
control
to
the
CAL
(UNCAL
lamp
off)
position.
4.5.22 Verify
that
the
electronic
counter
indicates
between
29.994
and
30.006Hz.
4.5.23
Setthe
TI
9960
FM
tone modulation
control
to
the
CAL
(UNCAL
lamp off)
position,
the
FREQUENCY
MHz
switches
to
118.000,
and
the
Meter
function
switch
to
OFF.
4.5.24 Verify
that
the
electronic
counter
indicates
between
1014.9
and
1025.1 Hz.
4.5.25
If
the TI is a
NAV—750B,
proceed
with
step
4.5.26.
Otherwise,
if the
TI
is
not
a
NAV—750B,
skip
to
step
4.5.32.
4.5.26
Set
the TI
FREQUENCYMHz
switches
to
075.000,
and
the
Meter
function
and
Tone
Selector
switch
to
400
Hz.
4.5.27 Verify
that
the
electronic
counter
indicates
between
397.2
and
402.8 Hz.
4.5.28
Set
the
TI
meter
function
and
tone
selector
switch
to
1300
Hz.
4.5.29 Verify
that
the
electronic
counter
indicates
between
1290.9
and
1309.1
Hz.
Deviation
13

NAVAIR
17—2OAX—737
4.5.30
Set
the
meter
function
and
tone
switches
3000
Hz.
•
4.5.31
Verify
that
the
electronic
counter
indicates
between
2979.0
and
3021.0 Hz.
4.5.32
Disconnect
the
electronic
counter
and
the
oscilloscope
from
theTI.
4.6
TONE
DISTORTION
TESTS
4.6.1
Set the
TI
controls
to
the
following
positions:
FREQUENCY
MHz
switches
to
LOC-G/S
frequency
switch
to
BEARING-FREQ
switch
to
MASTER
MOD
control
to
9960
Hz FM
tone
MOD
control
to
1020
Hz
indent
tone
MOD
control
to
30
Hz
tone
MOD
control
to
LOC
DDM
switch
to
G/S
DDM
switch
to
Meter
function
switch
to
108.000
LOC
FREQ
CAL
(UNCAL
lamp
off)
CAL
(UNCAL
lamp
off)
CAL
(UNCAL
lamp
off)
CAL
(UNCAL
lamp
off)
0
0
0-100
or
OFF
4.6.2
Connect
the
distortion
analyzer
input
to
the
TI
rear
panel
30
Hz
REF
jack.
Setthe
distortion
analyzer
controls
for
distortionmeasurement
of
a
30
Hz
fundamental,
as
applicable.
4.6.3
Verify
that
the
distortion
analyzer
indicates
~0.5%
total
harmonicdistortion.
4.6.4
Set
the TI
FREQUENCY
MHz
switches to
108.100,
and
set the G/S
DDM
switch
to
90
Hz.
4.6.5
Disconnect
the
distortion
analyzer
from
the
30Hz
REF
jack,
and
connect
it
to
the
TI
rear
panel
TONES
jack.
4.6.6
Set
the
distortion
analyzercontrols
for
distortion
measurement
of
a
90
Hz
fundamental,
as
applicable.
4.6.7
Verify
that
the
distortion
analyzer
indicates
~0.4%
total
harmonicdistortion.
4.6.8
Set
the
TI
LOC—G/S
frequency
switch
to
G/S.
4.6.9
Verify
that
the
distortion
analyzer
indicates
0.4%
total
harmonicdistortion.
4.6.10
Set
the
TI
G/S
DDM
switch
to
150
Hz.
4.6.11
Set
the
distortion
analyzercontrols
for
distortion
measurement
of a
150
Hz
fundamental,
as
applicable.
4.6.12 Verify
that
the
distortion
analyzer
indicates
~0.4%
total
harmonicdistortion.
4.6.13
Set
the
TI
LOC—G/S
frequency
switch
to
LOC.
4.6.14 Verify
that
the
distortion
analyzer
indicates
0.4%
total
harmonicdistortion.
14

NAVAIR
17—2OAX—737
4.6.15
Set
the TI
FREQUENCY
MHz
switches
to
108.000.
4.6.16
Adjust
the
TI
9960
FM
tone modulation
control
to
the
UNCAL
[fully
ccw
(0)]
position.
Setthe
distortion
analyzercontrols
for
distortionmeasurement
of a
30
Hz
fundamental,
as
applicable.
4.6.17 Verify
that
the
distortion
analyzer
indicates
~0.5%
total
harmonicdistortion.
4.6.18
Set
the TI
9960
FM
tone modulation
control
to
the
CAL
(UNCAL
lamp
off)
position.
4.6.19
Set
the
TI
frequency
switch
to
118.000
MHz.
Setthe
distortion
analyzercontrols
for
distortion
measurement
of a
1020
Hz
fundamental,
as
applicable.
4.6.20 Verify
that
the
distortion
analyzer
indicates
~0.5%
total
harmonicdistortion.
4.6.21
If
the
TI
is
a
NAV—750B,
proceed
withstep
4.6.22.
Otherwise,
if
the
TI is
not
a
NAV—750B,
skip
to
step
4.6.28.
4.6.22
Set
the TI
FREQUENCY
MHz
switches to
075.000,
and
the
Meter
function
and
Tone
Selector
switch
to
400 Hz.
4.6.23
Set
the
distortion
analyzer
controls
for
distortionmeasurement
of
a
400
Hz
fundamental,
as
applicable,
and verify
that
the
distortion
analyzer
indicates
~.0.7%
total
harmonicdistortion.
4.6.24
Set
the TI
meter
function
and
tone selector
switch
tol300
Hz.
4.6.25
Set
the
distortion
analyzercontrols
for
distortionmeasurement
of
a
1300
Hz
fundamental,
as
applicable,
and
verify
that
the
distortion
analyzer
indicates
0.7%
total
harmonicdistortion.
4.6.26
Set
the TI
meter
Function
and
the
Tone
Selector
switch
to
3000
Hz.
4.6.27
Set
the
distortion
analyzercontrols
for
distortionmeasurement
of a
3000
Hz
fundamental,
as
applicable,
and
verify
that
the
distortion
analyzer
indicates
~0.7%
total
harmonicdistortion.
4.6.28
Disconnect
the
distortion
analyzer
from
the
TI.
4.7
PERCENT
AMPLITUDE
MODULATION
OF
TONESAND
MODULATION
METER
TESTS
4.7.1
Setthe
TI
controls
as follows:
FREQUENCY
MHz switches
to
108.000
Meter
function
switch
to
0—30
9960
Hz FM
tone
MOD
control
to
UNCAL
[fully
ccw
(0)]
30
Hz
tone
MOD
control
to
CAL
(UNCAL
lamp
off)
1020
Hz
indent
tone
MOD
control
to
CAL
(UNCAL
lamp
off)
MASTER
MOD
control
to
CAL
(UNCAL
lamp
off)
Output
attenuator
control
to
—20
dBm
LOC—G/S
frequency
switch
to
LOC
LOC
DDM
switch
to
0
G/S
DDM
switch
to
0
15

NAVAIR
17—2OAX—737
4.7.2
Connect
the
signal
generator
calibratorsensor
module
input
to
the
TI
RF
outputconnector.
4.7.3
Press
the
signal
generator
calibratorINSTR
PRESET
key
(Blue
key,
AUTOMATIC
OPERATION
key),
andensure
that
the
signal
generator
calibrator
is in
the
FREQ
measurement
mode
and
tunes
to
the
TI
FREQUENCY
MHz
switches
setting.
Set
the
signal
generator
calibrator
for
AMmodulation
measurements
with
the
DETECTOR
set
to
PEAK
±12.
Activate
the
signal
generator
calibrator
3
kHz
LP
FILTER.
4.7.4
Verify
that
the
signal
generator
calibrator
indicates
between
28.8%
and
31.2% AM
modulation,
and
record
the
reading.
4.7.5
Verify
that
the
TI
meter
indicates
within
±1.2%
(AM
depth)
of
therecorded
value
in
step
4.7.4.
4.7.6
Set
the
TI
meter
function
switch
to
0—100,
and
then
set the TI
30
Hz
tone modulation
control
to
the
fully
cw
position.
4.7.7
Verify
that
the
signal
generator
calibrator
indicates
>60%
AM
modulation.
4.7.8
Set
the
TI
30
Hz
modulation
control
to
the
UNCAL
[fully
ccw
(0)]
position.
4.7.9
Setthe
TI
1020
Hz
tone modulation
control
to
the
fully cw
position.
4.7.10
Activate
the
signal
generator
calibrator
50
HzHP
FILTER,
and
the
3
kHz
LP
FILTER.
Verify
that
the
signal
generator
calibrator
indicates
>60%
AM
modulation.
4.7.11
Setthe
TI
1020
Hz
tone modulation
control
to
the
CAL
(UNCAL
lamp
off)
position,
and
the
9960
Hz
tone modulation
control
to
the
CAL
(UNCAL
lamp
off)
position.
4.7.12
Activate
the
signal
generator
calibrator
300
HzHP
FILTER,
and
the >20
kHz
LP
FILTER.
4.7.13 Verify
that
the
signal
generator
calibrator
indicates
between
28.8%
and
3
1.2%
AMmodulation.
4.7.14
Set
the
TI
9960
Hz
tone modulation
control
to
the fully
cw
position.
4.7.15 Verify
that
the
signal
generator
calibrator
indicates
>60%
AM
modulation.
4.7.16
Setthe
TI
30
Hz
tone modulation
control
to
the
CAL
(UNCAL
lamp
off)
position,
and
the
9960
Hz
tone modulation
control
to
the CAL
(UNCAL
lamp off)
position.
4.7.17
Set
the
TI
FREQUENCY
MHz
switches
to
108.100.
Setthe
TI
G/S
DDM
switch
to
90
Hz.
4.7.18
Deactivate
the
signal
generator
calibrator
300
Hz
HP
FILTER,
and
activate
the
3
kHz
LP
FILTER.
4.7.19
Verify
that
the
signal
generator
calibrator
indicates
between
19.2%
and
20.8% AM
modulation.
4.7.20
Set
the
TI
G/S
DDM
switch
to
150
Hz,
and
the
TI
meter
function
switch
to
0—30.
4.7.21 Verify
that
the
signal
generator
calibrator
indicates
between
19.2%
and
20.8%
AM
modulation,
andrecord
the
reading.
4.7.22 Verify
that
the
TI
meter
indicates
within
±0.8%
of
the recorded
value
in
step
4.7.21.
4.7.23
Set
the TI
meter
Function
switch
to
0—100,
the
G/S
DDM
switch to 0,
the
LOC—G/S
switch to
G/S,
and
the
LOC
DDM
switch
to
90
Hz.
4.7.24 Verify
that
the
signal
generator
calibrator
indicates
between
38.4%
and
41.6%
AM
modulation.
16

NAVAIR
17-2OAX-737
4.7.25
Set
the
TI
LOC
DDM
switch
to
150
Hz.
4.7.26 Verify
that
the
signal
generator
calibrator
indicates
between
38.4%
and
41.6%
AM
modulation,
and
record
the
reading.
4.7.27 Verify
that
the
TI
meter
indicates
within
±1.6%
of
the
recorded
value
in
step
4.7.26.
4.7.28
Set
the TI
LOC
DDM
switch
to
0,
and
the
FREQUENCY
MHz
switches
to
118.000.
4.7.29
Activate
the
signal
generator
calibrator
50
HzHPFILTER,
and
the
15
kHz
LP
FILTER.
4.7.30 Verify
that
the
signal
generator
calibrator
indicates
between
28.8%
and
3
1.2% AM
modulation.
4.7.31
If
the
TI is a
NAV—750B,
proceedwithstep
4.7.32.
Otherwise,
if
the
TI
is
not
a
NAV—750B,
skip
to
step
4.7.41.
4.7.32
Set
the TI
controls
as
follows:
FREQUENCY
MHz
switches
to
075.000
MASTER
MOD
control
to
CAL
(UNCAL
lamp
off)
Meter
function
and
toneSelector
switch
to
400
Hz
1020
Hz
indent
tone
MOD
control
to
CAL
(UNCAL
lamp
off)
Output
attenuator
control
to
—20
dBm
4.7.33
Press
the
signal
generator
calibratorINSTR
PRESET
key
(Blue
key,
AUTOMATIC
OPERATION
key),
and
ensure
that
the
signal
generator
calibrator
is in
the
FREQ
measurement
mode
and
tunes
to
the
TI
FREQUENCY
MHz
switches
setting.
Setthe
signal
generator
calibrator
for
AMmodulation
measurements
with
the
DETECTOR
set
to
PEAK
±12.
Activate
the
signal
generator
calibrator
50
Hz
HP
FILTER,
and
the
15
kHz
LP
FILTER.
4.7.34 Verify
that
the
signal
generator
calibrator
indicates
between
92.
15%
and
97.85%
AMmodulation,
andrecord
the
reading.
4.7.35 Verify
that
the
TI
meter
indicates
within
±3%
of
the
recorded
value
in
step
4.7.34.
4.7.36
Set
the TI
meter
function
and
tone selector
switch
to
1300
Hz.
4.7.37 Verify
that
the
signal
generator
calibrator
indicates
between
92.
15%
and
97.85%
AM
modulation.
4.7.38
Setthe
TI
meter
function
and
tone selector
switch
to
3000
Hz.
4.7.39
Activate
the
signal
generator
calibrator
300
Hz HPFILTER,
and
the
>20
kHz
LP
FILTER.
4.7.40 Verify
that
the
signal
generator
calibrator
indicates
between
92.
15%
and
97.85%
AM
modulation.
4.7.41
Disconnect
the
signal
generator
calibratorsensor
module
from
theTI.
17

NAVAIR
17—2OAX—737
4.8
RF
LEVEL
METER
TESTS
4.8.1
Set
the
TI
controls
as
follows:
FREQUENCY
MHz
switches to
108.000
Meter
function
switch
to
RF
4.8.2
Verify
that
the
TI
meter
needle
is
aligned
over
the RF
level
vertical
mark
within
±1.5
needle
widths.
4.8.3
Set the
TI
FREQUENCY
MHz
switches
to
110.000.
NOTE
NAV—750B
is
tested
from
110.000
to
150.000
MHz,
and
from
330.000 to
335.000
MHz,
only.
4.8.4
Advance
the
TI
FREQUENCY
MHz
switches
in
20
MHz steps
to
335
MHz
(after
330
MHz
setting,
set
to
335
MHz),
and
at
each
setting,
verify
that
the
TI
meter
needle
remainsalignedover
the RF
Level
mark
within
±1.5
needle
widths.
•
4.8.5
If
the TI
is
a
NAV—750B,
proceed
withstep
4.8.6.
Otherwise,
if
the
TI
is
not
a
NAV—750B,
skip
to
subsection
4.9.
4.8.6
Setthe
TI
FREQUENCY
MHz
switches
to
072.000.
4.8.7
Verify
that
the
TI meter
needle
is
aligned
over
the
RF
Level
vertical
mark
within
±1.5
needle
widths.
4.8.8
Advance
the
TI
FREQUENCY
MHz
switches in 2.0
MHz steps
to
78.000 MHz,
and
at
each
setting,
verify
that
the
TI
meter
needle
remains
aligned
over
the
RF
level
mark
within
±1.5
needle
widths.
4.9
VOR
BEARING
TESTS
4.9.1
Set the
TI
controls
as follows:
FREQUENCY
MHz
switches
to
108.000
MHz
30
Hz
tone
MOD
control
to
CAL
(UNCAL
lamp
off)
1020
Hz
indent
tone
MOD
control
to
CAL
(UNCAL
lampoff)
9960
Hz
FM
tone
MOD
control
to
CAL
(UNCAL
lampoff)
BEARING-FREQ
switch
to
BEARING
TO-FROM
switch
to
TO
4.9.2
Connect
the
navigation
indicator
T!S
input
connector
to
the
TI
rear
panel
DEMOD
(J23)
connector.
4.9.3
Press the
TI
0°
VOR
bearing
selectpushbutton,
andensure
that
the
TI
bearing
display
indicates
0.0°.
4.9.4
Verify
that
the
navigation
indicator
TIS
indicates
000.00°
±0.05°.
18
This manual suits for next models
2
Table of contents
Other IFR Test Equipment manuals

Popular Test Equipment manuals by other brands

ACE INSTRUMENTS
ACE INSTRUMENTS ACE II Basic plus operating manual

Keysight Technologies
Keysight Technologies N5990A-301 user guide

Elenco Electronics
Elenco Electronics SP-3B Assembly and instruction manual

Megger
Megger MFT70-US user manual

Smart Start
Smart Start IN-HOM User instructions

FLIR
FLIR VT8-600 user manual


