Ledmotive PHOTONFY SP-01-BLU User manual

Photonfy User Manual
https://photonfy.com
1
Index
1.0 INTRODUCTION.................................................................................................................. 2
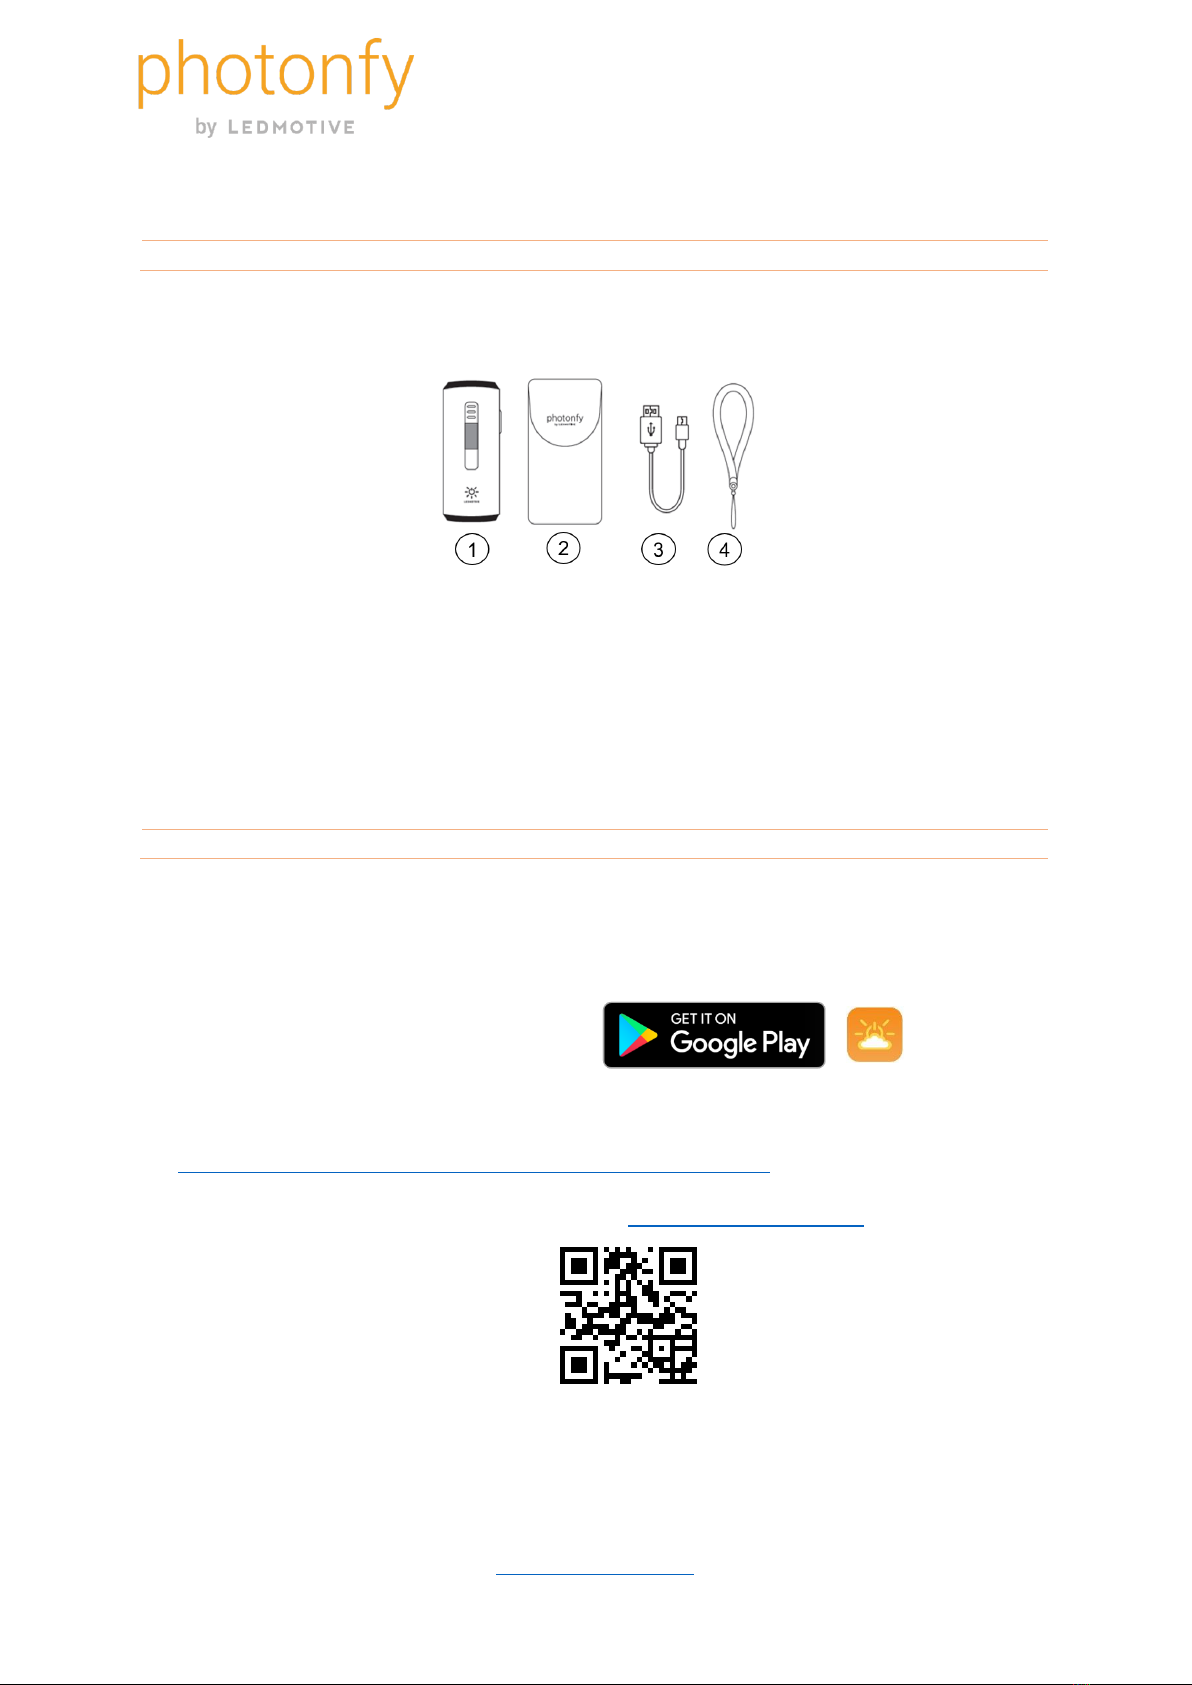
1.1 ORDERING INFORMATION.............................................................................................. 3
2.0 APP SOFTWARE................................................................................................................. 3
2.1 USING THE PHOTONFY APP................................................................................................ 4
2.2 INITIAL SIGN IN / SIGN UP MENU........................................................................................ 5
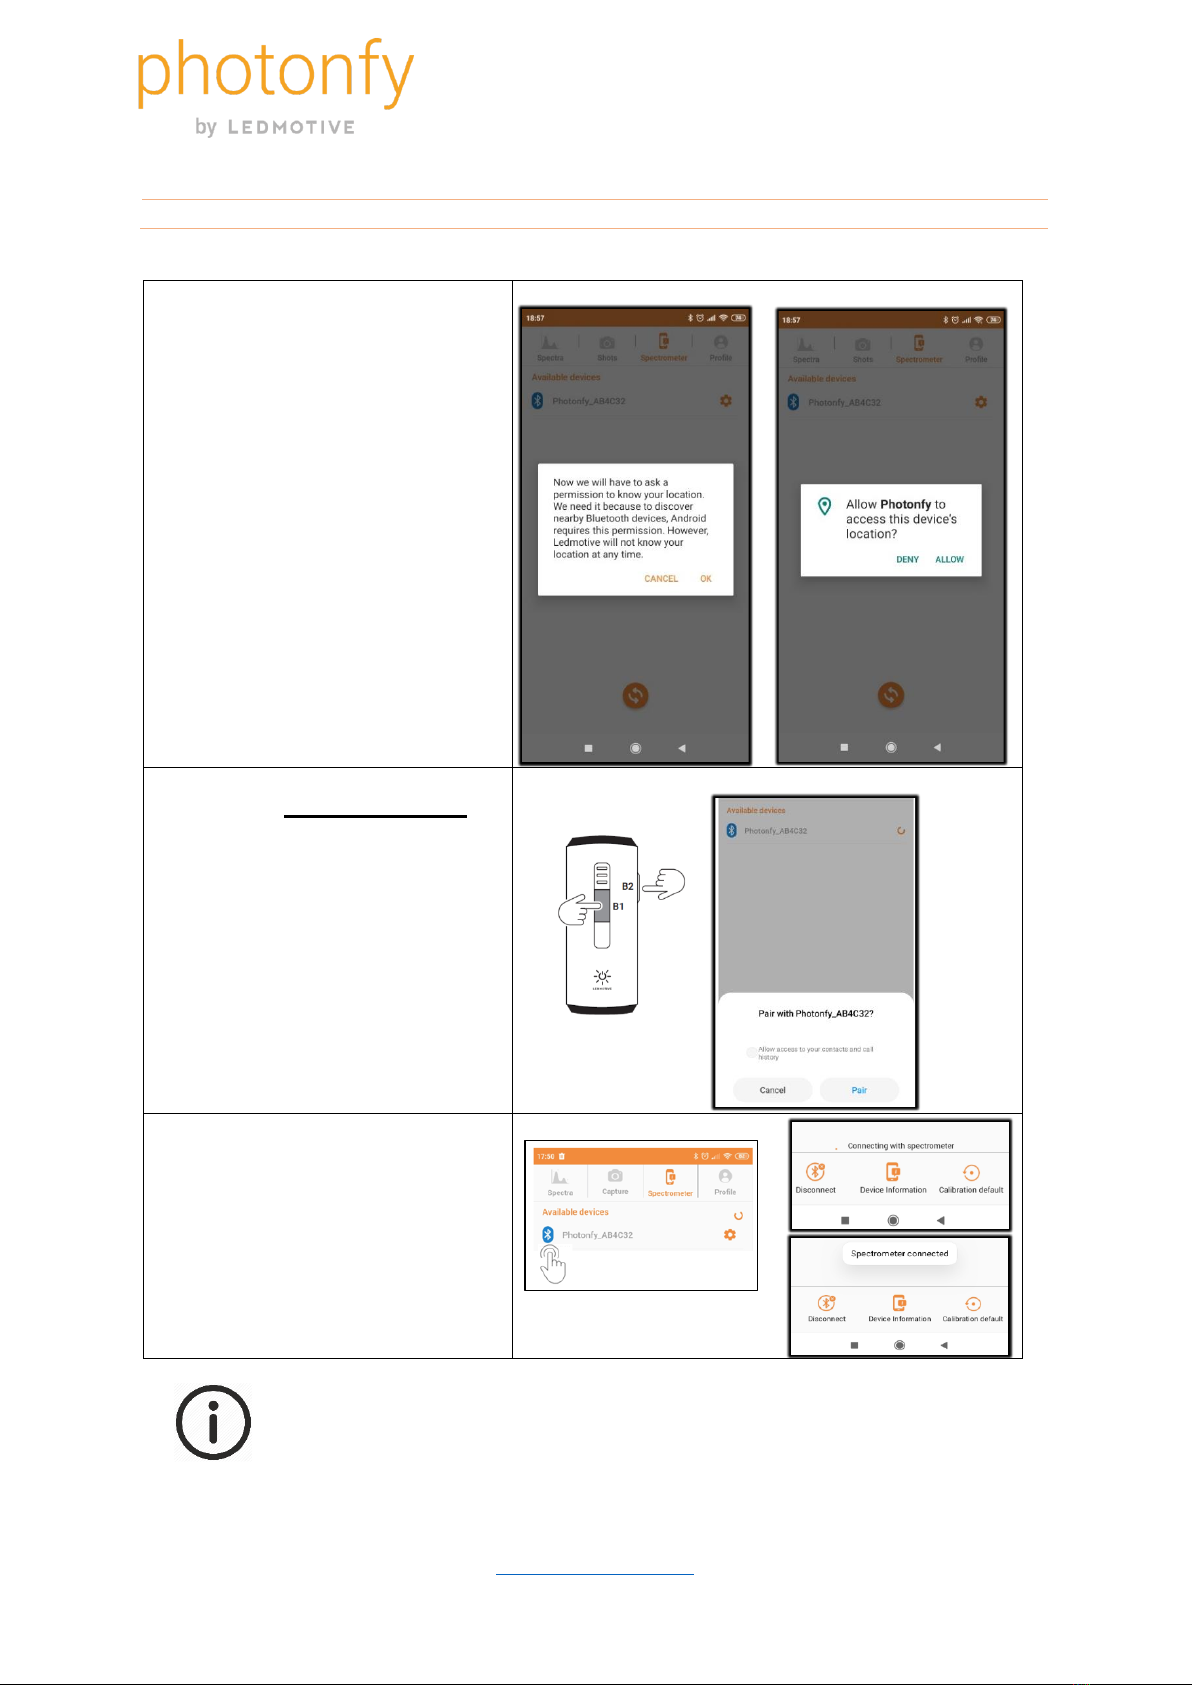
2.3 BLUETOOTH DISCOVERING, PAIRING AND CONNECTION......................................... 6
2.4 MENUS........................................................................................................................................ 7
2.5 MENU SPECTROMETER........................................................................................................ 7
2.6 MENU SHOTS............................................................................................................................ 8
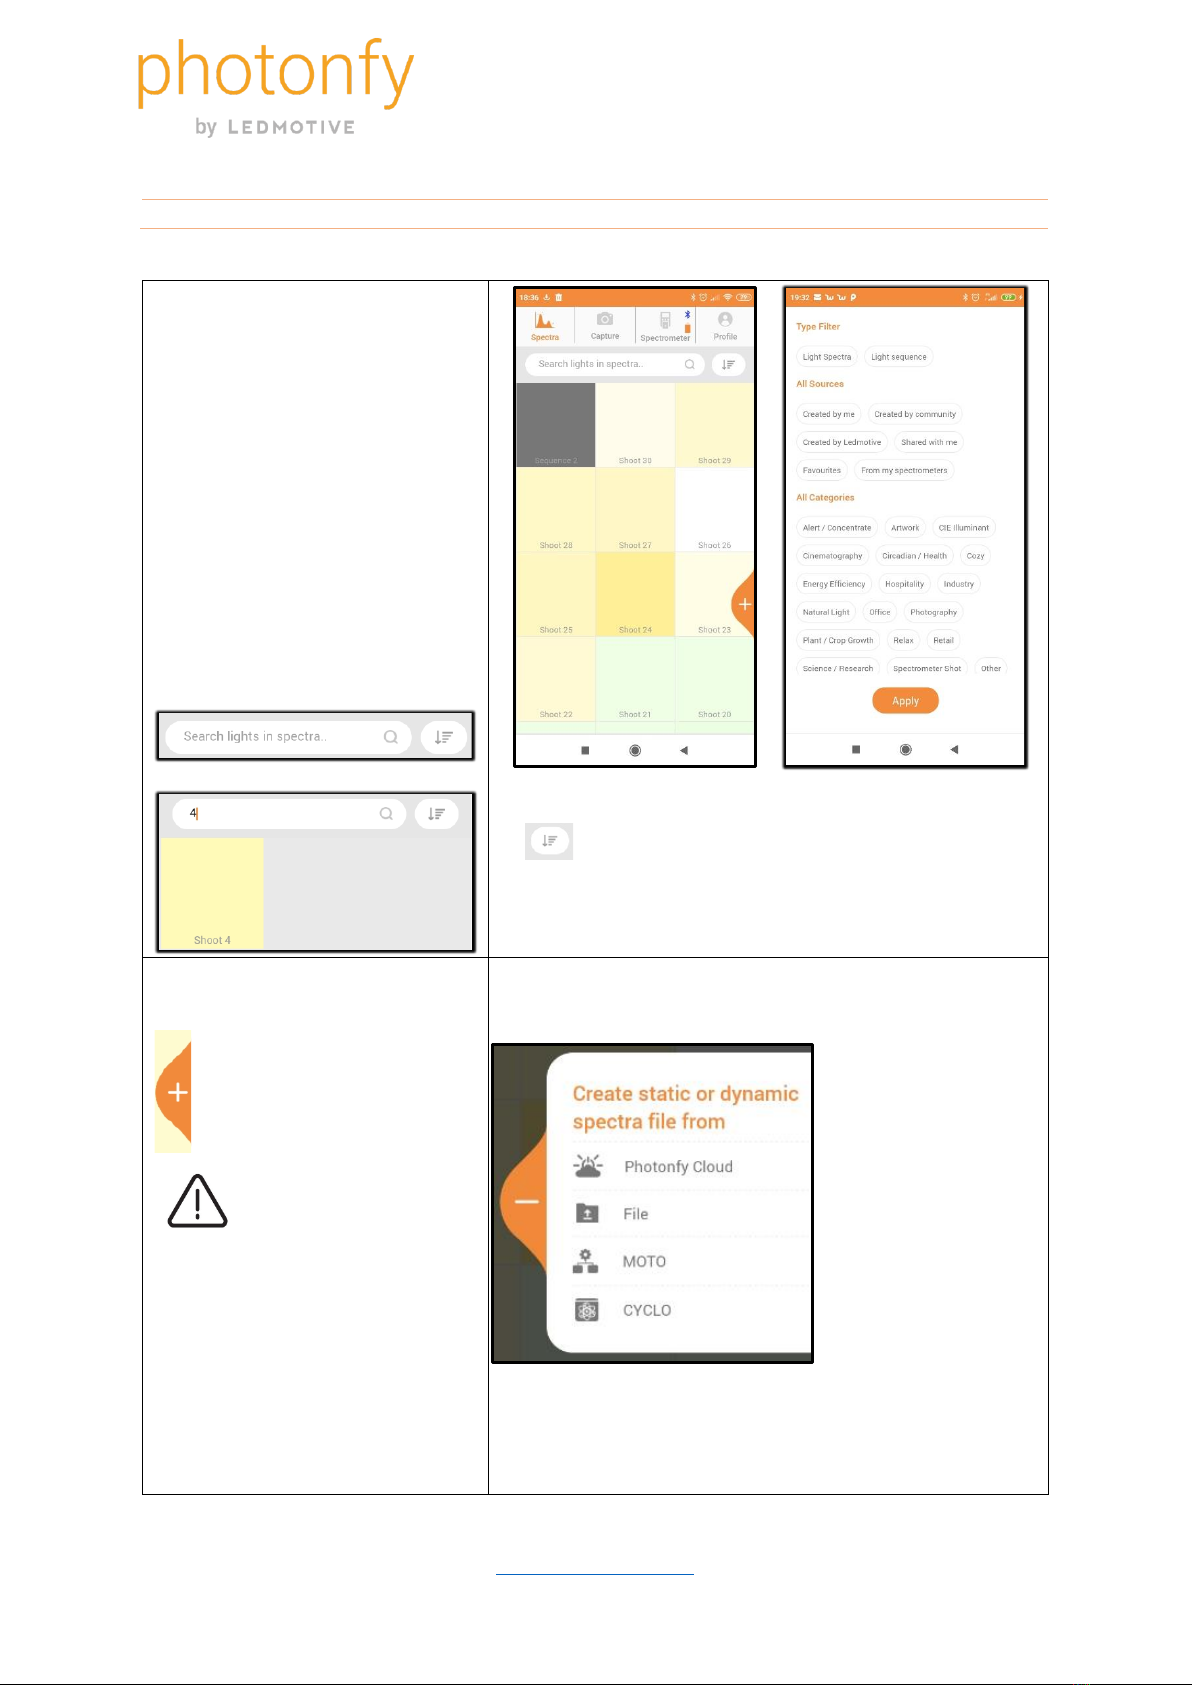
2.7 MENU SPECTRA....................................................................................................................... 9
2.8 MENU PROFILE...................................................................................................................... 10
3.0 HOW TO CREATE AND SHARE A REPORT............................................................... 11
3.1 HOW TO CREATE A COLOR REPORT ........................................................................ 12
3.2 HOW TO CREATE A HEALTH REPORT....................................................................... 15
3.3 HOW TO CREATE A HORTICULTURE REPORT ....................................................... 16
3.4 HOW TO CREATE AN ARTWORK REPORT............................................................... 18
4.0 TECHNICAL SPECIFICATIONS........................................................................................... 19
4.1 COMMUNICATION SPECIFICATIONS............................................................................... 19
5.0 MECHANICAL SPECIFICATIONS........................................................................................ 20
6.0 MAINTENANCE....................................................................................................................... 21
7.0 WARNING AND SAFETY....................................................................................................... 21
8.0 DISPOSAL................................................................................................................................ 21
9.0 WARRANTY............................................................................................................................. 21

Photonfy User Manual
https://photonfy.com
2
1.0 INTRODUCTION
Photonfy is the most complete, versatile, and affordable handheld spectrometer in the market.
This user manual is designed to help you use both, the hardware, and the Android APP. This
product has been designed with the non-professional user in mind, so you do not have to have
a PhD. to take advantage of it. With our handheld spectrometer, you have a powerful light
catcher with all the features and performance of a scientific-grade spectrometer.
APPLICATIONS
•Color measurements
•Quality lighting inspection for health, horticulture or artwork
•Photography and Film makers
•Flickering measurements
•Artificial light meter/analyzer
•Natural light recorder (dynamic light sequences)
•Instant spectral copy-paste or real-time light streaming (to any luminaire compatible
with LEDMOTIVE technology)
•IoT Lighting networks
ADVANTAGES
•Factory-calibrated spectrometer device
•Automatic integration time option to capture static and dynamic light spectra
•Fast data processing
•Modern UX. Clear graphics and reports
•Light spectra database synchronization with LEDMOTIVE cloud platform
•Lifetime firmware updates
•Share spectral data with your colleagues. Make you spectra either private or public
•Bluetooth connectivity
•Free PHOTONFY APP compatible with Android OS
To get started, see the Software Section 1. For more precise information, refer to the sub-
sections on software download and installation, using the Photonfy APP, menus and use. All
the documentation related to the hardware operation is given in Sections 2 and 3. Technical
and mechanical specifications in sections 4 and 5, maintenance, safety and legal statements
can be found in Sections 6 and 7.

Photonfy User Manual
https://photonfy.com
3
1.1 ORDERING INFORMATION
The box contains the following items:
(1) Handheld spectrometer SP-01-BLU
(2) Photonfy Soft pouch
(3) USB-to-Micro USB cable (30 cm)
(4) Neck strap
2.0 APP SOFTWARE
We have designed Photonfy with the finest user experience.
After following the steps below, you will soon be on your way to becoming a Photonfy user
expert.
Get the latest version of Photonfy APP:
1. Download Android Photonfy APP from Google Play Store.
https://play.google.com/store/apps/details?id=com.photonfy.app
2. Or use the QR code to download the APP http://.app.photonfy.com
3. Install the APP in your Android smartphone and/or tablet. This APP is compatible with
Android OS 9.0 and newer versions.

Photonfy User Manual
https://photonfy.com
4
2.1 USING THE PHOTONFY APP
1. TURNING THE DEVICE ON
•Turn on the handheld spectrometer with
the lateral button ON/OFF.
2. OPEN THE PHOTONFY APP
•By default, the APP checks if Bluetooth
connection is enabled. You may have to
enable Bluetooth from the settings of
your Android OS.
Note: Please fully charge the battery before using it for the first time. When
plugging-in the spectrometer for battery charge, the LED status indicator will
start blinking every second. Wait until the green LED stops blinking. At this
time the battery will be fully charged and the device is ready to use.

Photonfy User Manual
https://photonfy.com
5
2.2 INITIAL SIGN IN / SIGN UP MENU
1. SIGN IN
•By default, the APP opens the Sign in
screen.
2. SIGN UP
•New users without a photonfy.com
account, should select sign up and
create a new account. After that, sign in
with the username and password
provided.
•Check your email to activate the new
account.
Note: You can skip the sign in menu by tapping the word “skip” located at
top right of the sign in screen. This allows you to work in local mode.
However, in this mode, the APP has a reduced setof functions to interact with
the spectrometer.

Photonfy User Manual
https://photonfy.com
6
2.3 BLUETOOTH DISCOVERING, PAIRING AND CONNECTION
1. DISCOVERING
By default, the APP asks for
permission to know the user
location. This permission request is
mandatory for the latest versions of
Android OS to discover nearby
Bluetooth devices.
•Photonfy: (Press lateral button
ON)
•Please, accept Bluetooth
permission.
•Tap in the circular progress bar
to start discovering
spectrometer devices.
2. PAIRING (only the first time):
•Press the central button (B1) +
lateral button (B2) during 5s. In
this moment, the Blue LED will
start blinking.
•Tap in the desired device and
wait some seconds for pairing
to complete.
3. CONNECTION
•Please, tap in available devices
to start the connection process.
•If the connection procedure is
successful, the message
“spectrometer connected” will
be displayed.
Note: If the discover, pair or connection procedure is not possible, please
check the Bluetooth interface (mode: active) in your smartphone or
tablet and repeat all the previous steps.

Photonfy User Manual
https://photonfy.com
7
2.4 MENUS
Spectra | Capture | Spectrometer | Profile
Spectra: shows the spectra
files and video sequences
captured and created by the
user.
Capture: captures static
spectra or video sequences.
Spectrometer: spectrometer
configuration and calibration
settings
Profile: user profile settings
2.5 MENU SPECTROMETER
SPECTROMETER CONFIGURATION:
•Integration time: by default, configured in Automatic mode
•Video sample rate: by default, one frame every 1 second
•Battery: battery charge indicator (1% to 100%)
CALIBRATION:
•Dark Calibration: optional operation before taking a shot.
Use if illuminance or temperature conditions have changed
over time. See Calibration section.
•Lux Calibration: advanced option to recalibrate illuminance
•Wavelength Calibration: advanced option that updates
sensor calibration coefficients. See Calibration section.
•Transfer Function Calibration: advanced calibration that
corrects for the wavelength-dependent optical transmission
along the optical path. See Calibration section.
•Disconnect: Bluetooth connect/disconnect option. See
Bluetooth discovering, pairing and connection.
•Device information: For maintenance purposes. See sub-
menu device information.
•Calibration default: reset calibration to the factory defaults.
See Calibration section.

Photonfy User Manual
https://photonfy.com
8
2.6 MENU CAPTURE
SPECTRA MENU
SEND TO
Opens the list of
available user spaces to
stream captured light spectrum
(luminaires compatible with
LEDMOTIVE technology
required)
PLAY VIDEO
Play video (OFF)
Play video (ON)
SINGLE SPECTRUM
Capture single spectrum
INDICATORS
•CCT (K)
•CIE (x,y)
•Illuminance (lx)
•Battery charge
•Bluetooth connection
OPERATIONAL MODE
Spectral power distribution measurement (SPD)
Flicker measurement mode
INTEGRATION TIME

Photonfy User Manual
https://photonfy.com
9
2.7 MENU SPECTRA
TYPE OF RECORDS
•Shot: capture a single
spectrum.
•Sequence: capture a
sequence of spectra at a
user-defined framerate.
Sometimes referred as
“spectral videos”.
SEARCH FILE
Bar to search spectral shots or
videos by name
Filter: The spectral database can be filtered
by different attributes
CREATE SPECTRA FILE
Opens new window to
create theoretical spectra or
sequences from scratch
In this option spectra files
are created from scratch
using Ledmotive spectra
file format, or using the tools: MOTO
and CYCLO. Different metamers are
specified by its CCT and the output
metameric spectrum is selected after
optimizing and filtering by some
user-defined light parameters.
CREATE SPECTRA FILE :OPTIONS
From Photonfy cloud:
Spectra files shared by
Photonfy users and
community
From File: imported
Spectra file SSF format
From MOTO: Metamer
Optimization Tool by
LEDMOTIVE
From CYCLO: 24h
cycle light optimizer by
LEDMOTIVE.

Photonfy User Manual
https://photonfy.com
10
2.8 MENU PROFILE
Edit options
•Update Name.
•Language (EN /ES).
•Update Profile photo.
User settings
•Change Password.
•Use naïve input: Y/N.
•Plot rainbow spectra: Y/N
•Local Light Hub
•About Us / Contact Us.
•Privacy Policy.
•FAQ’s: Frequent
questions of about this
product.
•Help & Lighting
knowledge: Technical
lighting terms used in
Photonfy APP.
SUB-MENU: LOCAL LIGHT HUB
Advanced feature for interaction with any luminaire or light
Hub (LEDMOTIVE-enabled luminaire required)
Note: Local Light Hub option requires luminaires and Ligh Hubs compatible
with LEDMOTIVE™technology. It allows you to replicate (bypass or
preprocessing) the light measured with this spectrometer to interior rooms or
spaces. For more information contact with LEDMOTIVE™at
https://www.ledmotive.com

Photonfy User Manual
https://photonfy.com
11
3. HOW TO CREATE AND SHARE A REPORT
GENERAL REPORT
•Go to Menu Spectra.
•Open a spectral record.
•Generate report.
MAIN PROPERTIES
•CCTCorrelated Color
Temperature (K).
•Illuminance (lx).
•CIE 1931 (X,Y,Z) color space.
•CIE 1931 (x,y) coordinates.
•CIE 1976 (U,V) color space.
•sRGB: standard Red Green Blue
color space to use on monitors.
•CIE CRI-Ra color rendering
index. scale from 0 to 100 %
General CRI is calculated as the
average value of R1 through R8.
•CIE CRI-R9 color rendering
index.
IES COLOR RENDITION
•TM 30-18-Rf: color rendition
Fidelity (Rf).
•TM 30-18-Rg: color rendition
Gamut (Rg).
•SPD: Spectral power distribution
(380nm-780nm).
•CIE 1931 xy diagram: Colour
coordinates (x,y).
•Shoot file properties
GENERATE REPORT
Report formats:
PDF, Excel, CSV
SHARE OPTIONS:
•WhatsApp
•Email
•File stored in folder

Photonfy User Manual
https://photonfy.com
12
3.1 HOW TO CREATE A COLOR REPORT
COLOR REPORT
•Go to Menu Spectra.
•Open a spectral record.
•Move slider to Color.
COLOR PROPERTIES
•CCT correlated Color
temperature (K).
•Flux (lm).
•CIE 1931 (X, Y, Z) color space.
•CIE 1931 (x, y) coordinates.
•CIE 1976 (U,V) color space.
•sRGB: standard Red Green
Blue color space.
•HEX color: RGB color
expressed as a six-digit HEX
value.
•HSV: Hue, Saturation, and
Value color model.
•CMYK: Cyan Magenta Yellow
Black color model used in
color printing.
•Human-read color: the closest
match of a named color.
•Nearest MUNSELL: Munsell
Color system.
•Dominant wv (nm): Dominant
wavelength in nanometers
(nm).
Example of color properties of a Shoot file

Photonfy User Manual
https://photonfy.com
13
•Purity (%): the degree to which
a color resembles its hue.
•CRI-Ra: scale from 0 to 100 %
General CRI is calculated as
the average value of R1
through R8.
IES COLOR RENDITION
•TM30-18-Rf: color rendition
Fidelity (Rf).
•TM30-18-Rg: color rendition
Gamut (Rg).
Spectral power distribution
•SPD (380nm-780nm).
CIE 1931 XY DIAGRAM
•xy Colour coordinates (x,y).
ANSI C78.377.2017
•American National Standard
for Electric Lamps—
Specifications for the
Chromaticity requirements for
general lighting with solid-state
lighting products.
SPECIAL COLOR RENDERING
INDEX
•Special CRI R1-R14 numbers.
CIE-Lab color
•CIELAB color space. L
indicates lightness, ais the
red/green coordinate, and bis
the yellow/blue coordinate.

Photonfy User Manual
https://photonfy.com
14
TM30-18 HUE REGIONS
•Color shifts in the a-b space
for the different TM30 hue
regions.
TM30-18 CIELAB
TEST/REFERENCE
COLOR ICON
•Visual description of hue and
saturation changes. Daylight is
represented as a perfectcircle.
Over-saturated colors can be
interpreted as points that lie
outside the perfect circle. In
the same way, de-saturated
colors lie inside the circle.

Photonfy User Manual
https://photonfy.com
15
3.2 HOW TO CREATE A HEALTH REPORT
HEALTH REPORT
•Go to Menu Spectra.
•Open a spectral record.
•Move slider to Health.
Non-visual indicators
•CCT: Correlated Color temperature for
white light sources used to describe the
dominant color tone along the
dimension from warm (yellows and
reds) to cool (blue).
•Illuminance: is the amount of light
(luminous flux) incident on a surface
area. Illuminance is measured in foot-
candles (lumens/square foot) or lux (lx,
lumens/square meter).
•Melanopic Lux: Non-visual effect of
lighting that relates to the way that blue
frequencies in daylight restrict the
production of melatonin in the body’s
system until night when melatonin
increase through the system and
prepare the body to sleep. This is the
Equivalent Melanopic Lux (EML).
•CS: Circadian Stimulus (CS): is the
calculated effectiveness of the
spectrally weighted irradiance at the
cornea from threshold (CS = 0.1) to
saturation (CS = 0.7), assuming a fixed
duration of exposure of 1 hour.
•Circadian Light (CLA): is the
irradiance at the cornea weighted to
reflect the spectral sensitivity of the
human circadian system as measured
by acute melatonin suppression after a
1-hour exposure.
ADDITIONAL PLOT OPTIONS

Photonfy User Manual
https://photonfy.com
16
3.3 HOW TO CREATE A HORTICULTURE REPORT
PLANTS REPORT
•Go to Menu Spectra.
•Open a spectral record.
•Move slider to Plants.
PHOTOSYNTHETIC PHOTON FLUX
INDICATORS
•PPFD Total Par Zone (400-700nm):
Total Photosynthetic photon flux
density. Rate of flux of photons
expressed in μmol/s.m² that actually
arrives at the crop canopy in the Par
zone (400 nm to 700 nm).
•PPFD IR Zone (700-800nm): Far red
Photosynthetic photon flux density in
the range of 700-800 nm.
•PPFD Red Zone (600-700nm):
Photosynthetic photon flux density in
the range of 600 to 700 nm.
•PPFD Green Zone (500-600nm):
Photosynthetic photon flux density in
the range of 500 to 600 nm.
•PPFD Blue Zone (400-500nm):
Photosynthetic photon flux density in
the range of 400 to 500 nm.
•PPFD UV Zone (350-400nm): UV
Photosynthetic photon flux density in
the range of 350-400 nm.
PHOTOSYNTHETIC PHOTON FLUX (PPF)
•PPFD is the rate flow of photons within
the photosynthetically active radiation
(PAR) range, from 400 nm to 700 nm
(ANSI/ASABE S640 JUL2017). It is
calculated by multiplying the luminaire
SPD by the unweighted PPF action
spectrum and summing the total. It
represents CO2 assimilation per mole
of incident photons, and is analogous
to luminaire lumens.
Yield Photon Flux (YPF)
YPF weights the spectral characteristics of
photons based on plant's photosynthetic
response.

Photonfy User Manual
https://photonfy.com
17
YIELD PHOTON FLUX INDICATORS
•YPFD Total Par Zone (400-700nm):
weights the spectral characteristics of
photons in the Par zone.
•YPFD IR Zone (700-800nm): weights
the spectral characteristics of photons
in the far red range.
•YPFD Red Zone (600-700nm):
weights the spectral characteristics of
photons in the range from 600 to
700nm.
•YPFD Green Zone (500-600nm):
weights the spectral characteristics of
photons in the range from 500 to
600nm.
•YPFD Blue Zone (360-500nm):
weights the spectral characteristics of
photons in the range from 360 to
500nm.
•YPFD UV Zone (350-400nm): weights
the spectral characteristics of photons
in the UV range.
•Red/Blue: (ratio) indicates the effects
on the growth productivity related to
stem elongation and leaf expansion.
Blue light has significant effects on the
morphology of plants aside from Photo-
synthesis.
•Red/Far-red: (ratio) indicates the
effects on the growth productivity
related to flowering, setting winter buds
and vegetative growth.
•Daily Light Integral (DLI) the
aggregate amount of PAR light that a
surface receives over the course of a
day. It is a very useful metric to
determine if a particular location
receives sufficient amounts of light for
plants to grow well. Low light plants
require between 5-10 mol/m2/day,
medium light plants 10-15 mol/m2/day,
and high light plants will require more
than 15 mol/m2/day.
CONVERSION FACTORS
Where B(λ,T) is the black-body spectrum
according to Planck's law, y(λ)is the standard
luminosity function V(λ), λ1, λ2 represent the
wavelength range (400 700 nm) of PAR, h is
Plack constant, c is the velocity of light, 683 is
the constant and NA is the Avogadro
constant. The value of V(λ) is 0.999997 at
555.016 nm, so that a value of 683/0.999997 =
683.002 is the multiplicative constant.

Photonfy User Manual
https://photonfy.com
18
3.4 HOW TO CREATE AN ARTWORK REPORT
GENERAL REPORT
•Go to Menu Spectra.
•Open a spectral record.
•Move slider to Artwork.
CIE DAMAGE FUNCTIONS sdf(λ)
Damage function curves for materials which
follow an exponential decay with the
increase of wavelength. depend on the type
of material (water colors, oil paint, paper,
textile materials, etc).
THRESHOLD EXPOSURE LEVEL
Photon energy threshold in lux-hoursthat the
object can bear, to avoid a photochemical
reaction in the material, thus showing the
color change.
POTENTIAL DAMAGE VALUE (mW/lm)
Damage effect of the light spectrum on the
material under a certain exposure, in which
the illuminance in lux, exposure time tand
Spectral Power Distribution are known.
The thermal effect of infrared in the light
source dry, deform and crack the materials.
The UV radiation is a chemical effect, which
will cause the fading and discoloration of the
material.
•Relative specific sensitivity of
newspaper.
•Relative specific sensitivity of rag paper.
•Relative specific sensitivity of oil colors.
•Relative specific sensitivity of textile.
•Relative specific sensitivity of water
colors.
Note: A prolongued exposure of artwork to
light will cause irreversible or permanent
color damage such as fading, dis-coloration
and darkening.

Photonfy User Manual
https://photonfy.com
19
4.0 TECHNICAL SPECIFICATIONS
Absolute maximum ratings
MIN
MAX
UNIT
Voltage operation
4.5
5.5
V
Battery capacity
500
550
mAh
Operating conditions
MIN
TYP
MAX
UNIT
Nominal voltage
operation
4.5
5
5.5
V
Power operation
450
500
550
mW
Battery charge current
80
100
200
mA
Temperature range
5
-
50
ºC
Spectral range
380
-
780
nm
Spectral resolution
12
nm
wavelength accuracy *
+- 1
nm
Integration time
5
-
5000
ms
Illuminance range
5
-
55000
lux
Illuminance accuracy
±8
%
x,y Color accuracy CIE
1931
± 0.0025
%
CCT accuracy
±3
%
CRI (Ra) accuracy
±1
%
Measurement mode
Single,
continuous,
subtract
background
Flicker Frequency Range
5
-
100
Hz
Wavelength temperature
dependence
-0.1 / + 0.1
nm
ºC
Battery duration**
24
30
48
Hours
*(assumes stable input light source)
**(assumes ON mode / no Bluetooth connection / only LED ON)
4.1 COMMUNICATION SPECIFICATIONS
Wireless Communication protocol
Bluetooth 4.2 Smart Ready Compliant
Certifications Bluetooth module
Bluetooth, CE, FCC and IC, Japan and South-
Korea qualified
Control software for smartphones
photonfy Android APP. This APP is compatible
with Android OS 9.0 and newer
https://play.google.com/store/apps/details?id=com.
photonfy .app
This manual suits for next models
2
Table of contents
Popular Measuring Instrument manuals by other brands

Parkside
Parkside PKLL 7 E4 Translation of the original instructions

Hilti
Hilti PM 2-L operating instructions

Emerson
Emerson Asco 890 Series Installation and maintenance instructions

Bedfont
Bedfont FENObreath user manual

SOMMY
SOMMY ER9 Series Operation manual

IFM Electronic
IFM Electronic efector300 SD6000 operating instructions