Marconi Instruments TF 2502 User manual

TF-2502-Marconi-1.jpg

R.P.
lc
11/78/E
Instruction Manual
No.
EB
2.502
for
R.F.
Power
Meter
TF
2502
•
m1
rechnic~O
LLI::Jitcations
©
1969
MARCONI
INSTRUMENTS
LIMITED
ST. ALBANS HERTFORDSHIRE
ENGLAND
EB
2502
lb-
11/74

Contents
Chapter 1 GENERAL
INFORMATION
1.
1
Introduction
1.
2
Data
summary
1.
3
Accessories
Chapter 2 OPERATION
2. 1
General
...
2.2
Controls
..
·.
2.3
Connections
2.4.
Measurement
precautions
.
2.5
Making
power
measurements
2.6
Remote
operation
2. 7
Determination
of
modulation
depth
Decibel conversion
table
3
4
5
6
6
7
8
8
9
9
11
Chapter 3 TECHNICAL DESCRIPTION
3. 1
Circuit
analysis
...
3. 2
Detector
unit
3.
3
Terminating
load
..
2
13
14
14
Chapter 4
MAINTENANCE
4. 1
General
. . . 15
4.
2
Removal
and
replacement
of
components
. . . 16
4.
3
Removal
of
terminating
load
and
detector
unit
16
4.
4
Removal
of
monitor
front
panel16
Chapter 5 CALIBRATION
5. 1
Apparatus
required
17
5. 2
Preliminary
checks
17
5. 3
Standing
wave
ratio
17
5. 4
Calibration
accuracy
at
l.
f. . 18
5. 5
Calibration
accuracy
at
r.
f. 19
Chapter 6 REPLACEABLE PARTS
Introduction
and
ordering
Chapter 7 CIRCUIT DIAGRAMS
Circuit
notes
...
Fig.
7.
1
Circuit
diagram
21
24
25
2502 (1)

General
information
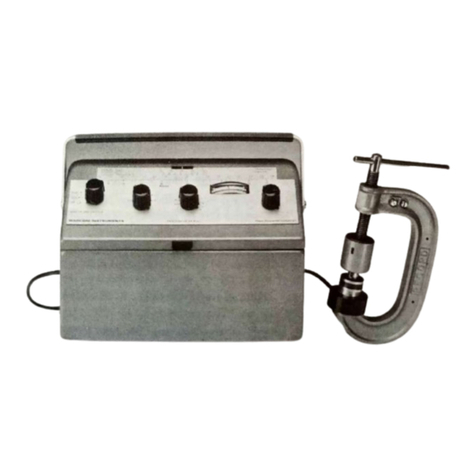
1.1
INTRODUCTION
TF
2502
is
a 50 Q
absorption
power
meter
for
measurements
from
d.
c.
to
1 GHz
in
ranges
of 3
Wand
10 W
full-scale.
It
is
one of a
series
of
similar
instru-
ments
having
different
power
ranges.
The
design
is
based
on
thin-film
and
microwave
techniques
and
employs
a
thermocouple
detector
in
series
with a
terminating
load.
Incident
power
is
sampled
by
tbe
detector
and
the
resultant
e.
m.
f.
is
displayed
on
a
meter
calibrated
in
terms
of
totalincident
power.
This
method
gives
a
reading
of
true
mean
power
irrespective
of
waveform
and
makes
the
instrument
particularly
suitable
for
measurim:;
the
output
of
a.m.
or
pulse
transmitters.
A
socket
is
provided
to
allow
the
demodulated
signal
to
be
monitored
on
headphones
or
an
oscilloRcope.
The
disadvantage
of
the
long
time
constant
inherent
in
a
thennocouple
meter
is
overcome
by
the
provision
of
an
auxiliary
fast
response
diode
detector
with a
separate
small
meter.
This
allows
you
to
quickly
tune
a
source
under
test
for
maximum
output
before
measuring
its
power
level
on
the
main
meter.
Fig.
1.1
R.F.
Power
Meter
TF
2502
2502
(1)
3

The
instrument
consists
of
three
separable
items
a
detector
unit,
a
monitor
unit
and
a
terminating
load
and
requires
neither
batteries
nor
mains
supply.
Fig.
1.2
Terminating
load
TM
8544
1.2 DATA SUMMARY
Frequency
range:
Power
ranges:
Accuracy:
Input
impedance:
V.S.W.R.:
Overload
capacity:
Detector
characteristics:
Output
facility:
Temperature
range:
Dimensions
and
weight:
4
Fig.
1.3
Detector
Unit
TM
8723/2
D.
C.
to
1
GHz.
3
Wand
10
W
full-scale.
±5%
of
full-scale.
50 Q
via
type
N
socket.
Better
than
1.
1:1.
20%
continuously.
Up
to
50%
for
periods
up
to
30
s.
(1)
Calibrated
thermocouple
giving
an
approximately
linear
power
scale.
(2)
Uncalibrated
fast
response
diode
detector
operating
down
to
5
MHz.
Jack
provided
for
monitoring
modulation.
+10
octo
+35
oc.
Height
5
1/8
in
(130
mm)
Width
8
5/8
in
(219
mm)
Depth
4
3/4
in
(121
mm)
Weight
3lb
(1.
4 kg)
2502 (1a)

1.3
ACCESSORIES
Supplied
Type
N
free
plug,
M.
I.
code
23443-708;
for
r.
f.
input.
Telephone
plug,
M.
I.
code
23421-610;
for
modulation
output.
Knurled
retaining
ring,
M.
I.
code
33265
-309R,
for
securing
r.
f.
input
connector
during
transit.
2502
(1) 5

Operation
2.1
GENERAL
The
power
meter
has
dual
readout
facilities
- a
large
meter
directly
calibrated
in
mean
power
and
a
small
meter
with
an
arbitrary
calibration
for
use
as
a
fast
response
tuning
indicator.
2.2
CONTROLS
MARCONI INSTRUMENTS
IJD
Fig.
2.1
Layout
of
controls
Q)
Type
N input
socket
accepts
inputs
up
to
60 V
peak.
0
Thermocouple
meter
shows
mean
power
in
50
Q
load.
Near
linear
scales
of
0 to 3 W
and
0
to
10 W
are
selected
by
Range
switch.
0
Power
range
switch
selects
3 W
or
10 W
full-scale
on
WATTS
meter.
0 DIODE
DETECTOR
meter
provides
fast
response
tuning
indication
for
the
source
under
test.
Operates
down
to
5 MHz.
Scale
arbitrarily
engraved
from
0
to
100.
@
Sensitivity
control
adjusts
the
gain
of
the
diode
detector.
The
crescent
symbol
indicates
that
sensitivity
increases
clockwise.
6 2502
(1)

0 INSERT
PROBE
control
adjusts
the
input
to
the
diode
detector.
0 MOD OUT
jack
accepts
2-pole
telephone
plug
for
connection
to
oscilloscope
or
high
impedance
headphones
to
monitor
amplitude
modulation.
2.3
CONNECTIONS
0·223~
:!:
·009"
Fig.
2.2
Cross
section
of
type N
connector
(male)
showing
critical
dimension
A
knurled
retaining
ring
is
fitted
to
the
type N
connector
to
prevent
movement
of
the
detector
unit
during
transit.
Before
using
the
power
meter,
unscrew
this
ring
and
pull
off
the
plastic
cap
from
the
connector.
Keep
both
these
items
for
re-use
if
the
instrument
has
to
be
transported.
!cAUTION
I When
making
connection
to
the
input
socket
it
is
important
to
use
the
free
type
N
connector
supplied
as
an
accessory.
If
another
type N
connector
is
used
then
it
is
essential
to
ensure
good
reliable
mating.
To
achieve
this
the
inner
contact
depth,
i.
e.
the
distance
from
the
shoulder
on
the
pin
to
the
interface
as
shown
in
Fig.
2. 2,
must
be
0.223
in
±0.009
in
(5.92
mm
±0.23
mm)
conforming
to
US
Spec.
MIL-C-71B.
Type
numbers
of
coaxial
cables
suitable
for
use
with
the
plug
are
as
follows:
United
Kingdom:
Amphenol
No.
82-312
Joint
Services
5935-99-943-4155.
United
States:
Military
No.
UG-1185/U.
NOTE:
To
prevent
accidental
interchange
of
parts
with
those
of
other
instruments
in
the
series,
the
following
items
of
the
R.
F.
Power
Meter
TF
2502
are
colour
coded
YELLOW.
In
addition
identification
labels,
bearing
the
same
serial
number,
are
fitted
on
each
of
the
units
which
make
up
the
complete
instrument.
(a)
The
plastic
cover
of
the
detector
unit.
2502 (1a) 7

(b)
The
catch
on
the
terminating
load.
(c)
The
plug
and
socket
of
the
cable
joining
thedetector
unit
and
the
monitor.
2.4
MEASUREMENT
PRECAUTIONS
When
malting
a
measurement,
the
following
points
should
be
borne
in
mind:
1)
Ideally,
the
impedance
presented
by
the
power
meter
to
a
transmitter
under
test
should
be
purely
resistive.
In
practice,
the
power
meter
impedance
will,
inevitably,
include
a
small
reactive
component
which
will
be
reflected
back
into
the
transmitter
tuned
output
circuit,
partially
detuning
it.
In
order
to
obtain
a
true
measure
of
the
power
output
capabilities
of
a
transmitter,
its
output
stage
should
always
be
tuned
to
produce
maximum
indication
on
the
power
meter.
2)
In
circumstances
where
the
power
meter
is
required
for
use
merely
as
a
terminating
device,
it
is
better
to
make
connection
directly
to
the
terminating
load
as
this
presents
a
particularly
high
quality
resistive
termination
having
a
v.
s.
w.
r.
of
about
1.
04.
To
remove
the
load
for
this
purpose
see
Sect.
2.
6.
3)
Because
of
the
time
lag
in
thermocouple
heating,
and
the
low
resistance
of
the
meter
circuit,
wait
a few
seconds
before
reading
the
power.
4)
The
peak
voltage
that
can
be
applied
to
the
power
meter
is
limited
by
the
in-
line
detector
insulation;
this
is
rated
to
withstand
60 V
peak,
which
exceeds
the
peak
voltage
of
a 100%
sine
wave
amplitude
modulated
signal
of
10 W
mean
power.
5)
In
the
event
of
long-term
storage
in
conditions
of
extreme
humidity,
check
50
Hz
calibration
before
use
(refer
to
Sect.
5. 4).
If
necessary,
dry
out
by
placing
the
power
meter
in
an
oven (+50
°C
to +70 °C)
for
at
least
one
hour.
2.5
MAKING
POWER
MEASUREMENTS
To
make
a
power
measurement
proceed
as
follows:
1)
Set
the
Range
switch
to
suit
the
expected
power
level
of
the
source.
If
this
is
unknown,
use
the 10 W
position
as
a
precaution.
2)
Turn
the
INSERT
PROBE
and
Sensitivity
controls
fully
counter-clockwise.
3)
Connect
the
source
under
test
to
the
Input
socket
and
note
the
reading
on
the
DETECTOR
meter.
Bring
this
reading
to
about
half
scale
by
turning
up
the
Sensi-
tivity
control.
If
this
is
insufficient,
turn
the
INSERT
PROBE
control
clockwise.
NOTE:
If
the
probe
is
inserted
too
far,
the
v.
s.
w.
r.
of
the
instrument
may
increase.
Do
not
insert
it
until
the
Sensitivity
control
is
at
maximum.
8 2502 (1a)

4)
Tune
the
source
under
test
for
maximum
reading
on
the
DETECTOR
meter.
5)
If
the
probe
was
inserted
in
(3)
above,
turn
the
INSERT
PROBE
control
back
to
its
fully
counter-clockwise
position.
Then
read
the
power
of
the
source
on
the
WATTS
meter.
2.6
REMOTE
OPERATION
If
the
power
meter
has
to
be
connected
directly
to
the
power
source
it
may
be
inconvenient
to
read
or
operate
the
instrument.
If
so,
it
may
be
better
to
use
it
with
the
detector
unit
and
load
detached
from
the
monitor
unit.
To
do
this,
pull
out
the
INSERT
PROBE
knob
to
disengage
the
dog
clutch,
depress
the
catch
on
the
ternunating
load
and
withdraw
the
load
and
detector
assembly
as
far
as
the
interconnecting
lead
will
allow.
Operation
is
the
same
as
in
Sect.
2. 5
except
that
probe
insertion
is
controlled
directly
by
the
slotted
knob
on
the
detector
unit.
2.7
DETERMINATION
OF
MODULATION
DEPTH
The
depth
of
amplitude
modulation
of
an
r.
f.
signal
having a
sinusoidal
envelope
can
be
determined
as
follows:
1)
Measure
the
output
power
of
the
source
under
test
with the
signal
unmodulated.
Let
this
reading
be
Pc
watts.
2)
Modulate
the
signal
and
again
measure
the
output
power.
Let
this
reading
be
Pm
watts.
3)
Calculate
the
modulation
depth.
This
can
be
evaluated
since
P
c,
P
m,
and
the
%modulation,
m,
are
related
by
2502 (1a)
pm p c
m2
(1 +
2)·
.................... (1)
9

Transposing
and
simplifying,
equation
(1)
gives
m
Example:
From
measurements,
it
is
found
that
1. 1
Wand
Pm
= 1. 5 W
Hence
from
equation
(2) J2
(1.5
-
1.1)
1 (JJ
m =
x.
001o
1.1
85.5%
10
2501 (1)

DECIBEL CONVERSION TABLE
Ratio
Down
Ratio
Up
VOLTAGE
POWER
DECIBElS
VOLTAGE
POWER
1-0
1·0 0 1 0 1·0
·9886 ·9772
·1
1·012
1·023
·9772 ·9550 ·2 1·023
1·047
·9661
·9333
·l
1·035
1·072
·9550 ·9120 ·4
1-047
1
096
·9441
·8913
·5
1·059 1·122
·9333 ·8710 ·6
1-072
1·148
·9226
·8511
·7
1-084
1·175
·9120 ·8318 ·8 1·096 1·202
·9016 ·8128 . ·9
1-109
1·230
·8913 ·7943 1·0 1·122 1·259
·8710 ·7586
1-2
1-148
1·318
·8511
·7244
H
1·175
1·380
·8318 ·6918 1·6
1-202
1·445
·8128 ·6607 1·8
1-230
1·514
·7943 ·6310 2·0 1·259 1·585
·7762 ·6026
2-2
1·288 1·660
·7586 ·57
54
2-4
1·318 1·738
·7413 ·5495 2·6 1·349
1-820
·7244 ·5248 2·8
1-380
1-905
·7079 ·5012
l·O
1-413
1·995
·6683 ·4467
3·5
1·496
2·239
·6310
·3981
4·0
1·585
2·512
·59
57
·3548
4-5
1·679
2·818
·5623
·3162
S·O
1-778
3·162
·5309 ·2818 5·5
1·884
3·548
·5012 ·2512 6
1·995
3·981
·4467
·1995
7
2·239
5·012
·3981
·1585
8
2·512
6·310
-3548
·1259 9
2·818
7·943
·3162
·1000
10
3·162
10·000
·2818 ·07943
11
3·548 12·59
·2512 ·06310
12
3·981
15·85
·2239 ·05012
13
4-467
19·95
·1995
·03981
14
5·012
25·12
·1778
·03162
15
5·623
31-62
2501 (1)
II

DECIBEL
CONVERSION
TABLE
(continued)
Ratio
Down
Ratio
Up
VOLTAGE
POWER
DECIBELS
VOLTAGE
POWER
·1585 ·02512
16
6·310 39·81
·1413 ·01995 17 7·079 50·12
·1259 ·01585
18
7·943 63·10
·1122 ·01259
19
8·913 79·43
·1000 ·01000
20
10·000 100·00
·07943 6·310 X 10-3 22 12·59 158·5
·06310
3·981
X 10-'
24
15·85 251·2
·05012 2·512 X 10-'
26
19·95 398·1
·03981 1·585 X 10 3
28
25·12 631·0
·03162 1·000 X 10 3
30
31-62 1,000
·02512 6·310 X 10 4
32
39·81 1·585 X 103
·01995
3·981
x 1
o-•
34
50·12 2·512 X 103
·01585 2·512 X 10-4
36
63·10 3·981 X 103
·01259 1·585 x 1
o-•
38
79·43 6·310 X 103
·01
000 1·000 X 10 4 40 100·00 1·000 X 104
7·943 X 10-3 6·310 X
10-s
42
125·9 1·585 X
10'
6·310 X 10-'
3·981
X 1
o-s
44
158·5 2·512 X 104
5·012 X 10-' 2·512 X 1
o-s
46
199·5 3·981 X 104
3·981
X 10 3 1·585 X
10-s
48
251·2 6·310 X 104
3·162 X 10-3 1·000 X
10-s
50
316·2 1·000 X 105
2·512 X 10 3 6·310 x 1o-•
52
398·1 1·585 X 105
1·995 X 10-'
3·981
x 1
o-•
54 501·2 2·512 X 105
1·585 X 10-' 2·512 X 10 6
56
631·0 3·981 X 105
1·259 X 10-' 1·585 X 10-'
58
794·3 6·310 X 105
1·000 X 10 3 1·000 X 10-'
60
1,000 1·000 X 106
5·623 x 1
o-•
3·162 X 10-7
65
1·778 X 103 3·162 X
10'
.3·162 x 1
o-•
1·000 X 10-7
70
3·162 X 103 1·000 X 107
1-778 X 10 4 3·162 X
10-a
75
5·623 X 103 3·162 X 107
1·000 x 1o-• 1·000 X 10 8
80
1·000 X 104 1·000 X 108
5·623 X 10-s 3·162 X 10-'
85
1·778 X 104 3·162 X 108
3·162 X 1
o-s
1·000 X 10-'
90
3·162 X 104 1·000 X
10'
1·000 X
10-s
1·000 X 10-10
100
1·000 X 105 1·000 X 1010
3·162 X 10-6 1·000 X 10-
11
110
3·162 X 105 1·000 X 10
11
1·000 X 10 6
1·Q00
X 10-12
120
1·000 X
10'
1·000 X 1012
3·162 X 10-7 1-ooo x 1o-"
130
3·162 X 106 1·000 X 1013
1·000 X 10-7 1·000 X 10-14
140
1·000 X 107 1·000 X 1014
12
2502 (1)

Technical description
3.1
CIRCUIT
ANALYSIS
R.
F.
Power
Meter
TF
2502
consists
of
an
in-line
thermocouple
detector,
a
diode
detector
and
a
terminating
load
as
shown
in
Fig.
3.1.
IN-LINE
DETECTOR
with
THERMO-ELEMENT
L~------~~'~"-A_D------~--.
;
~
TC1
THERMOCOUPLE
M2
lWATTSl
Fig.
3.1
Functional
diagram
of
r.f.
power
meter
A
smallpercentage
of
tlie
incident
power
is
absorbed
by
the
heater
of
the
thermo-
couple
and
the
resultant
rise
in
temperature
is
monitored
by
a
series
of
bimetallic
junctions,
TCl.
The
thermo~electric
e.
m.
f.
thus
produced
is
then
measured
by
a
d.
c.
millivoltmeter,
M2,
calibrated
in
terms
of
total
power
in
watts.
Power
applied
to
the
thermo-element
produces
a
current,
I,
in
the
heater
resistance,
R5,
with
a
resultant
heat
dissipation
of I2R5.
The
thermocouple
output
voltage
is
consequently
proportional
to
12
since
its
e.
m.
f./
temperature
response
is
nearly
linear.
Hence
the
detector
gives
a d.
c.
output
proportional
to
true
mean
power,
and
independent
of
the
waveform
of
the
power.
The
input
voltage
is
sampled
by
a
capacitance
probe,
rectified
by
diode
MR1
and
monitored
by
meter
M1
which
has
an
arbitrary
0-100
calibration.
Potentiometer
RV3
adjusts
the
sensitivity
of
the
meter.
This
circuit
gives
a
fast-response
indication
and
also
provides
a
demodulated
output
at
the
MOD
OUT
jack,
JKA.
for
external
monitoring.
2502 (1)
13

3.2
DETECTOR
UNIT
The
thermocouple
detector
is
an
in-line
type
consisting
of a
modified
slab
transmission
line
with a
tubular
thin-film
resistive
heater
component
forming
part
of the
centre
conductor.
Four
series
connected
thermocouples
are
mounted
close
to
the
heater
surface.
Beryllia*
cement
is
used
in
this
assembly.
3.3
JW
TERMINATING
LOAD
TM
8587
The
terminating
load
see
Fig.
1.
2 -
is
a
thin-film
component
with a
substrate
made
of
Beryllia*.
This
has
the high
thermal
conductivity
of
aluminium
combined
with
excellent
dielectric
properties
of
an
alumina
ceramic.
It
is
housed
in
a 3 W
heat
sink.
*See
warning
in
Sect.
4.2
14
2501
(1)

Maintenance
4.1
GENERAL
The
circuit
diagram
shows
all
the
electrical
components
contained
in
the
instru-
ment.
The
description
of
these
components
-
their
type,
value,
rating
etc.
-is
given
in Chap.
6,
and
the
layout
of
components
in
the
monitor
unit
is
shown
in
Fig,
4.
1.
Fig.
4.1
Rear
of
front
panel
Screw
fasteners
Screw
threads
used
on
this
instrument
are
of
the
following
sizes:
4BA,
6BA
and
8BA.
Cruciform
head
screws
are
of
the
Pozidriv
pattern;
to
avoid
damaging
them
a
Pozidriv
screwdriver
should
be
used.
2501
(lj
IS

Calibration
The
following
information,
based
on
abstracts
from
the
Company
Test
Schedule,
is
intended
to
enable
you
to
carry
out a
series
of
tests
by
which the
main
points
of
performance
of
the
instrument
can
be
checked;
it
also
gives
details
concerning
adjust-
ment
to
preset
components
and
the
choice
of
value
for
individually
selected
components.
5.1
APPARATUS
REQUIRED
(a)
Resistance
bridge,
e
..
g.
mT
type
TF
2700.
'(b) Signal
generator,
400 MHz
and
1 GHz, 50 Q output;
e.g.
mf
types
TF
801
and
TF
1060.
(c) V. S.
W.
R.
measuring
device,
50 Q
characteristic
impedance
with
residual
v.
s.
w.
r.
of
better
than
1.
01
at
1 GHz.
(d)
Variable
a.
c.
source,
capable
of
delivering
10 W;
e.
g.
a
Variac.
(e)
Dynamometer
wattmeter,
0 to 10 W,
0.5%.
5.2
PRELIMINARY
CHECKS
(Apparatus
required:
item
a)
NOTE: When
carrying
out
these
checl{s,
it
is
advisable
to
set
the
Range
switch
to 10 W
to
avoid
the
possibility
of
overloading
the
meter.
1)
.
Connect
the
termi,nating
load
and
measure
the
·cold d.
c.
resistance
of
the
terminating
load
(R4)
between
the
centre
and
outer
conductors
of
the
socket
(SKTB).
The
resistance
should
be
49 Q ±2%.
2)
Measure
the
resistance
of
the
complete
power
meter
(i.e.
,
in-line
detector
and
the
terminating
load)
between
the
centre
conductor
of the input
socket
SKTA and
chassis.
The
resistance
should
be
53
Q ±3%.
5.3
STANDING
WAVE
RATIO
(Apparatus
required:
items
b
and
c)
For
the
power
meter
to
act
as
a good
match
to a
transmission
line
its
v.
s.
w.
r.
must
be
as
close
to
unity
as
possible.
In
the
TF
2502, v.
s.
w.
r.
is
a function of
the
2502 (1a)
17

general
configuration
and
spacing
of
the
transmission
line,
and
no
provision
is
made
for
adjustment.
The
validity
of
subsequent
calibration
steps
is
dependent
on
verifi-
cation
of good v.
s.
w.
r.
over
the
full
frequency
range.
During
manufacture
a
sweep
frequency
method
is
used
to
achieve
this,
but
another
method
can
be
used
if
tests
are
made
at
a
sufficient
number
of
frequencies.
Connect
the
v.
s.
w.
r.
measuring
device
to
the
socket
on
the
terminating
load·
and
check
the
v.
s.
w.
r.
at
a
selection
of
frequencies
up
to
1 GHz.
The
v.
s.
w.
r.
should
be
better
than
1.
05
over
the whole
frequency
range.
With
the
INSERT PROBE
control
fully
counter-clockwise,
connect
the
v.
s.
w.
r.
measuring
device
to
the
power
meter
input
socket
and
check
the
v.
s.
w.
r.
of
the
combined
terminating
load
and
in-line
detector
at
a
selection
of
~requencies
up
to
1 GHz.
The
v.
s.
w.
r.
should
be
better
than
1.1
over
the
whole
frequency
range.
5.4
CALIBRATION
ACCURACY
AT.L.F.
(Apparatus
required:
items
d
and
e)
The
power-reading
accuracy
is
best
checked
at
a low
frequency
-
usually
the
frequency
of
the
local
power
supply -
and
then
compared
with
that
·of a
standardized
mean-reading
power
meter
near
the
upper
limit
of
the
frequency
range.
1)
Connect
the
dynamometer
wattmeter
between
the
a.
c.
supply
and
the
power
meter
under
test.
The
current
and
voltage
coil
connections
should
be
arranged
for
minimum
error
due
to
internal
losses,
and
allowance
should
be
made
for
the
error
if
it
is
appreciable.
Owing
to
the
frequency
response
limitations
of
dynamometer
wattmeters
the
a.
c.
supply
must
have
low
distortion
(less
than
1
%)
.
2)
Set
the
Range
switch
to
10
Wand
set
the
power
input
until
the
dynamometer
indicates
the
input
figure
given
on
the
label
at
the
rear
of
the
instrument.
3)
Check
that
the
TF
2502
reading
is
8 W ±0.
5%,
if
not
adjust
RV1
until
it
is
correct.
4)
Reduce
the
applied
power
to
zero
and
allow
sufficient
time
for
the
thermocouple
to
cool.
5)
Set
the
Range
switch
to
3 W and
set
the
power
input
until
the
dynamometer
indicates
the
input
figure
given on the
label
at
the
rear
of
the
instrument.
6)
Check
that
the
TF
2502
reading
is
2. 5 W ±0. 5%,
if
not
adjust
RV2
until
it
is
correct.
16
2502
(1)

5.5 CALIBRATION ACCURACY
AT
R.F.
Calibration
is
difficult
at
r.
f.
since,
unless
great
care
is
taken
with
impedance
matching,
substantial
errors
can
be
introduced.
If
it
is
essential
to
make
checks
at
r.
f.
,
then
connections
should
be
made
with a wide
band
directional
coupler
having
a
directivity
of
at
least
35 dB
and
the
power
level
monitored
with a low
level
power
meter.
Such
an
arrangement
must,
of
course,
be
calibrated
by
reference
to
a
standard
power
meter.
NOTE
If
either
a
terminating
load
or
a
detector
unit
is
to
be
returned
to
Marconi
Instruments
for
repair
or
recalibration,
it
is
important
to
send
the
complete
detector
/load
assembly.
This
will
enable
the
item
to
be
recalibrated
as
an
assembly,
which
will
ensure
a
better
performance,
e.g.
v.
s.
w.
r.
and
fre-
quency
response,
than
can
be
obtained
by
recalibrating
the
detector
and
load
separately.
2502
(la)
19

Table of contents
Other Marconi Instruments Measuring Instrument manuals
Popular Measuring Instrument manuals by other brands

Rohde & Schwarz
Rohde & Schwarz R&SHMC8012 user manual

FAURE HERMAN
FAURE HERMAN FH8400 user manual

Keysight Technologies
Keysight Technologies B2980A Series Demo guide

mru
mru SWG 100 biogas user manual

Keba
Keba KeContact E10 Configuration guide

Shortridge Instruments
Shortridge Instruments FLOWHOOD AIRDATA CFM-88 operating instructions