Mersen CL-Profiler User manual

Safety Instructions
This device is safe and complies with the current regulations. If, however
the device is used for purposes other than those intended or operated by
unskilled personnel, risk of serious/life threatening injury may occur!
The below instructions must be strictly followed
1. Read the enclosed documentation before using the device for the
first time. All safety regulations included in the enclosed manual
must be complied with.
2. This device may only be operated by specially trained personnel.
The customer must ensure that unauthorised personnel do not ap-
proach the machine on which the device is being used.
3. This device may only be used for the intended purposes.
4. The customer is not allowed to make any modifications on the de-
vice unless prior written approval given by Mersen France Amiens.
5. The device must not be used in case of deterioration or in case of
lack of maintenance. Mersen France Amiens may not be held re-
sponsible of any damage and/or injury if the customer does not fully
comply with these safety instructions.
MEASURING TOOLS
CL-Profiler Operating
Instructions

CL-Profiler operating instructions page 2 of 15
www.cl-profiler.com
CL-Profiler operating instructions
Table of contents
I) Introduction.................................................................................. 3
II) Computer Installation ................................................................... 3
1) Computer requirements .............................................................. 3
2) Software installation................................................................... 3
III) Registration................................................................................ 4
IV) Software use............................................................................... 5
1) Language selection..................................................................... 5
2) Settings .................................................................................... 5
a - General ................................................................................. 5
b - Own logo............................................................................... 6
c – ViRoTi................................................................................... 6
d – CL-profiler software update ..................................................... 6
3) Linear measurement................................................................... 7
a - Slider.................................................................................... 7
b - Y-scale.................................................................................. 7
c - Recording .............................................................................. 7
d - Save data.............................................................................. 8
e - Printing ................................................................................. 8
f
- Graph ................................................................................... 8
g - Cursors ................................................................................. 9
4) Bar to bar measurement ............................................................. 9
5) Open saved files ...................................................................... 10
6) Measuring Analysing................................................................. 10
a - Add Curves.......................................................................... 11
b - Curve’s position ................................................................... 11
d - X-Scale ............................................................................... 11
e - Export to Excel..................................................................... 11
f
- Other buttons ...................................................................... 12
7) ViRoTi tool .............................................................................. 12
a – How to use.......................................................................... 13
V) Maintenance .............................................................................. 14
VI) Warranty .................................................................................. 14
VII) Technical data.......................................................................... 15
VIII) Contact information ................................................................. 15

CL-Profiler operating instructions page 3 of 15
www.cl-profiler.com
I) Introduction
CL-Profiler is an instrument that must be used in combination with a PC,
laptop or mini-PC. The instrument records movements of a probe as a
function of time. CL-Profiler is usable for different profile applications but
is specially developed for commutators and slip rings profiling.
II) Computer Installation
1) Computer requirements
- Computer with Windows 2000, XP, VISTA or Windows 7.
- Minimum 100MB free disk space.
- Minimum 512MB RAM memory.
- One or two free USB ports. We strongly recommend not to use a USB
hub, since it will decrease the sensor performance (add noise).
2) Software installation
Only connect the device to the USB port AFTER software installation. The
reason is that the USB driver must be installed first.
Run the setup file which is provided on CD or downloaded it on
www.cl-profiler.com (see downloads). After installing, the computer must
be restarted.
The device is ready to be used.
For users with administrator limitations;
-the USB plug of CL-Profiler must now be connected to the USB
port of the PC to activate the USB driver.
-Let Windows search for a driver.
-CL-profiler is now ready to be used.
-The file “CL-profiler” on C drive should not be limited.

CL-Profiler operating instructions page 4 of 15
www.cl-profiler.com
III) egistration
To start the CL-
Profiler software, click on the Windows start menu, go to
“programs” and select “CL-
Profiler”. You can also use a shortcut on the
desktop. If the software is unregistered a pop-up will appear for registra-
tion
For registration, one needs to have access to the internet to obtain an in-
stallation code, this can be done on any computer. If you are unable to
register at this time, you can click on the button “cancel after xx sec” at
the moment that it changes to “Register later”.
To obtain an installation code, click on the button “Register software” and
go to http //www.cl-profiler.com/registration.aspx
Enter all your information on the web page. The registration site will send
the installation code to your e-mail address.
Once you receive the installation code by e-mail, click on the button “Reg-
ister software…”, a new window will appear
Enter all your personal information, exact the same as on the web page,
and make sure the CL-
Profiler is connected to the computer. Now click on
“Register”.
Note: the registration is based on your personal information and the CL-
Profiler serial number.
When connecting a different CL-
Profiler, registration must be done again.
CL-Profiler operating instructions page 5 of 15
www.cl-profiler.com
IV) Software use
To start the CL-Profiler software, click on the Windows start menu, go to
“Programs” and select “CL-
Profiler”. If installed, You can also use the
shortcut on the desktop.
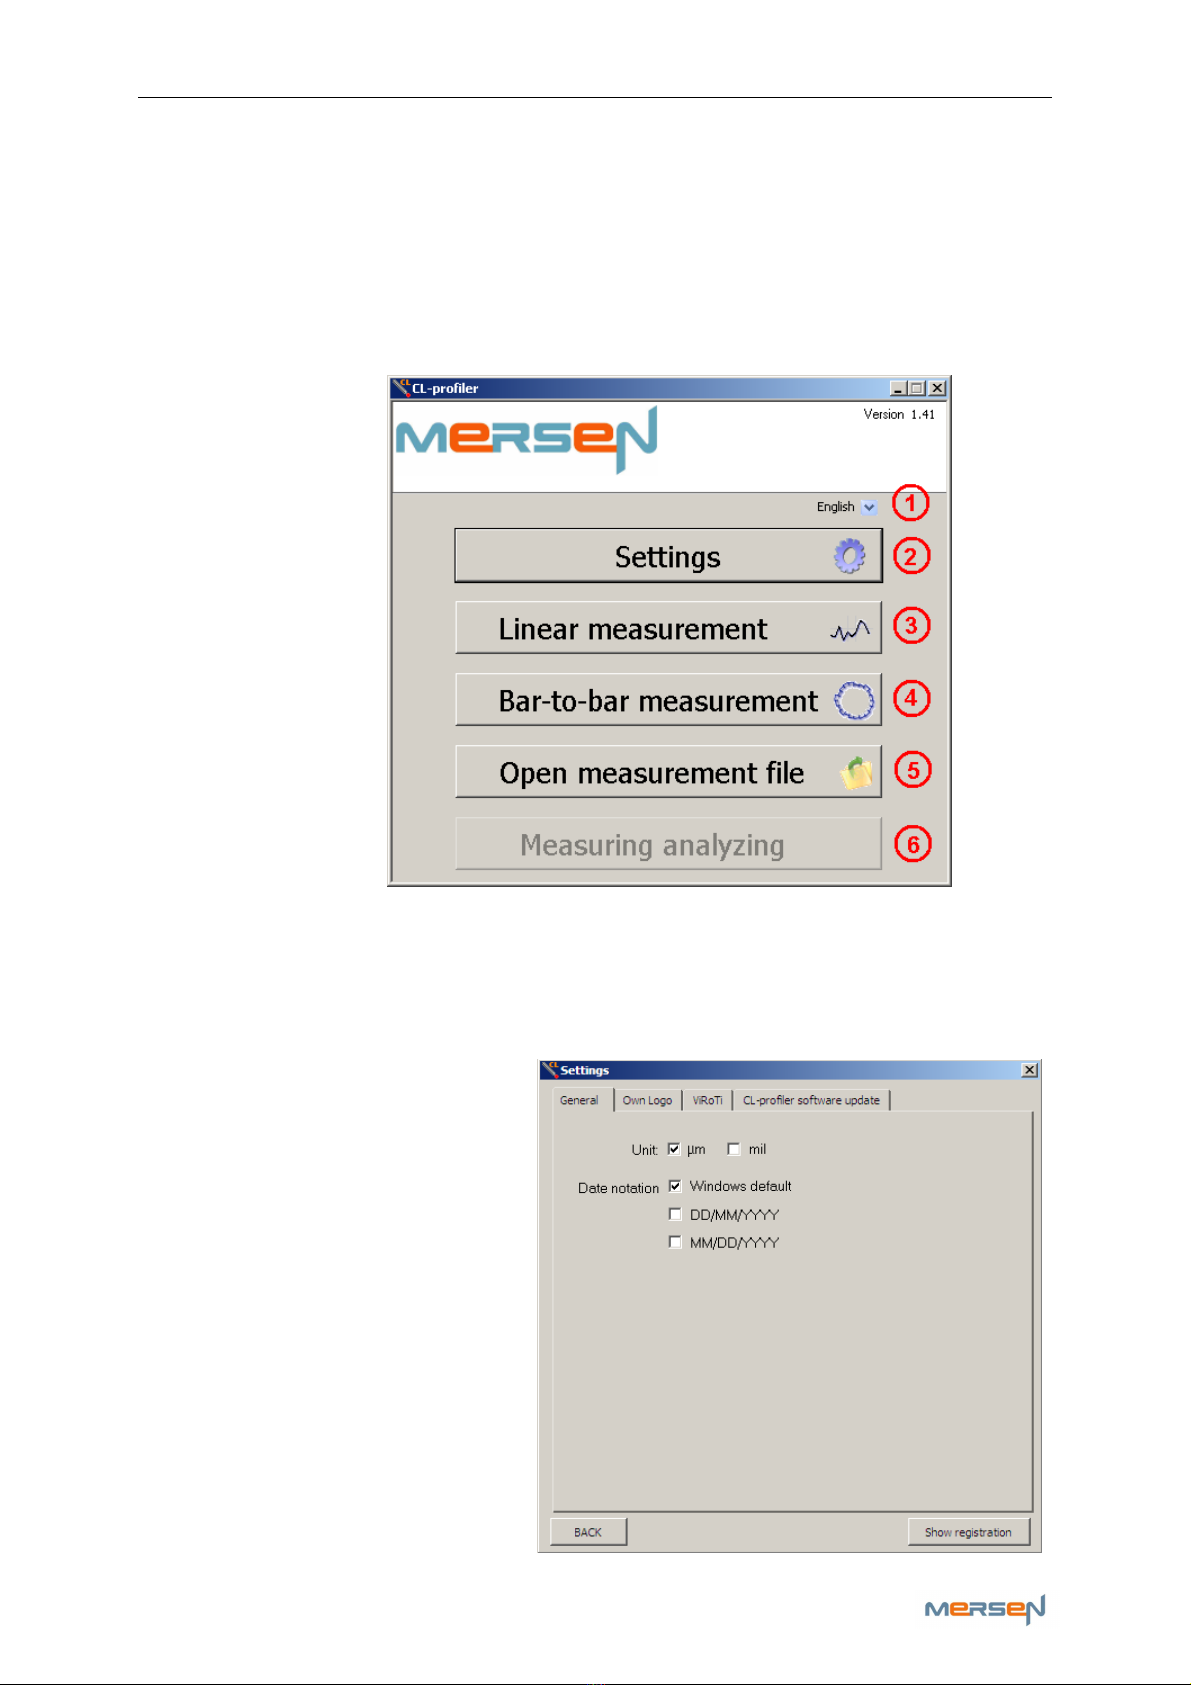
The main screen looks as follows
1) Language selection
First select your language via menu (1). If your language is not listed,
contact Mersen France Amiens to check if it can be made available.
2) Settings
Click on button (2) to open the
settings screen, a new window
pops up
a - General
Adjust the various settings to
your preferences. Click on the
“BACK” button to close the
window.
Click on “Show registration” to
confirm who’s name the soft-
ware is registered to.
CL-Profiler operating instructions page 6 of 15
www.cl-profiler.com
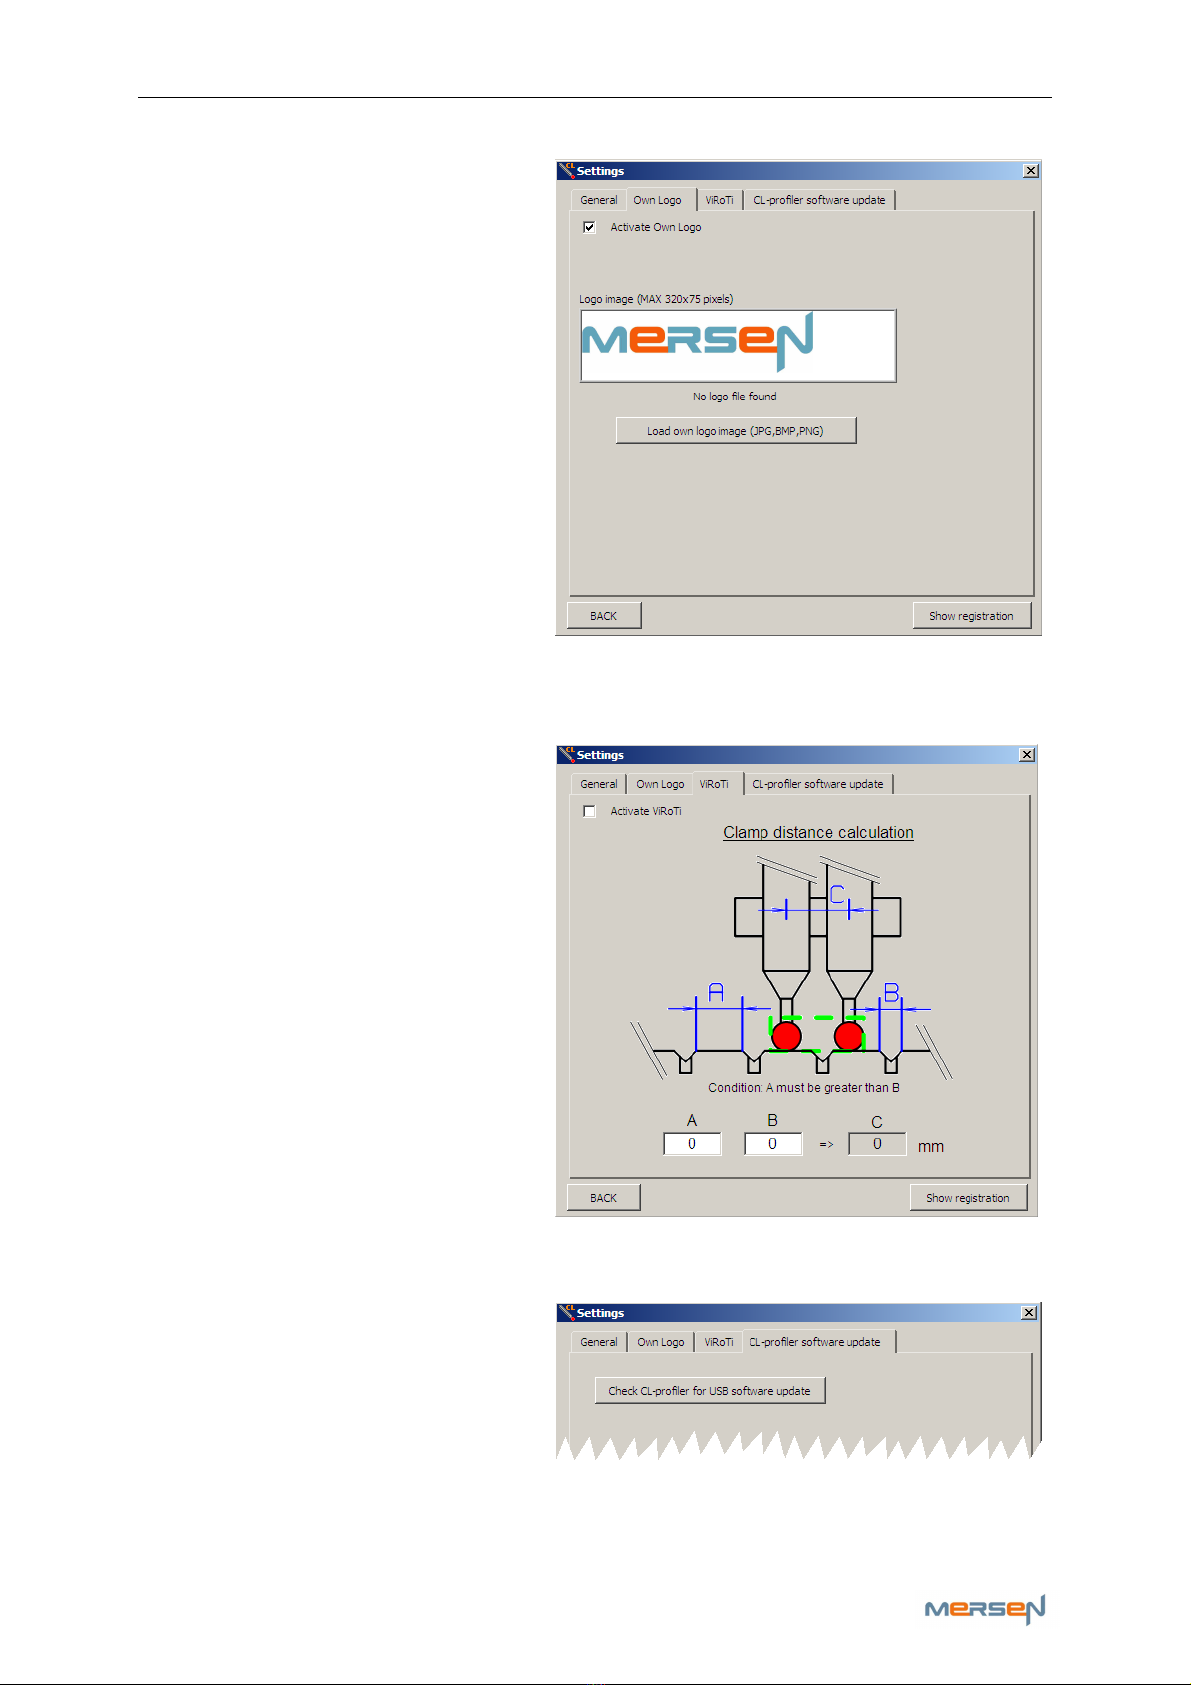
b - Own logo
Click the tab ‘Own Logo’.
In here you have the possibility
to personalize the software with
your own logo.
This logo appears on the main
menu and the reports.
Wink the box ‘Activate Own
Logo’
You can load your logo by click-
ing the ‘Load own logo image
(JPG,BMP,PNG)- button’ and
browsing for your image.
Make sure the image of your
logo does not exceed the measurements 320x75 pixels, in order to get a
complete view of your image.
c – Vi oTi
ViRoTi stands for Virtual oller
Tip and is used to profile
grooved slip rings and commu-
tators. (Please check Chapter 7
on p.12 for more info)
To use the ViRoTi tool, wink ‘Ac-
tivate ViRoTi’.
In field A (the measure part) &
B (the wide of the groove in-
cluding the chamfer) you can fill
in the distances to let the soft-
ware calculate the necessary
distance for your clamp (C).
d – CL-profiler software update
To update the software of your
probe(s) , click the ‘Check CL-
profiler for USB software up-
date’. If necessary the probe
will then automatically update.
ATTENTION do not disconnect the probe during updating, this could
cause irreversible damage to the software remaining in a limbo state.
CL-Profiler operating instructions page 7 of 15
www.cl-profiler.com
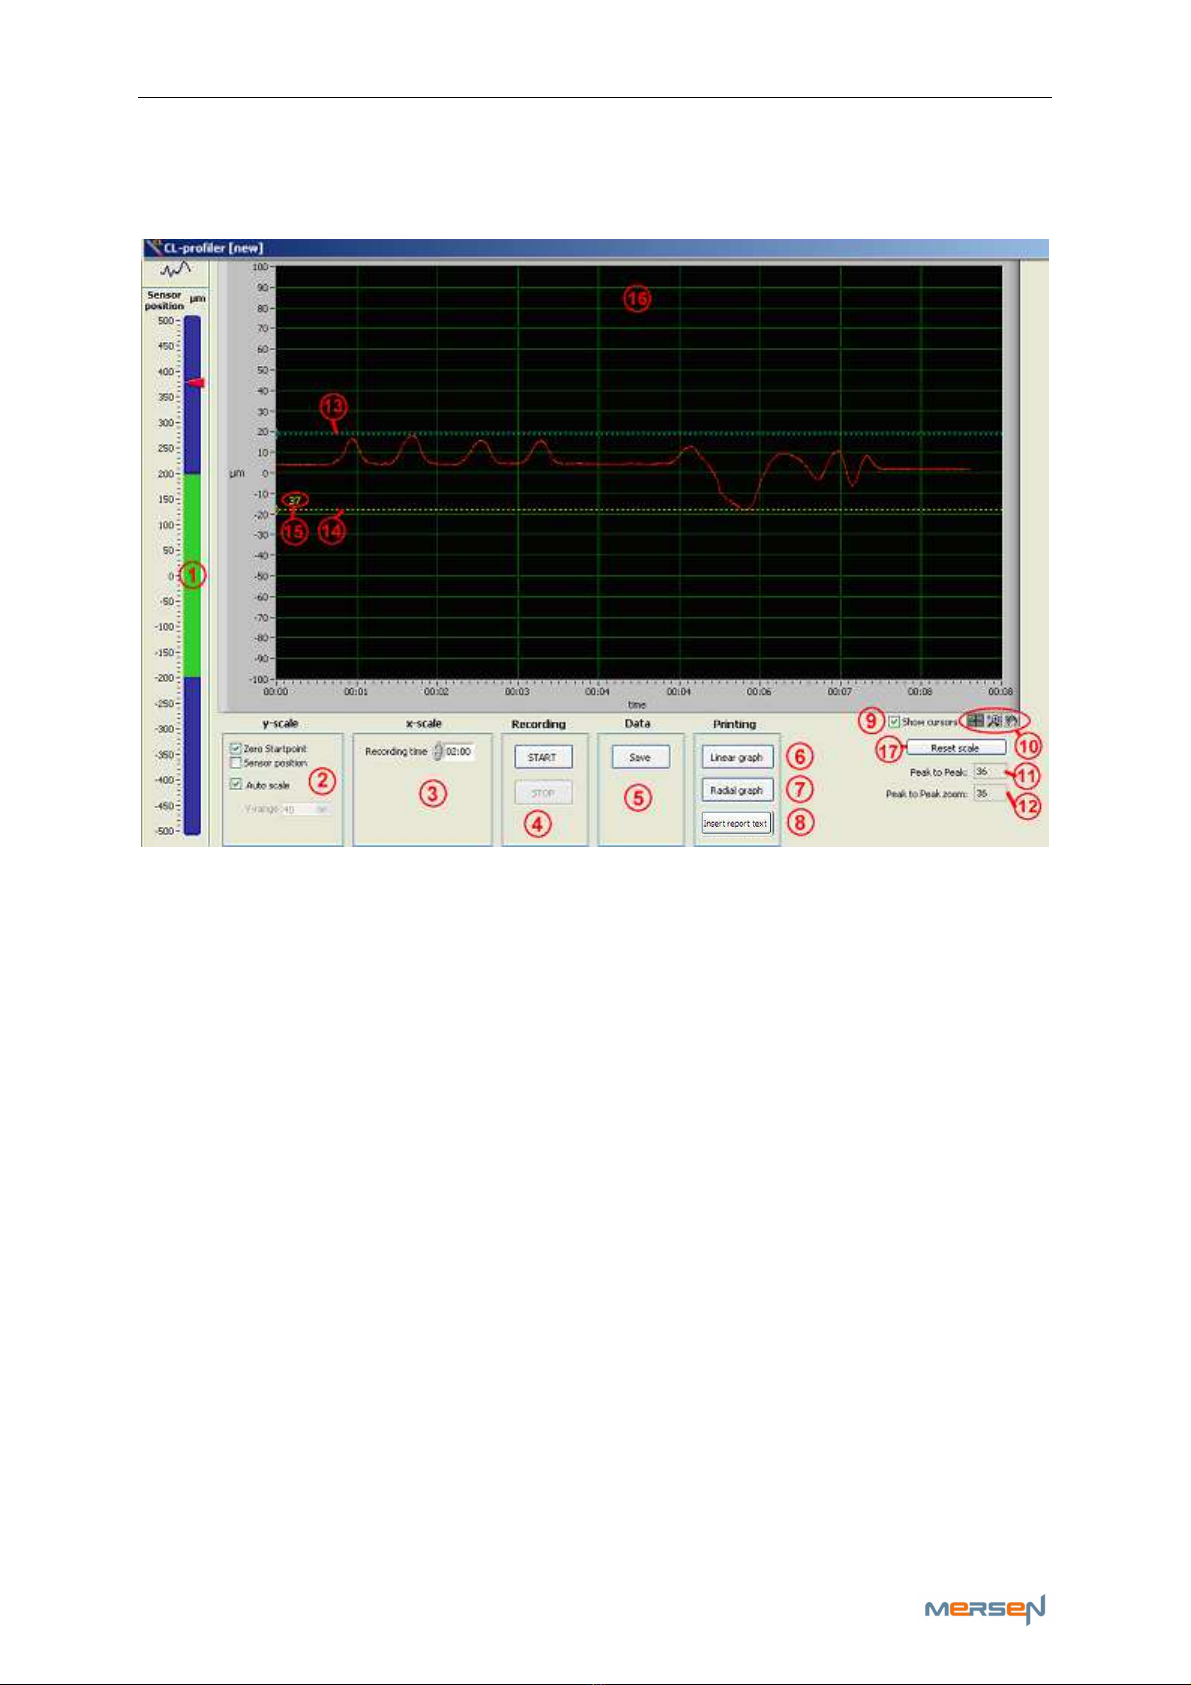
3) Linear measurement
Click on button (3) to open the linear measurement screen
a - Slider
On the left side, the slider (1) indicates the current location of the sensor,
in the centre or at the end of the range. The scale will become narrower
when the middle point (zero) is approached. It is better to move the sen-
sor close to the zero point since the sensor has lower noise around it.
b - Y-scale
There are several settings for setting the Y-scale (2). Select “Zero Start-
point” or “Sensor position” (is absolute value). “Zero Startpoint” will use
the start point as zero value when recording starts. When recording stops,
the y-scale will be adjusted so that the zero point is middle between
maximum and minimum.
Auto scale will make the scale of the graph (16) fit to the running meas-
urement. If auto scale is disabled, one can select the range of the Y-scale
by means of the menu “Y-range”.
c - ecording
The recording time (3) determines how long the signal will be recorded. A
running measurement can always be interrupted with the “STOP” button
(4).
CL-Profiler operating instructions page 8 of 15
www.cl-profiler.com
To start or stop recording, click on the “START” or “STOP” buttons (4).
When recording is busy, a red blinking indicator is shown on the bottom
right hand side of the screen.
d - Save data
When a measurement is finished, it can be saved with the “Save” button
(5). A new window will pop-up which allows you to enter some additional
information about the measurement (machine name…). Also note that the
scale information is saved together with the data. If one zooms in to a
part of the graph (see further), that scale position is also saved.
e - Printing
For the linear measurement there are two reports available, the “Linear
graph” (6) and the “Radial graph” (7). These reports can be printed or
saved as JPEG files so that they can be included in your own reports. Make
sure a printer is installed before attempting to print.
Measurements can also be transferred to a different computer with a USB
stick.
Before printing, one can add additional information that belong to this
measurement by clicking on “Insert report text” (8). This is the same text
as in the pop-up window when saving the data.
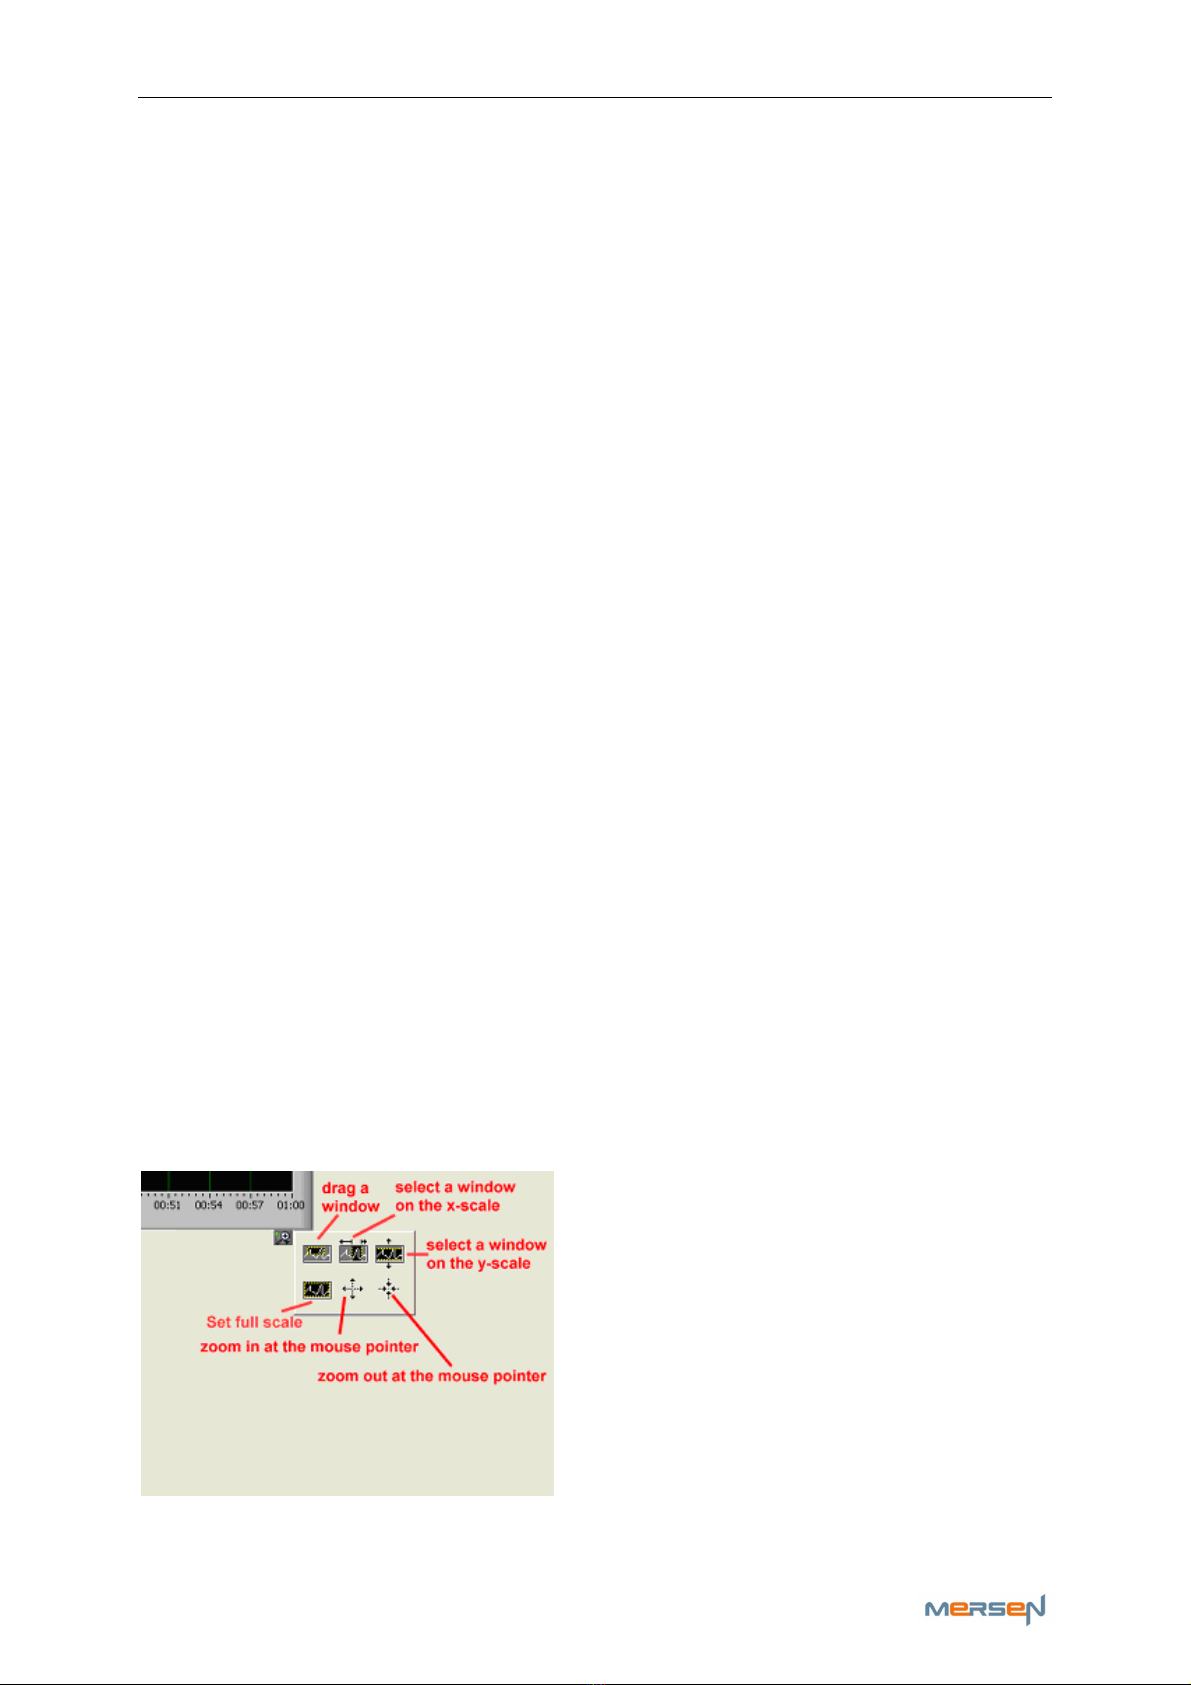
f - Graph
The graph (16) shows the current measurement. It is possible to zoom in,
on a part of the graph. This way one can, for example, take only that
piece of the X-scale that contains useful data. For example, if two rota-
tions of a device under test are recorded, you can zoom into a part so that
you get the data of only 1 rotation. When printing, only the part in which
you were interested will be printed.
The ZOOM tools are located above (10). Click on the magnifying glass to
see new options appear

CL-Profiler operating instructions page 9 of 15
www.cl-profiler.com
Click on button (17) “Reset scale” to reset the scale like it was before
modification.
The peak to peak indicator (11) shows the difference between maximum
and minimum of the whole curve. The “peak to peak zoom” indicator (12)
shows the difference between maximum and minimum of the zoomed area
(in the example it’s the same).
g - Cursors
When activating the selection “Show cursors” (9), two cursor lines will ap-
pear on the screen a blue (13) and a yellow (14) horizontal line. They are
useful for determining the difference between 2 points. The number (15)
at the yellow cursor shows the difference. For moving the cursor lines,
first select the cursor tool in the zoom palette, then move the mouse over
the blue or yellow cursor and click on to grab it.
Then you can drag it up or down.
The cursors will also be shown on the reports.
4) Bar to bar measurement
On the main screen click on button (4). A new window appears looking
very similar to the previous paragraph 3) Linear measurement. We will
only explain the difference.
Instead of a recording time there is now a setting “number of bars” (1).
While recording, the software tries to detect the bars by the peaks that
appear when the sensor jumps down between two successive bars. It is
important that the speed of the rotor is not too high, to be able to meas-
ure these peaks and bar values correctly. Limit the rotating speed to a
maximum of 30 bars per second. An indicator on the top of the graph will
show the speed. It is green when the speed
is OK, orange when it gets high, and red

CL-Profiler operating instructions page 10 of 15
www.cl-profiler.com
when it’s too high. If the speed is too high, it will be impossible to save
the data because it is not reliable.
During recording, the graph shows the real time sensor value, which also
includes the peaks between the bars.
Once recording is finished, the software will try to find the bars and show
one value for each bar. The curve is then converted from a flowing line to
a step-wise presentation, where each step represents a bar.
In the bar to bar measurement there are also 2 reports available, the Lin-
ear and Radial report. The bars can be represented in a circular plot (ra-
dial) or in linear fashion.
5) Open saved files
On the main screen, click on “Open measurement file’” (5) to open data
that was previously saved. When the data is shown, it is represented in
the graph exactly as it was when it was saved. The whole graph is in-
cluded in the data, also if one zoomed in, into a smaller part of the graph
when it was saved.
The tools and reports are the same as in previous paragraphs.
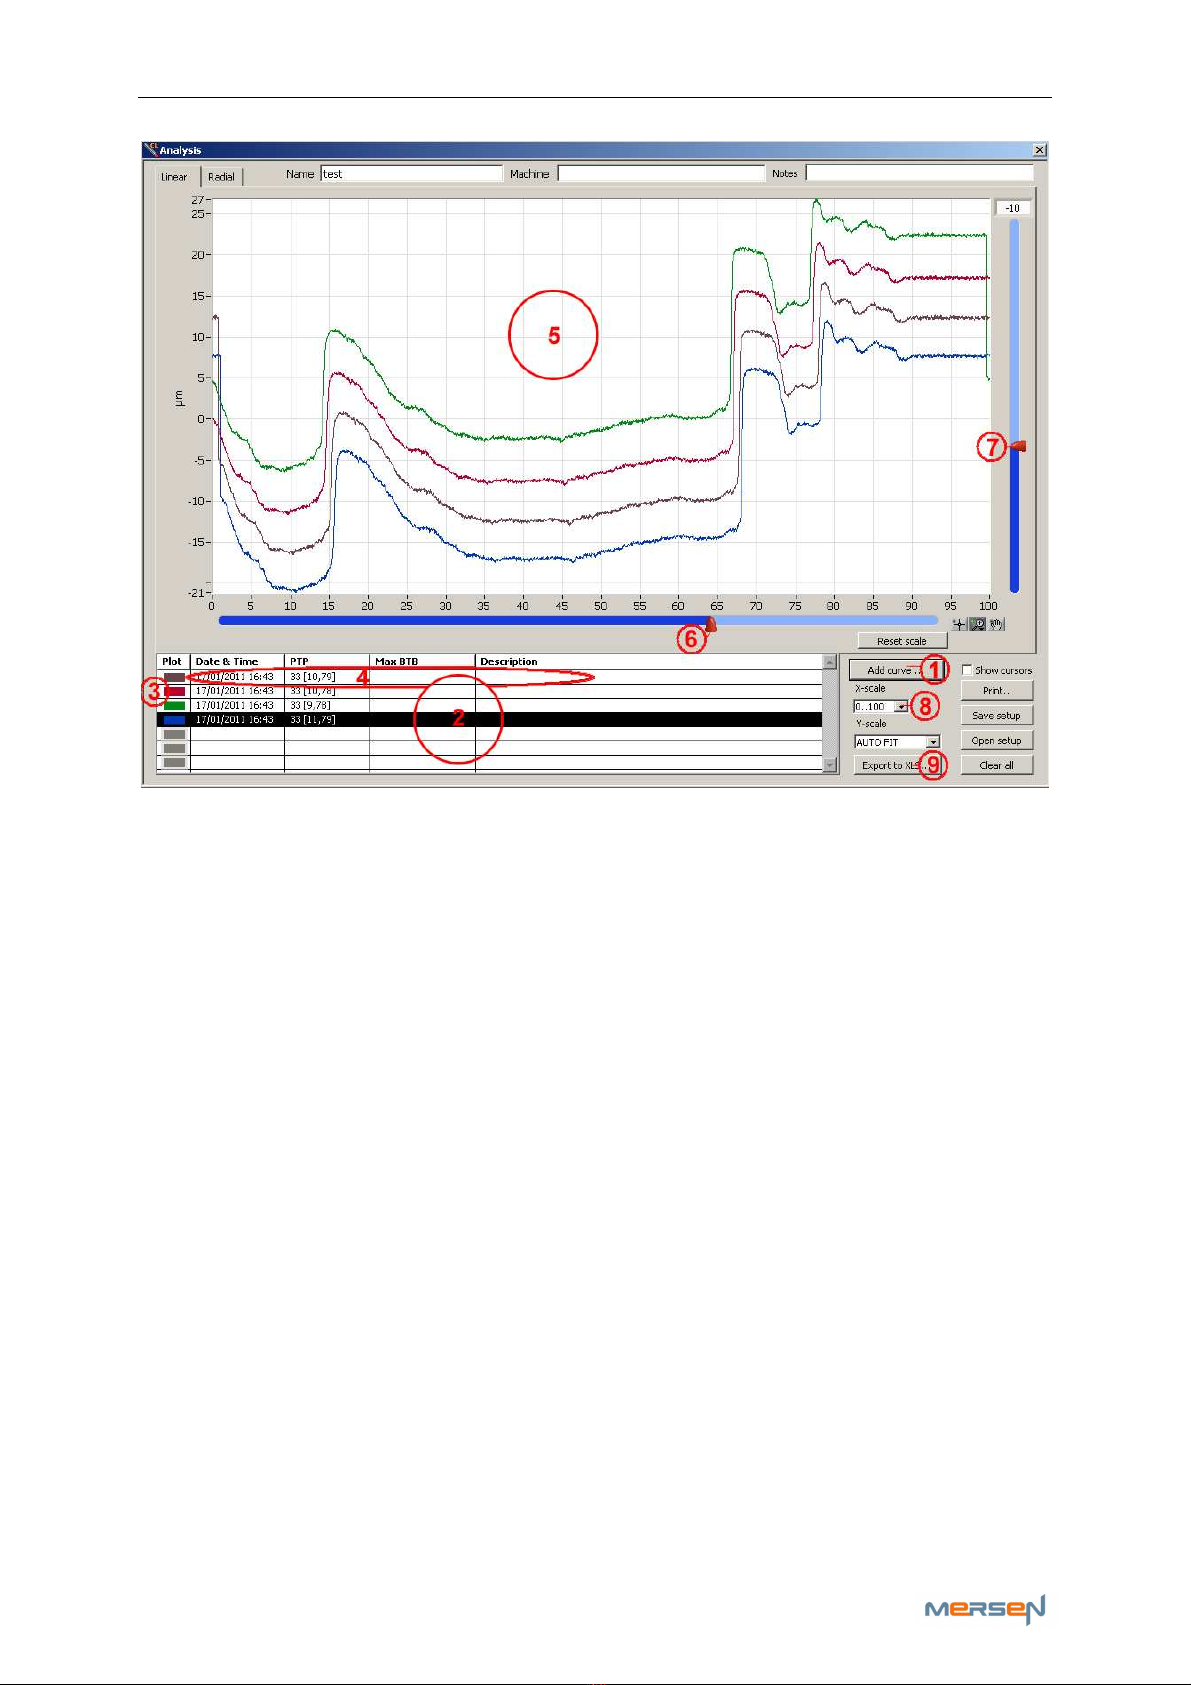
6) Measuring Analysing
Click on button (6) in the main screen to open the additional measuring
analysing screen, a new window pops up
Fill in your ‘analysis registration
code’ and click “Register” to ac-
cess this additional tool.
This tool contains extra add-on functions for analysing and comparing re-
corded curves.
CL-Profiler operating instructions page 11 of 15
www.cl-profiler.com
a - Add Curves
Press ‘Add curve’ (1) to add new curves. They will appear in the small
window on the left (2). You have the possibility to add up to a maximum
of 10 curves.
You can change the color of your curve [click (3)] and change the descrip-
tion or remove the curve by double clicking on the curve’s information
zone (4).
b - Curve’s position
You can change the curve’s position in window (5) by selecting the specific
curve in window (2) [click to select], and then adjust the sliders (6) and
(7). This way we can, for example, compare a previous measurement with
a more recent one at the same starting point.
d - X-Scale
The X-scale (8) can be adjusted to view in percent, bars, length and de-
grees
e - Export to Excel
Another additional feature in the ‘measuring analyzing’ function is export-
ing your measurements to an excel-file. This can be obtained by clicking
the ‘Export to XLS..’-button (9).
CL-Profiler operating instructions page 12 of 15
www.cl-profiler.com
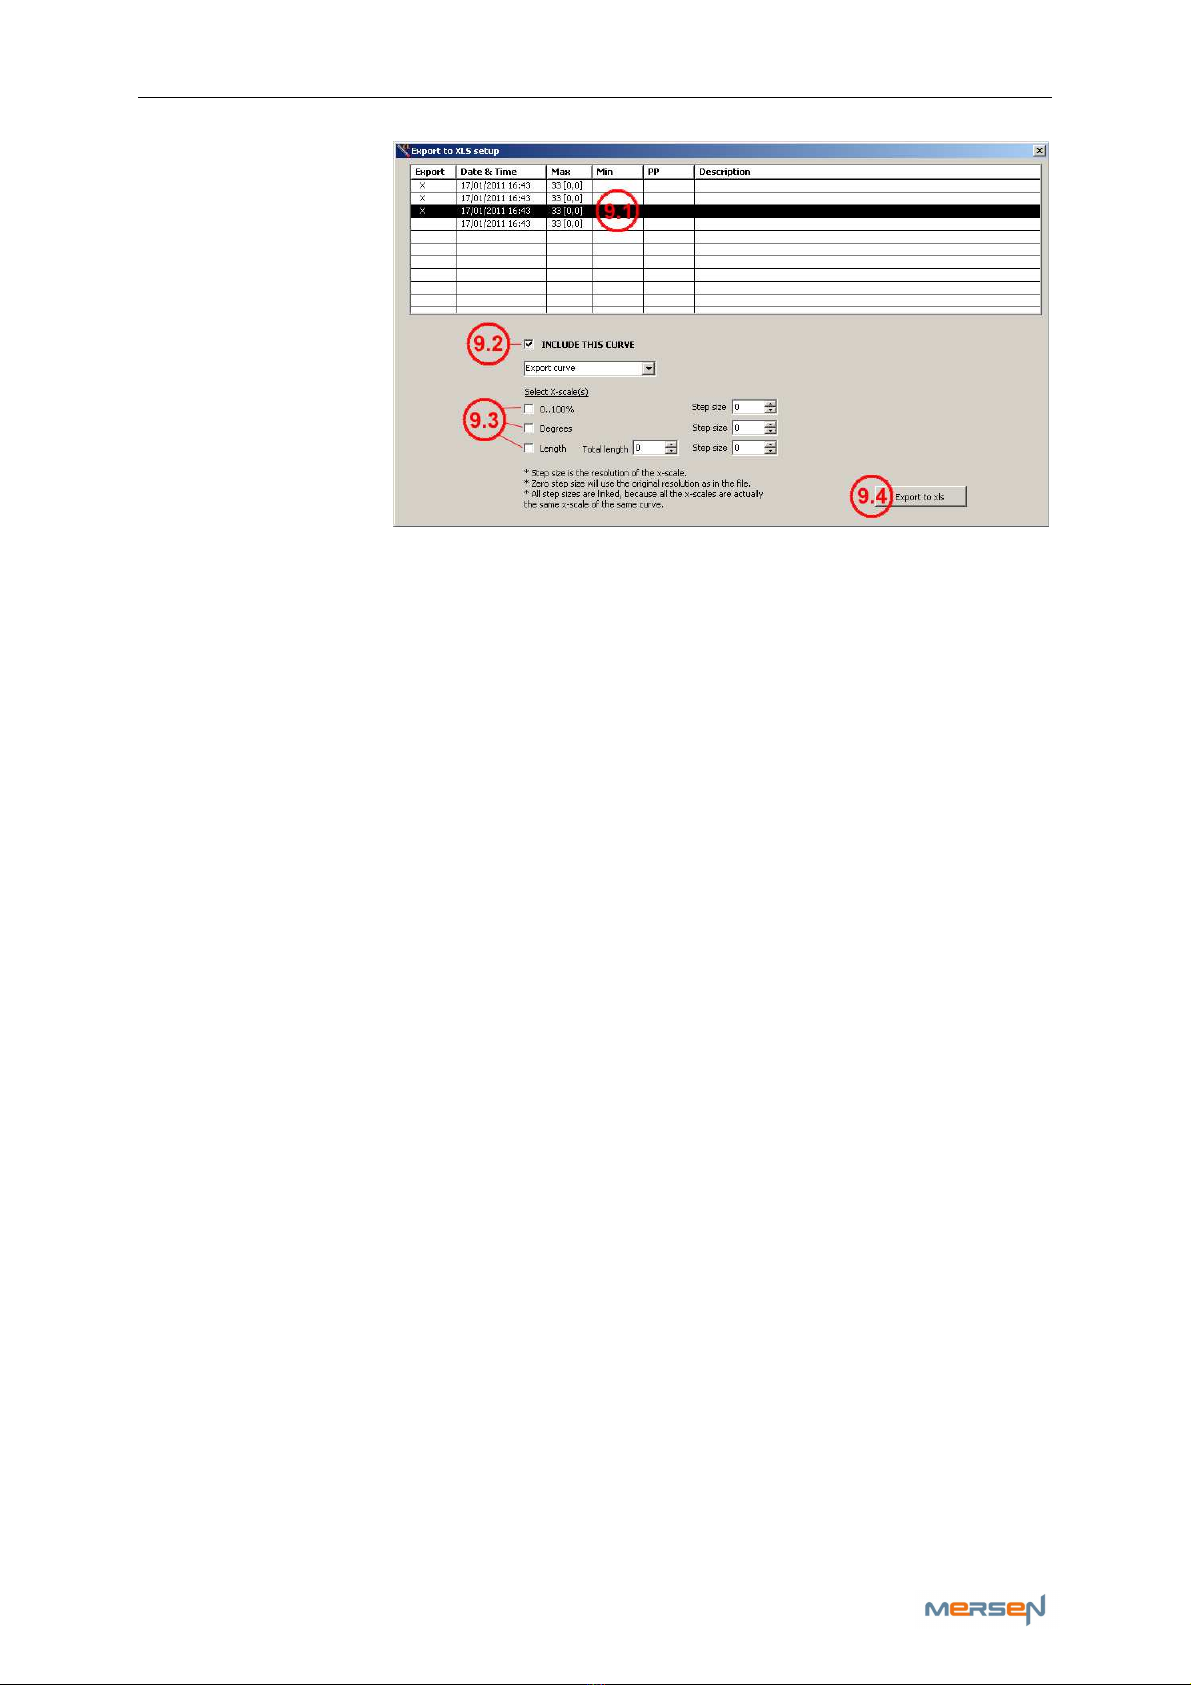
A window pops up
“Export to XLS
setup” in which
you can select the
curves you’d like
to export to Excel.
Select a curve
(9.1) and wink the
“Include this
Curve”-box (9.2)
to export the rele-
vant curve.
“Select X-scale” (9.3), gives you the option to export you’re curve(s) in
percent and/or degrees and/or length.
Once exported to xls (9.4), you can create an automatic Excel format to
calculate the different measurements in your curve(s). This way you can
systematically judge your curve(s) state.
f - Other buttons
The remaining buttons have similar function as explained in chapter (IV)
7) Vi oTi tool
ViRoTi stands for Virtual oller Tip and is used to profile grooved slip
rings and grooved commutators.
To use this tool you need
-two free USB ports on your computer
-two CL-profiler probes or one CL-profiler and one ViRoTi probe.
This function can only work on condition that the measure part “A” is
wider than the wide of the groove “B”, including the chamfers
Note Before using this tool you need to update the probe software. See
chapter (IV,2) d - CL-profiler software update
CL-Profiler operating instructions page 13 of 15
www.cl-profiler.com
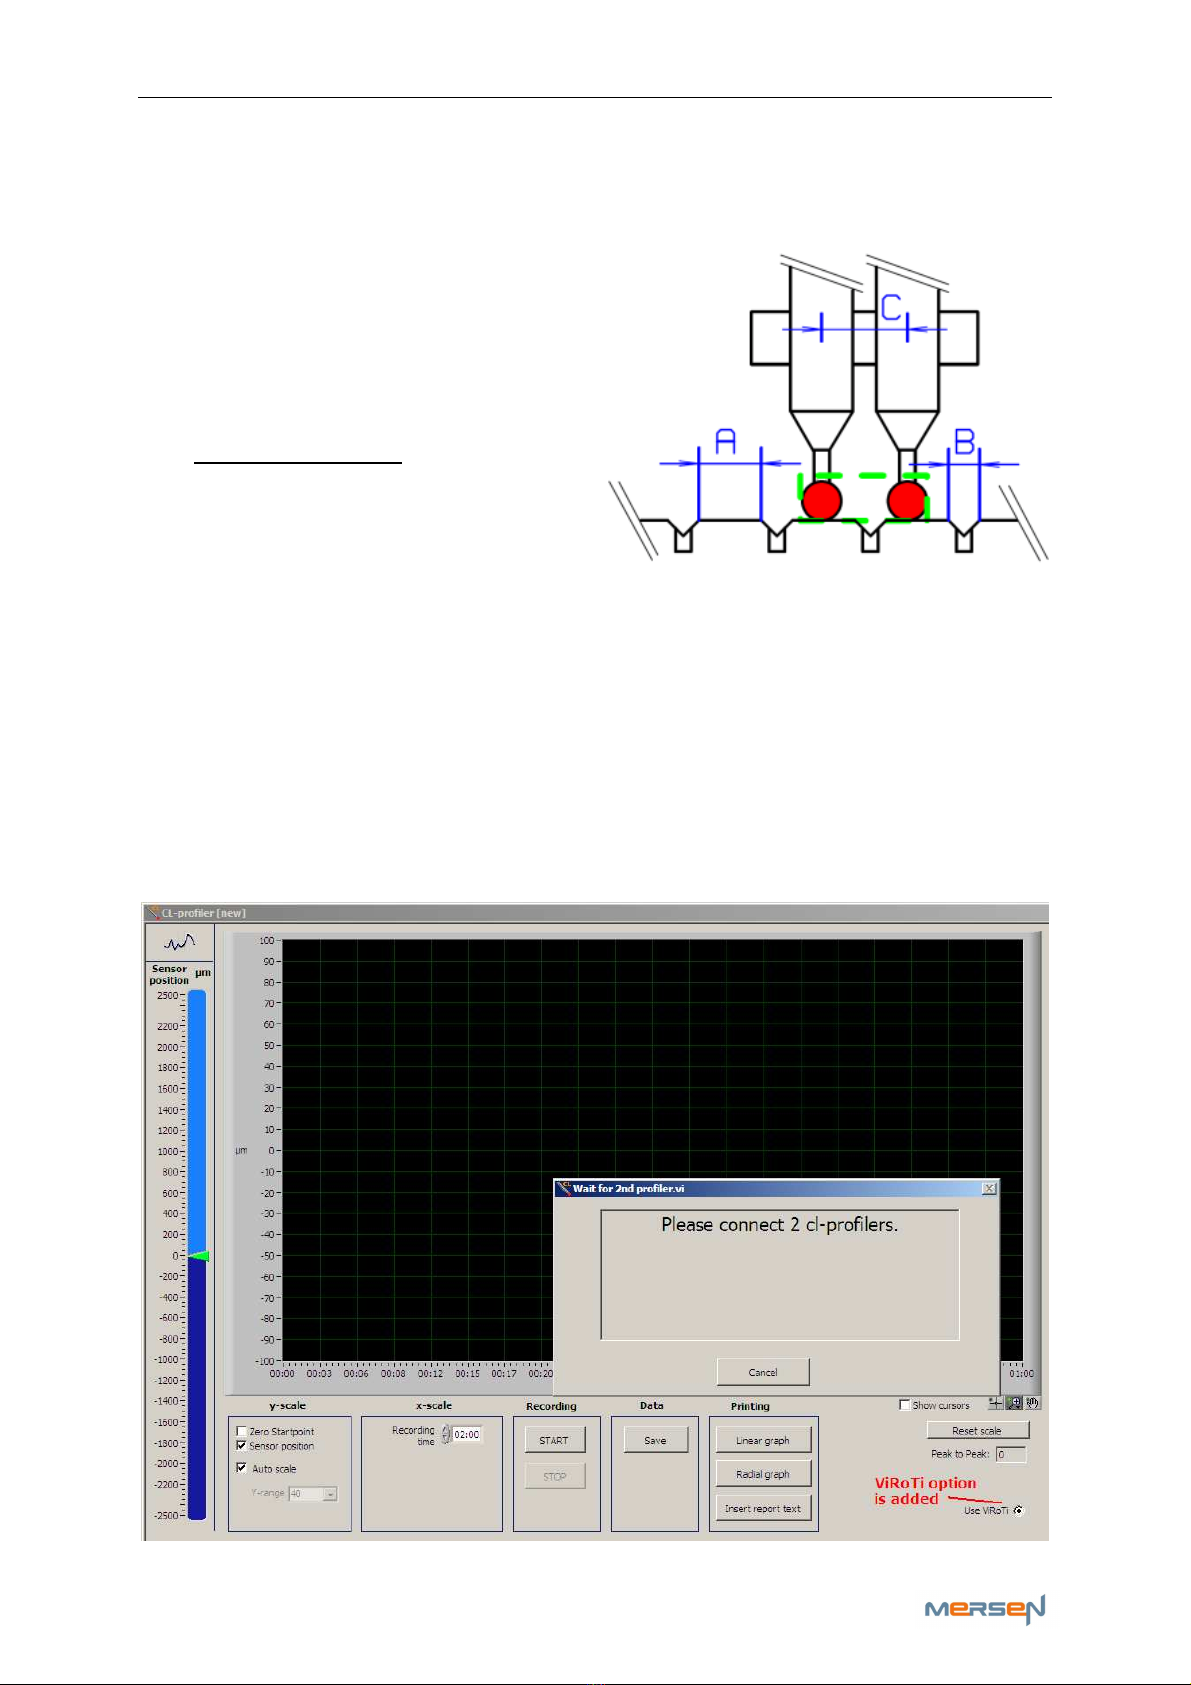
a – How to use
Place the probes radial, with an ax-
ial distance “C”, on your slip ring or
your collector.
To start the profiling both probes
must be located on your measure
part of the slip ring or collector,
and not in the groove.
Distance “C” depends on the wide
of the measure part (A) and the
groove (B). The probe distance “C”
can be calculated using the ViRoTi calculator in the “Settings menu”.
See chapter (IV,2) c - Vi oTi
Connect only the registered probe on your PC and start the CL-
profiler software.
Activate the ViRoTi tool by winking the box ‘Activate ViRoTi’ in the “Set-
tings”. A ViRoTi activation option will now be added in your measurement
window. If you activate the ViRoTi tool in your measure window, the soft-
ware will ask you to connect the second probe on your PC.

CL-Profiler operating instructions page 14 of 15
www.cl-profiler.com
After connecting the second probe on your PC you will see two needles
(red and green) in your measure window.
You can adjust the radial position of each probe separately, but it is not
necessary that both probes are exact identical. You can simply activate
“zero startpoint” before you start the profiling. The software will then
place both probes on the same level independent of the physical position
of the Ruby tip positions.
Please note for wide grooves or/and mica slots that you use the 8mm ruby
tips on both probes.
V) Maintenance
Make sure the cable to the sensor and USB port is not damaged. Clean
sensor when necessary.
It is recommended that the sensor is calibrated every two years.
VI) Warranty
The warranty covers construction and material faults of the CL-profiler
equipment.
The warranty period is valuable for 1 year starting on the invoice date.
Damage due to incorrect or inexpert handling is excluded from the war-
ranty.
The CL-profiler probe must be placed as radial as possible especially on
commutators. Angled probe position, can cause to damage.
The ballpoint tip diameter must be
-for mica slots approximately 4 times larger then the full width of
the mica slot including the chamfers.
-for spiral grooves approximately 3 times larger then the full width
of the groove including the chamfers.

CL-Profiler operating instructions page 15 of 15
www.cl-profiler.com
VII) Technical data
- Interface USB
- Dimensions 8 mm diameter
- Weight 0,1 Kg
- Max operating temperature 40°C
- Max Storage temperature 50°C
- Measurement range +/-2,5mm
- Max. variation speed to be measured 120/40Hz
- Sample rate 250Hz
- Typical noise level 0,5 µm
- Accuracy repetitive +/- 0,25 µm
- Accuracy relative +/- 1 µm
- Accuracy absolute by 20°C +/- 2 µm
VIII) Contact information
Mersen France Amiens S.A.S.
10, avenue Roger Dumoulin
F-80084 Amiens
France
Tel. +33 (0)3 22 54 45 00 - Fax +33 (0)3 22 54 45 62
www.mersen.com
www.cl-profiler.com
Table of contents


