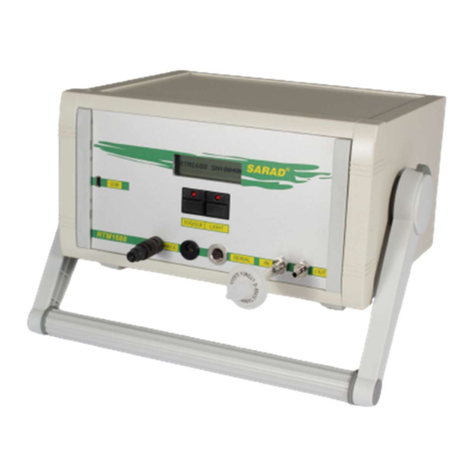
SARAD RTM1688-2 User manual

SARAD GmbH 1
User Manual RTM1688-2 06-02-2019.docx
User Manual RTM1688-2
Version 02/2019
SARAD GmbH
Wiesbadener Straße 10
D-01159 Dresden
GERMANY
Internet: www.sarad.de
Tel.: ++49 (0)351 / 6580712
FAX: ++49(0)351/6580718

SARAD GmbH 2
User Manual RTM1688-2 06-02-2019.docx
Content
Important Hint......................................................................................................................................... 3
Theory of Operation................................................................................................................................ 3
Operating the Instrument ....................................................................................................................... 5
Power supply....................................................................................................................................... 5
Input Filter........................................................................................................................................... 5
Carrying out a measurement............................................................................................................... 5
Adjustment of the sampling interval................................................................................................... 7
Operation Modes ................................................................................................................................ 7
Pump ............................................................................................................................................... 7
Alarm ............................................................................................................................................... 7
Fast/Slow Mode............................................................................................................................... 7
Sniffing............................................................................................................................................. 7
Data Handling...................................................................................................................................... 7
Data Storage.................................................................................................................................... 7
Printing a protocol........................................................................................................................... 8
Data transfer.................................................................................................................................... 9
Version RTM1688-2 MODBUS............................................................................................................... 10
General information.......................................................................................................................... 10
Selection of the transfer protocol, Addressing ................................................................................. 10
Implemented MODBUS functions ..................................................................................................... 10
RTM1688-2 GEO Version....................................................................................................................... 12
Power Supply..................................................................................................................................... 12
Optional GSM Modem....................................................................................................................... 12
Connection of the Soil Gas Probe...................................................................................................... 13
Specifications differing from the Standard Version .......................................................................... 13
Statistical Error (for non-mathematicians)............................................................................................ 13
Error Prediction ................................................................................................................................. 14
Detection Limit .................................................................................................................................. 16
Disposal instructions ............................................................................................................................. 17
Technical Data ....................................................................................................................................... 18

SARAD GmbH 3
User Manual RTM1688-2 06-02-2019.docx
Important Hint
The determination of the activity concentration of Radon is always a radiometric
measurement, meaning a counting experiment. This causes a number of specific
circumstances which have to take in consideration by the one who is carrying out this task.
Only the knowledge of those particularities allows the correct set-up of a test and avoids
misinterpretations of the achieved results.
Please read carefully the next chapters “Theory of Operation” and “Statistical Error” to
become familiar with this kind of radiometric measurements.
Theory of Operation
The Radon (Rn-222) gas concentration will be measured by the short living daughter
products, generated by the Radon decay inside a measurement chamber. Directly after the
decay, the remaining Po-218-nuclei become charged positively for a short period, because
some shell electrons are scattered away by the emitted alpha particle. Those ions are
collected by the electrical field forces on the surface of a semiconductor detector. The
number of collected Po-218 ions is proportional to the Radon gas concentration inside the
chamber. Po-218 itself decays with a half-life time of only 3.05 Minutes and about 50%
(particles emitted towards the detector surface) of all decays will be registered by the
detector. The equilibrium between the Radon decay rate and Po-218 detector activity is
given after about 5 half-life times, say 15 Minutes. This time span defines the minimum
achievable response time to a Radon concentration step.
Now, the decay chain is continued by the both beta emitters Pb-214 and Bi-214 followed by
another alpha emitter, the Po-214. That means, each Po-218 decay causes one more
detectable decay by the Po-214 which is delayed about 3 hours because of the superposed
half-life times of those nuclides. The emission energies of Po-218 and Po-214 are different
and therefore it is possible to separate both nuclides from each other by alpha spectroscopy.
The RTM1688-2 offers two calculation modes for the Radon concentration, one (Slow)
includes both, Po-218 and Po-214 decays and the other one includes Po-218 only (Fast). The
advantage of the “Fast” mode is the quick response to concentration changes while the
“Slow” mode gives the sensitivity twice as high compared with the fast mode. The higher
sensitivity reduces the statistical error of a measurement which depends on the number of
counted decay events only. The user should select the calculation mode carefully with
respect to the application specific requirements (see next chapter).
In case of Thoron (Rn-220), the direct daughter product Po-216 (which also underlies the
ionisation process) is used to calculate the Thoron activity concentration. The half-life of Po-
216 is less than 1s and therefore the equilibrium state between gas concentration and
collected activity on the detector is present immediately.

SARAD GmbH 4
User Manual RTM1688-2 06-02-2019.docx
The half-life of the Po-216 decay products Pb-212 (beta) and Pb-212/Bi-212 (alpha) are too
long to use them for Thoron measurement. The single nuclides of the Thoron decay chain
will be also separated by alpha spectroscopy.

SARAD GmbH 5
User Manual RTM1688-2 06-02-2019.docx
Operating the Instrument
Power supply
Please insert the fuse at the backside of the instrument before using the instrument. The
instrument has no power switch because the power consumption of the electronic circuits is
less than the self-discharge of the battery. After inserting the fuse the instrument enters the
stand by status, the display will show “RTM 1688 SN:XXXXX”. It is necessary to set the real
time clock of the instrument in that case (see manual “Radon Vision”)
To maximise the capacitance and battery life time, the battery should be charged from time
to time (each 3 month) even if the instrument is not in use. Otherwise the battery may
become discharged deeply which can cause malfunction of the internal microprocessor.
Remove the fuse if battery maintenance is not guaranteed over long periods.
The instrument is powered either by the internal 12V/3.2Ah lead gel battery or by the AC/DC
wall adapter included in delivery. The battery allows an autonomous operation for more
than 24 hours. The battery will recharged as long as the AC/DC adapter is connected, the red
LED on the “TOGGLE” button turns on. It takes about 8 hours for full charging in case of a
totally discharged battery. The end of the charging process will be indicated by a lighting LED
on the “LIGHT” button.
If the battery voltage drops below 11.8V, the display will show the phrase “LOW BATTERY!”
after finishing each integration interval. The measurement is still continued for several
hours. The pressing of the “TOGGLE” button leads back to the standard display output. If the
battery voltage decreases down to 11.2V the running sample will be stopped and the
instrument enters the stand by status.
Input Filter
The instrument is equipped with a high efficient multi-stage filter to prevent penetration of
daughter products into the measurement chamber. This filter will be protected against
contamination by an additional syringe filter fitted to the air inlet. Do not use the instrument
without that filter and replace it if required (becomes dark if loaded with dust). Take care for
the correct flow direction. Some filters can block the air flow completely when used in wrong
flow direction.
Carrying out a measurement
Press the push button to start a new measurement series. The pump starts and the display
will show the remaining time to complete the first integration interval.
RTM1688 SN:00001
Wait 120 Minutes
for first data!
The actual status and set-up information (see below) may be displayed by pressing the
button again.

SARAD GmbH 6
User Manual RTM1688-2 06-02-2019.docx
If the first interval has been completed, five different display pages are available. The several
pages can be toggled by repeated pressing the push button. Depending on the selected
system of units, the concentration values are given either in ‘Bq/m³’ or ‘pCi/L’ (mbar/inHg,
°C/°F)
The first page shows the actual Radon concentration (calculated for the last sampling
interval) with the statistical error for a 1 Sigma confidence interval. If “Fast” mode was
selected, a starlet is appended to the word “Radon” in the first row. Right beside, the time
stamp is given when the integration interval of the calculated concentration was finished
The bottom row contains at the left hand side the total number of integration intervals since
the last start of a measurement series. At the right hand side the pre-set integration interval
and the remaining time period of the actual sample is displayed.
RADON* 12:20
85Bq/m³±10%
#34 117/120Min
Page two gives the same information for Thoron (Rn-220)
Thoron 12:20
124Bq/m³±16%
#34 117/120Min
The readings of the additional sensors are shown at the third page. These values represent
averages which are derived from all “one Minute shots” of the entire integration interval.
Ambient 12:20
21.5°C 987mbar
46%rH 12.3V
The next page shows the average values of the Radon and Thoron concentration from the
start of the actual measurement series. The total sampling time is given in the first row.
Average 68.0Hrs
Rn: 314Bq/m³
Tn: 141Bq/m³
The last page contains the status information, beginning with the date and time of the start
of the measurement series followed by the actual alert settings in the second line. The lower
line shows the selected pump and sniffing mode.
>>17.04.06 16:32
ALM: 250Bq/m³
CONT. SNIFF216
To finish a measurement series keep the push button down and wait for at least four beeps
from the buzzer. If the button is released, the sample will be stopped. If the button has been
locked by software, the button has to be unlocked before.

SARAD GmbH 7
User Manual RTM1688-2 06-02-2019.docx
Adjustment of the sampling interval
The adjustment can be carried out as long the sampling is stopped. The “TOGGLE” button
must be hold down for at least 6 seconds (beeper). On the display appears:
INTERVAL: 1min
Now, the interval can be toggled by the button between 1, 5, 10, 15, 30, 60 and 120 minutes.
To accept the new setting, the button must be pressed again for at least 6 seconds.
Operation Modes
Pump
There are two different pump modes available, either continuous or interval pumping,
selectable by software. In continuous mode the pump is running during the whole
measurement period while the pump will switch off after the first five Minutes of each new
integration interval in case of interval mode. If the selected integration interval is less than
five Minutes the pump will run continuously too.
Alarm
If the measured Radon concentration exceeds the programmable alarm limit, the buzzer will
sound shortly each second. The alert has to be acknowledged by pressing the push button.
The alert check is performed after completion of each integration interval. If the alert is
enabled, “ALARM ON” will appear in the lower line of the status page.
Fast/Slow Mode
“Fast” and “Slow” mode will determine the kind of calculation of the Radon concentration.
Please refer to the chapters “Theory of Operation” and “Statistical Error”.
Sniffing
The sniffing function allows the user to detect Radon by an audible signal. That means that
any disintegration of the daughter products (either Po-216 only or Po-216 and Po-218,
dependent on the user settings) will cause a short beep. Especially the Po-216 (if present)
with its short half-life will give a rapid information about local concentration changes.
Data Handling
Data Storage
All data are stored in a non-volatile memory using a circular architecture. That means, the
last 511 data records (data of last 511 integration intervals) remain in the memory. Older
data will be overwritten if the memory exceeds the limit. Because the complete
measurement data are transferred during download to the PC, the memory should cleared
after successful data transmission and storage on hard disk. This will save time during the
next transmission and avoids redundant data storage.
Each data record is stored after completion of the integration interval and contains the full
information of this single integration interval:

SARAD GmbH 8
User Manual RTM1688-2 06-02-2019.docx
•time stamp
•integration time
•alpha spectrum
•readings of additional sensors
All sequential records with a time distance to the last record equal to the integration interval
are interpreted later as one measurement series. The measurement may be interrupted as
often as desired to finish the old and start a new measurement series. There is no limit for
the number of series. Single point measurements are also possible.
Printing a protocol
The RTM1688-2 enables the direct printout of acquired data on the portable protocol printer
AP 1300. Only the last acquired measurement series can be printed. Connect the printer to
the RTM by the adapter cable (9-pin SUB-D male to 3-pin round connector) included in the
delivery. To switch on the printer press the right button at the panel. The LED is constant,
green. Note: after about 30 seconds, the printer switches in the sleep mode if no print job is
carried out. To start a protocol print, the instrument has to set in stand-by mode - stop the
measurement in case of a running sample. Start the printing out by pressing the “TOGGLE”
button for at least 5 Seconds (wait for four beeps). During printing out the display will show
the phrase “...print protocol”. If a new series was started unintended, the measurement may
stopped again before completing the first interval. The print data remain valid as long.
The protocol header contains the serial number of the instrument, the start and the end of a
measurement series, the Radon and Thoron average concentrations and the time period
used for averaging (between start and end of the test). The header is followed by the
records of the measurement series containing time stamp, Radon and Thoron concentration
and environmental sensor readings.
_________________________
RTM1688 SN:XXXXX
Begin 06/12/23 12:34
End 06/12/24 17:34
Average 12.2Hrs
Radon 1234567Bq/m³
Thoron 1234567Bq/m³
_________________________
04/27/06 15:32
Radon 1234567Bq/m³±12%
Thoron 1234567Bq/m³±12%

SARAD GmbH 9
User Manual RTM1688-2 06-02-2019.docx
25.5°C 56%rH 1002mbar
... more records
__________________________
AP 1300 printer information: The printer is supplied by an internal rechargeable NiMH
battery which can re-charged using the 9V/270 mA AC/DC mains power adapter. It takes
about 15 hours to complete the charging process (full charged). During charging the LED
lights orange and blinks short green. A discharged battery is indicated by a short red blinking
LED. The LED blinks also red in case other problems.
To insert a new paper spool, the paper compartment can be opened by sliding the Lid
Release Button forward until the lid springs open. Unwind a small amount of paper from the
roll and insert the paper roll into the printer. Close the lid down, and the paper is loaded. For
more detailed information please look at the printer’s operation manual.
Data transfer
The acquired measurement data can be downloaded to a PC using the serial interface.
Connect the PC interface cable (9-pin SUB-D female to 3-pin round male) to both, instrument
and PC COM port. If the PC is not equipped with a standard COM port a USB to serial
converter can be used. For further information read the software manual.

SARAD GmbH 10
User Manual RTM1688-2 06-02-2019.docx
Version RTM1688-2 MODBUS
General information
A modified firmware is implemented in this version of the instrument which allows the
integration of the unit into MODBUS RTU (industrial standard) based networks. Because the
RTM1688-2 offers no native RS485 hardware interface, the instrument must be connected
to the bus lines through a commercial available RS232/RS485 converter. The converter must
support the automatic switch-over between the transfer directions. We recommend a
converter with optical-isolated RS485 data lines such as EXPERT EX9520R. The MODBUS
interface supports only the transmission of the recent readings. For all other functions the
SARAD standard protocol has to be used. The protocol frames are explained in detail by the
document “SARAD_MODBUS_Protocol”. The complete MODBUS Documentation can be
found in the internet under “modbus.org”.
In comparison with the standard instrument, for the MODBUS version the following
functions are skipped:
•Protocol printing
•Toggling of physical unis (US/SI) –only SI units are supported
•Display of setup parameter on the instrument display
Selection of the transfer protocol, Addressing
To identify a instrument within a network, a unique address in the range of 1…250 must be
assigned. This address can be programmed into the instrument using the initialization
software “RadonScoutInit”. The edit field “RD:SWV WR:ADR” contains after loading the
configuration parameters (GET) the recently programmed firmware version. Now, the
desired address can be entered and transferred to the instrument (SET). Please note that the
parameters have to be read at first before uploading the new setting.
The requested transfer protocol can be chosen by the Toggle button of the RTM1688-2.
Keep the button down for four beeps and release it. After that, the actually used protocol is
shown at the display. a short keystroke toggles the available protocols. For configuration
purposes (e.g. setting the address), data download etc. the item “SARAD protocol” must be
selected. The items “MODBUS 9600bps” and “MODBUS 19200bps” select the MODBUS
protocol running a different bus speeds.
After selection of the protocol, the button must be pressed again for four beeps to come
back to the main menu.
Implemented MODBUS functions
Function code 0x03 (read holding register)
Valid register addresses are:
Register
Address
Register content
Number of
registers
Format

SARAD GmbH 11
User Manual RTM1688-2 06-02-2019.docx
0x0000
Radon concentration [Bq/m³]
2
Float
0x0002
Statistical error of Radon concentration [%]
2
float
0x0004
Average Radon concentration since last start [Bq/m³]
2
Float
0x0006
Battery voltage [V]
2
Float
0x0008
Temperature [°C]
2
Float
0x000A
Relative humidity [%]
2
Float
0x000C
barometric pressure [mbar]
2
float
0x000E
Thoron concentration [Bq/m³]
2
Float
0x0010
Statistical error of Thoron concentration [%]
2
Float
0x0012
Average Thoron concentration since last start [Bq/m³]
2
Float
IEEE 745 float values (4 Byte) are transmitted as two sequential 16 bit registers. The number
of registers to be read must be two. That means, only one value can be transmitted per
frame. Other values and not stated register addresses will cause an exception response.

SARAD GmbH 12
User Manual RTM1688-2 06-02-2019.docx
RTM1688-2 GEO Version
The RTM188-2 GEO is a special version of the RTM1688-2. The control
panel of the unit, the battery and an optional modem have been
integrated into a sealed enclosure (IP68 protected). The Radon
measurement chamber, sensors for temperature and humidity as well
as the tilt detector are placed into a separate soil gas probe. The probe
is connected to the main unit by a single cable with a maximum length
of 10 Meters.
The operation of the instrument is equal to the standard version.
Power Supply
The 12 V / 12 Ah Lead-Gel battery is placed below the control panel.
The battery life time is approximately 2000 hours under normal
environmental conditions. Low temperatures or ageing will reduce
considerably the battery capacity. Only a few handles are necessary
to replace a discharged battery by a new one on site. For that, open
the enclosure and remove the cable sockets from the battery.
Loosen the nuts of the mounting rail and remove the rail. Pull out
the battery onwards. To insert a new battery follow those
instructions in reversed order. ATTENTION: Take care for the right
polarity of the battery terminals! A wrong polarity will definitely damage the instrument!
If the capacity of the original battery is too less, a larger 12 V lead acid battery can be
connected to the external power socket. In this case it is strictly required to remove the
internal battery firstly. Please check the right pin assignments of the connectors
The battery can be charged using the charge circuit of the control panel. Thus, the “CHARGE”
socket of the control panel and the external power socket are connected by a cable with a
plug on the panel side. It is recommended to use a separate powerful charger if using a
battery with a high capacity because the charge current of the internal charge circuit is
limited to approximately 500 mA. The external voltage of 15 to 18 VDC may be applied
permanently. Then, the internal battery works as a buffer in case of a power interruption.
Optional GSM Modem
The GSM modem is attached to the chassis below the battery. A special data cable enables
the communication between the instrument and the modem. The cable have to be
connected to the “SERIAL” socked of the control panel and to the 9-pin SUB-D socked of the
modem.
The antenna is connected to the coaxial (SMA) terminal at the opposite panel of the modem.
A short adapter cable is used to match the SMA standard to the standard antenna
connector. The screwed cable gland beside the power connector allows the user to draw the

SARAD GmbH 13
User Manual RTM1688-2 06-02-2019.docx
antenna cable into the enclosure. It is not possible to operate the antenna inside the
enclosure. The metal walls will attenuate the GSM signal dramatically.
The modem is supplied by the external power socket and will work only if an external
voltage is present. The power cable has to be connected to the power socked of the modem
beside the antenna connector.
Please note that the modem consumes a multiple of power compared with the instrument
even if it sleeps. The direct connection of the modem to the battery should be realised only
if the continuous recharging is provided. Discharging the battery below 11 V may damage
the battery and should be prevented by an additional voltage level switch.
Connection of the Soil Gas Probe
Connect the soil gas probe only if the measurement has been stopped before or if the power
supply has been interrupted (both, battery and external DC). Check the correct fit of the
plug. The cable must be no longer than 10 Meter. Keep it as short as possible depending on
the installation conditions.
Please read also the hints for installation and operation of the soil gas probe given in the
application note AN-007.
Specifications differing from the Standard Version
Sampling large area diffusion membrane
Response time (fast/slow) dependent on the used membrane
60 / 180 Minutes (125µm Silicon rubber)
Sensitivity (fast/slow) 0.8 / 1.8 cts/(min*kBq/m³)
Battery life time approximately 2000 hours (without modem)
Dimensions / Weight Electronics enclosure 230mm x 280mm x 111mm / 4kg
Soil gas probe 76.1mm dia. x 125mm (without socket); 650g
For further specification read the separate data sheet.
Statistical Error (for non-mathematicians)
The radioactive decay is a statistical process. That means, even if the Radon concentration is
constant over the time, the number of decays N counted within several intervals of the same
period will be different. N will vary around the mean value of all considered intervals.
Considering an infinite number of intervals would lead to an average which one indicates the
“true” result of N. For a single interval, the value of N will be either below or above the
“true” value. This observed deviation is covered by the term “Statistical Error”.
Therefore, each serious measurement contains beside the calculated Radon value the error
band for a stated confidence interval. The commonly used confidence intervals are 1, 2 or 3
Sigma () which refer to a likelihood of 68.3%, 95.45% and 99.73%.

SARAD GmbH 14
User Manual RTM1688-2 06-02-2019.docx
For example, the correct interpretation of a measured Radon concentration of 780 Bq/m³
with a statistical 1error of ±15% is:
The real “true” Radon concentration lies with a likelihood of 68.3% within the range from
663 Bq/m³ (780 Bq/m³ - 15%) to 897 Bq/m³ (780 Bq/m³ + 15%).
Error Prediction
The relative statistical error E for a chosen confidence interval of k-Sigma can be predicted
from the number of detected counts N by the equation:
E[%] = 100% * k * (N) / N
The simple consequence is: The higher the number of counts the higher is the accuracy of
the measurement. From the opposite point of view one could ask: How many counts I have
to detect to achieve a predefined uncertainty?
Two items will affect the number of counted decays: The sensitivity of the instrument at the
one hand side and the time period used for counting process (integration interval) on the
other hand.
While the sensitivity is an instrument specific constant, the integration interval may be
expanded to the maximum acceptable value for the desired time resolution of a
measurement series.
The relationship between the measured Radon concentration CRn and the number of counts
N within an integration interval T is:
CRn = N / (T * S)
whereby S represents the Sensitivity of the instrument, given in the unit [cts/(min*kBq/m³)].
The sensitivity using the slow mode is double as high as in the fast mode (see chapter
“Theory of Operation”) and whenever the required response time is more than 2 hours the
slow mode should be selected.
For the following examples a fast mode sensitivity of 4 cts/(min*kBq/m³) shall assumed
while the slow mode sensitivity shall be 8 cts/(min*kBq/m³).
The first question could be: Which integration interval T has to set to get a statistical
uncertainty less than 10% at a confidence level of 1if the expected Radon concentration is
200 Bq/m³?
A 1error of 10% requires 100 counts (100%* 1 * (100) / 100 = 10%). Using the fast mode,
the integration interval can be calculated by
T(fast) = N / (CRn * S) = 100 cts / (0.2 kBq/m³ * 4 cts/(min*kBq/m³) = 125 min.
Because the required interval is longer than 2 hours, the slow mode is the better choice,
leading to the following result:

SARAD GmbH 15
User Manual RTM1688-2 06-02-2019.docx
T(slow) = N / (CRn * S) = 100 cts / (0.2 kBq/m³ * 8 cts/(min*kBq/m³) = 62.5 min.
That looks pretty but makes no sense because of the longer response time. So we will set the
interval to 120 Minutes and ask for the statistical error in this case:
N(slow) = CRn * T * S = 0.2 kBq/m³ * 120 min * 8 cts/(min*Bq/m³) = 192 cts E(1) = 100 % * 1
* (N) / N = 100 % * 1 * (192) / 192 = 7.22 %
Now one could say
a more trustable result:
E(2) = 100 % * 2 * (N) / N = 100 % * 2 * (192) / 192 = 14.44 %
For interpretation look at begin of this chapter.
Is an observed concentration change statistical significant or not?
If you have a look at the acquired time distribution you will see variations of the
concentration from point to point. The question is now: Is it a real change in the Radon
concentration or only a statistical fluctuation?
The test is very simple: Define a confidence level with respect to your needs and look at the
statistical error bands of the two points of interest. If the error bands do not overlap each
other, the change in the Radon concentration is significant otherwise it “can be or not can
be”.
Example 1:
Reading 1: 1500 Bq/m³ ±10% error band [1350 ... 1650 Bq/m³]
Reading 2: 1300 Bq/m³ ±13% error band [1131 ... 1469 Bq/m³]
The upper limit of the error band of the reading 2 is higher than the lower limit of the error
band of reading 1. Because the “true” value could be placed within 1350 Bq/m³ and 1469
Bq/m³, the variation of both readings is not statistical significant.
Example 2:
Reading 1: 1500 Bq/m³ 10% error band [1350 ... 1650 Bq/m³]
Reading 2: 1000 Bq/m³ 15% error band [850 ... 1150 Bq/m³]
The error bands of the readings do not overlap each other. Therefore, a statistical significant
concentration change is given.
Two arbitrary points of a measurement series may be considered using this test. It is not
necessary that the points are direct neighbours.

SARAD GmbH 16
User Manual RTM1688-2 06-02-2019.docx
Detection Limit
The term Detection Limit defines the smallest value of the Radon concentration which
delivers a non-zero reading of the instrument within a given integration interval (at least 1
decay per interval). Because of the statistical behaviour a related confidence interval has to
be stated.
Why is it necessary to know the Detection Limit? If the set integration interval is short and
the Radon concentration low, the expected “true” value of the number of detected decays
may be around or less than 1. Because of the statistical variations, intervals without any
detected decay will appear frequently. The most extreme situation would be a measurement
series with a lot of “zero” intervals and only one interval with one detected decay (because a
decay cannot be split).
When calculating the Radon concentration by the given formula, the concentration value for
the interval with the one count is much too high while all other values show zero. Then, all
intervals have to be averaged to get a usable result. This procedure is nothing else than to
create an integration interval long enough to meet the Detection limit for the applied Radon
concentration. To avoid zero readings, set the integration interval with respect to the lowest
expected concentration level during measurement.
The mean („true“) value of the number of decays during an integration interval in case of a
Radon concentration in the surrounding of the detection limit is less than 16 and therefore
the statistical fluctuations have to be derived by the Poisson distribution. The stated
confidence interval gives the probability that the detected number of decays within the
interval is not zero.
Confidence Interval
Required Mean Value for N at the Detection Limit
63,2%
1
95%
3
99,75%
6
Example:
Determination of the detection limit of the Monitor using the „Fast-Mode“ and an
integration interval of 60 Minutes. The confidence interval shall be 95% (that means in about
95 from 100 intervals a no zero reading should appear):
Required mean value (number of counts from the table): N = 3. Calculating the detection
limit by the formula:
C = N / (T * S) = 3 cts / (60 min * 8 cts/(min*kBq/m³)) = 0.00625 kBq/m³ = 6.25 Bq/m³ The
detection limit in this case is 6.25 Bq/m³.

SARAD GmbH 17
User Manual RTM1688-2 06-02-2019.docx
Disposal instructions
Batteries and accumulators must not be disposed of in the garbage, but you are legally
obligated to return them to the appropriate waste collection centres. The measuring
instruments must be disposed of in the electronic waste or handed to the manufacturer at
the end of their service life for proper disposal. If necessary, they have to be
decontaminated before.

SARAD GmbH 18
User Manual RTM1688-2 06-02-2019.docx
Technical Data
Measurement Range
Radon/Thoron 1 Bq/m³ … 10 MBq/m³
Temperature -20 °C … 40 °C
Humidity 0 … 100 %
Bar. Pressure 800 mbar … 1200 mbar
Response time (95%)
Radon fast 15 Minutes
Radon slow 120 Minutes
Thoron 1 Minute
Sensitivity (fast/slow) 3 / 6.5 cts/(min*kBq/m³)
Sample Interval 1 … 255 Minutes (adjustable)
Memory 2047 data records (circular structure)
Pump rate 0.25 l/min
Internal volume (chamber/air loop) approx. 250 ml Power supply
Power supply
Battery operation > 7 days (continuous pumping)
> 14 days (pump in interval mode)
Recharge Time 8 Hours
AC/DC adapter 18V/1A
Interface USB, RS232
Protocols SARAD proprietary
MODBUS RTU (9600/19200bps)
ASCII Protocol print
Dimensions 232 mm x 182 mm x 135 mm
Weight 3.5 kg
Tamper detection if instrument is moved > 8 Seconds
User interface Display 3 x 16, 2 push buttons, buzzer
Other manuals for RTM1688-2
1
Table of contents
Other SARAD Measuring Instrument manuals